一、安装扩展源
[root@www ~]# rpm -ivh http://mirrors.yun-idc.com/epel/6/i386/epel-release-6-8.noarch.rpm
二、安装Nagios相关软件包
[root@www ~]# yum -y install httpd nagios nagios-plugins nagios-plugins-all nrpe nagios-plugins-nrpe
三、设置nagios后台登录用户名和密码
[root@www ~]# htpasswd -c /etc/nagios/passwd nagiosadmin #这里指定用户名为nagiosadmin,而不是其他 New password: Re-type new password: Adding password for user nagiosadmin
四、检查Nagios配置
[root@www ~]# nagios -v /etc/nagios/nagios.cfg Nagios Core 3.5.1 Copyright (c) 2009-2011 Nagios Core Development Team and Community Contributors Copyright (c) 1999-2009 Ethan Galstad Last Modified: 08-30-2013 License: GPL Website: http://www.nagios.org Reading configuration data... Read main config file okay... Processing object config file '/etc/nagios/objects/commands.cfg'... Processing object config file '/etc/nagios/objects/contacts.cfg'... Processing object config file '/etc/nagios/objects/timeperiods.cfg'... Processing object config file '/etc/nagios/objects/templates.cfg'... Processing object config file '/etc/nagios/objects/localhost.cfg'... Processing object config directory '/etc/nagios/conf.d'... Read object config files okay... Running pre-flight check on configuration data... Checking services... Checked 8 services. Checking hosts... Checked 1 hosts. Checking host groups... Checked 1 host groups. Checking service groups... Checked 0 service groups. Checking contacts... Checked 1 contacts. Checking contact groups... Checked 1 contact groups. Checking service escalations... Checked 0 service escalations. Checking service dependencies... Checked 0 service dependencies. Checking host escalations... Checked 0 host escalations. Checking host dependencies... Checked 0 host dependencies. Checking commands... Checked 24 commands. Checking time periods... Checked 5 time periods. Checking for circular paths between hosts... Checking for circular host and service dependencies... Checking global event handlers... Checking obsessive compulsive processor commands... Checking misc settings... Total Warnings: 0 Total Errors: 0 Things look okay - No serious problems were detected during the pre-flight check
五、启动Nagios和http服务
[root@www ~]# /etc/init.d/httpd start Starting httpd: [ OK ] [root@www ~]# /etc/init.d/nagios start Starting nagios: done.
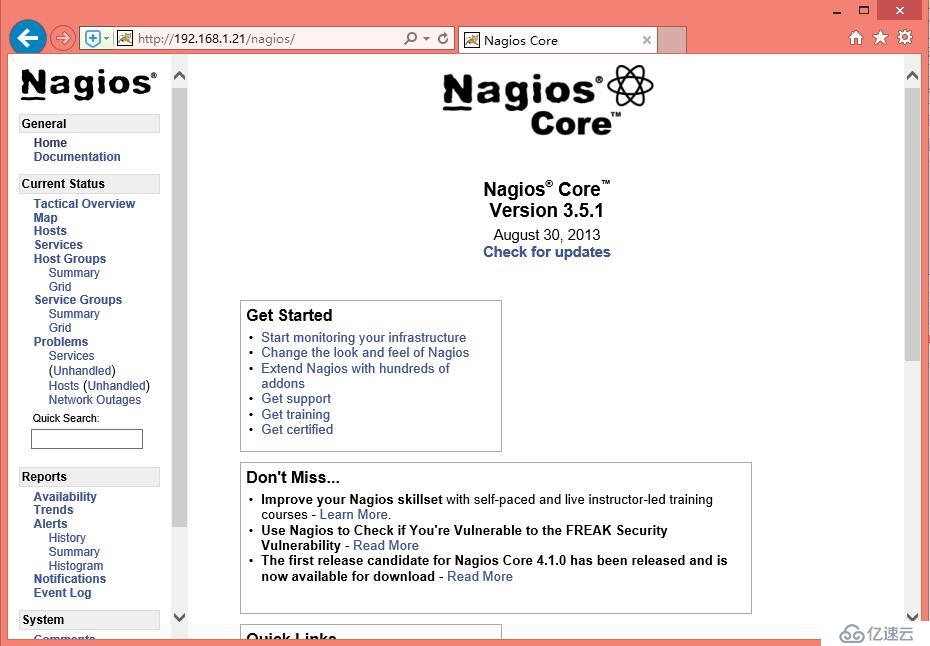
六、浏览器访问

七、Nagios添加被监控客户端主机
1、安装Nagios服务
[root@sh ~]# rpm -ivh epel-release-6-8.noarch.rpm [root@sh ~]# yum -y install nagios-plugins nagios-plugins-all nrpe nagios-plugins-nrpe
2、修改/etc/nagios/nrpe.cfg文件
[root@sh ~]# vim /etc/nagios/nrpe.cfg
81 allowed_hosts=127.0.0.1,192.168.1.21 #添加nagios服务端IP 97 dont_blame_nrpe=1 #0改为1
3、启动nrpe
[root@sh ~]# /etc/init.d/nrpe start Starting nrpe: [ OK ]
4、Nagios服务端添加被监控客户端主机
[root@www ~]# cd /etc/nagios/conf.d/ [root@www conf.d]# ls [root@www conf.d]# vim 192.168.1.251.cfg define host{ use linux-server host_name 192.168.1.251 alias 1.251 address 192.168.1.251 } define service{ use generic-service host_name 192.168.1.251 service_description check_ping check_command check_ping!100.0,20%!200.0,50% max_check_attempts 5 normal_check_interval 1 } define service{ use generic-service host_name 192.168.1.251 service_description check_ssh check_command check_ssh max_check_attempts 5 #当nagios检测到问题时,一共尝试检测5次都有问题才会告警,如果该数值为1,那么检测到问题立即告警 normal_check_interval 1 #重新检测的时间间隔,单位是分钟,默认是3分钟 notification_interval 60 #在服务出现异常后,故障一直没有解决,nagios再次对使用者发出通知的时间。如果你认为,所有的事件只需要一次通知就够了,可以把这里的选项设为0 } define service{ use generic-service host_name 192.168.1.251 service_description check_http check_command check_http max_check_attempts 5 normal_check_interval 1 }5、检查配置
[root@www conf.d]# nagios -v /etc/nagios/nagios.cfg
6、重启nagios
[root@www conf.d]# /etc/init.d/nagios restart Running configuration check...done. Stopping nagios: done. Starting nagios: done.
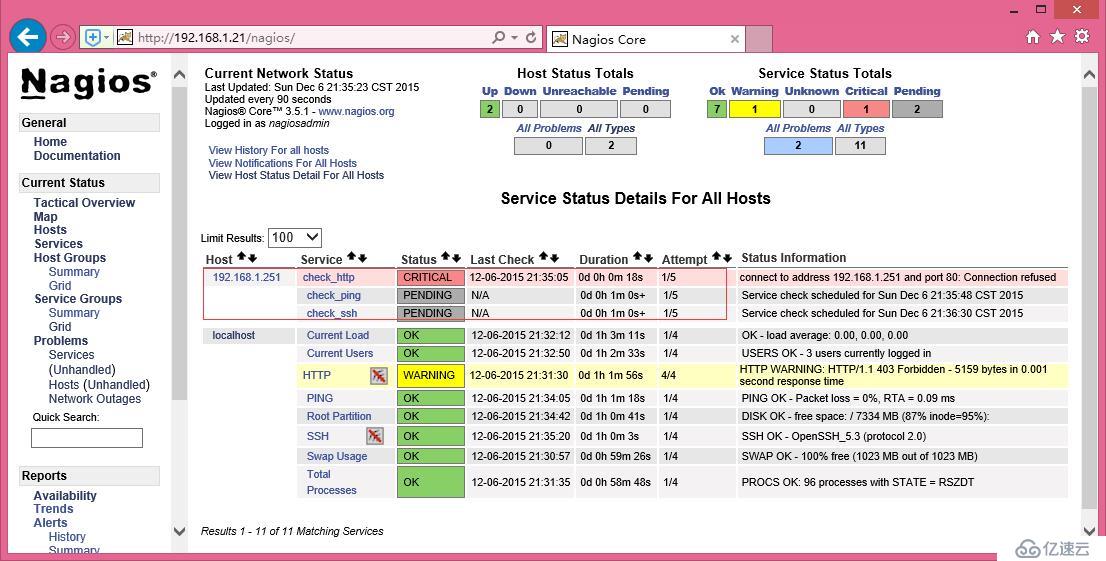
7、查看效果
八、添加nrpe支持的监控服务
1、添加nrpe服务
[root@www ~]# vim /etc/nagios/objects/commands.cfg ################################################################################ # 'notify-host-by-email' command definition define command{ command_name notify-host-by-email command_line /usr/bin/printf "%b" "***** Nagios *****\n\nNotification Type: $NOTIFICATIONTYPE$\nHost: $HO STNAME$\nState: $HOSTSTATE$\nAddress: $HOSTADDRESS$\nInfo: $HOSTOUTPUT$\n\nDate/Time: $LONGDATETIME$\n" | /bin/mail -s "** $NOTIFICATIONTYPE$ Host Alert: $HOSTNAME$ is $HOSTSTATE$ **" $CONTACTEMAIL$ } # 'notify-service-by-email' command definition define command{ command_name notify-service-by-email command_line /usr/bin/printf "%b" "***** Nagios *****\n\nNotification Type: $NOTIFICATIONTYPE$\n\nService : $SERVICEDESC$\nHost: $HOSTALIAS$\nAddress: $HOSTADDRESS$\nState: $SERVICESTATE$\n\nDate/Time: $LONGDATETIME$\n\nAd ditional Info:\n\n$SERVICEOUTPUT$\n" | /bin/mail -s "** $NOTIFICATIONTYPE$ Service Alert: $HOSTALIAS$/$SERVICEDESC$ is $SERVICESTATE$ **" $CONTACTEMAIL$ } define command{ command_name check_nrpe #自定义check command_line $USER1$/check_nrpe -H $HOSTADDRESS$ -c $ARG1$ } ################################################################################2、添加nrpe服务脚本
[root@www ~]# vim /etc/nagios/conf.d/192.168.1.251.cfg ...... #check_nrpe define service{ use generic-service host_name 192.168.1.251 service_description check_load #监控负载 check_command check_nrpe!check_load max_check_attempts 5 normal_check_interval 1 } define service{ use generic-service host_name 192.168.1.251 service_description check_disk_sda1 check_command check_nrpe!check_hda1 #check_nrpe为前面自定义的模块名称,check_hda1为被监控主机/etc/nagios/nrpe.cfg文件里定义的脚本名称 max_check_attempts 5 normal_check_interval 1 } #define service{ #可以添加多块磁盘监控 # use generic-service # host_name 192.168.1.251 # service_description check_disk_hda2 # check_command check_nrpe!check_hda2 # max_check_attempts 5 # normal_check_interval 1 #}[root@www ~]# nagios -v /etc/nagios/nagios.cfg ....... Total Warnings: 0 Total Errors: 0 Things look okay - No serious problems were detected during the pre-flight check
3、被监控主机通过nrpe.cfg文件定义的脚本命令
[root@sh ~]# vim /etc/nagios/nrpe.cfg # The following examples use hardcoded command arguments... command[check_users]=/usr/lib64/nagios/plugins/check_users -w 5 -c 10 command[check_load]=/usr/lib64/nagios/plugins/check_load -w 15,10,5 -c 30,25,20 command[check_hda1]=/usr/lib64/nagios/plugins/check_disk -w 20% -c 10% -p /dev/sda1 #command[check_hda2]=/usr/lib64/nagios/plugins/check_disk -w 20% -c 10% -p /dev/hda2 command[check_zombie_procs]=/usr/lib64/nagios/plugins/check_procs -w 5 -c 10 -s Z command[check_total_procs]=/usr/lib64/nagios/plugins/check_procs -w 150 -c 200
4、重启服务
[root@www ~]# /etc/init.d/nagios restart Running configuration check...done. Stopping nagios: done. Starting nagios: done.
[root@sh ~]# /etc/init.d/nrpe restart Shutting down nrpe: [ OK ] Starting nrpe: [ OK ]
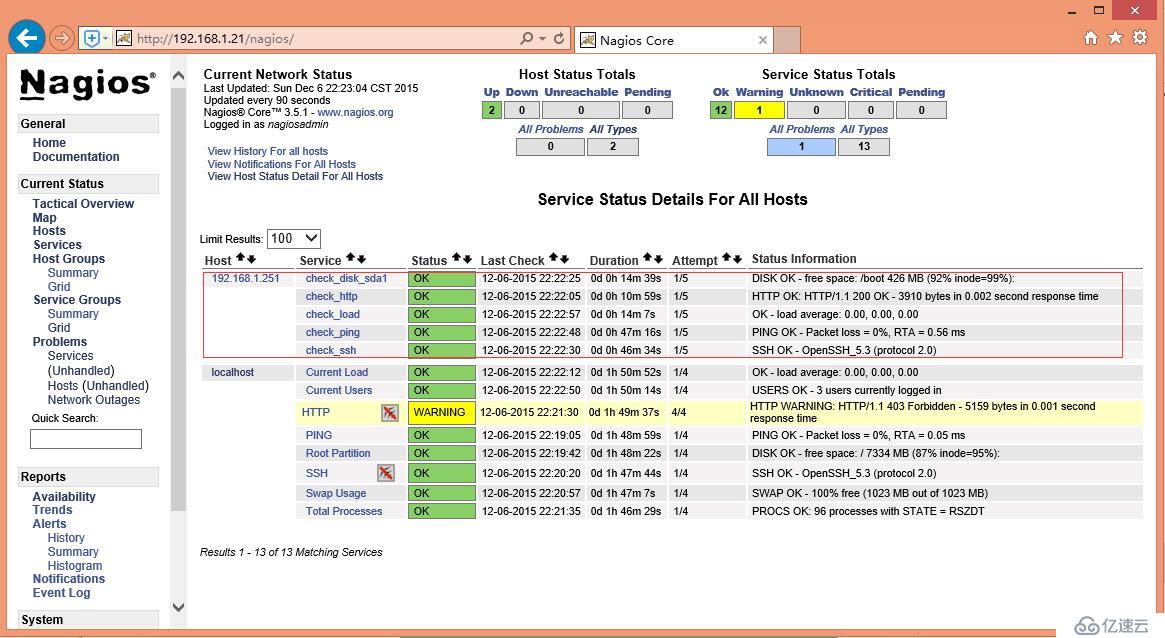
5、web页面查看结果
6、查看nagios日志文件
[root@www ~]# ls /var/log/nagios/ archives nagios.log objects.cache retention.dat spool status.dat
[root@www ~]# cat /var/log/nagios/nagios.log [1449405095] Nagios 3.5.1 starting... (PID=1319) [1449405095] Local time is Sun Dec 06 20:31:35 CST 2015 [1449405095] LOG VERSION: 2.0 [1449405095] Finished daemonizing... (New PID=1320) [1449405217] SERVICE ALERT: localhost;HTTP;WARNING;SOFT;1;HTTP WARNING: HTTP/1.1 403 Forbidden - 5159 bytes in 0.001 second response time [1449405277] SERVICE ALERT: localhost;HTTP;WARNING;SOFT;2;HTTP WARNING: HTTP/1.1 403 Forbidden - 5159 bytes in 0.001 second response time [1449405337] SERVICE ALERT: localhost;HTTP;WARNING;SOFT;3;HTTP WARNING: HTTP/1.1 403 Forbidden - 5159 bytes in 0.001 second response time [1449405397] SERVICE ALERT: localhost;HTTP;WARNING;HARD;4;HTTP WARNING: HTTP/1.1 403 Forbidden - 5159 bytes in 0.001 second response time [1449405683] Caught SIGTERM, shutting down... [1449405683] Successfully shutdown... (PID=1320) [1449405684] Nagios 3.5.1 starting... (PID=1474) [1449405684] Local time is Sun Dec 06 20:41:24 CST 2015 [1449405684] LOG VERSION: 2.0 [1449405684] Finished daemonizing... (New PID=1475) [1449408863] Caught SIGTERM, shutting down... [1449408863] Successfully shutdown... (PID=1475) [1449408863] Nagios 3.5.1 starting... (PID=1833) [1449408863] Local time is Sun Dec 06 21:34:23 CST 2015 [1449408863] LOG VERSION: 2.0 [1449408863] Finished daemonizing... (New PID=1834) [1449408913] SERVICE ALERT: 192.168.1.251;check_http;CRITICAL;SOFT;1;connect to address 192.168.1.251 and port 80: Connection refused [1449409033] SERVICE ALERT: 192.168.1.251;check_http;CRITICAL;SOFT;2;connect to address 192.168.1.251 and port 80: Connection refused [1449409153] SERVICE ALERT: 192.168.1.251;check_http;CRITICAL;SOFT;3;connect to address 192.168.1.251 and port 80: Connection refused [1449409273] SERVICE ALERT: 192.168.1.251;check_http;CRITICAL;SOFT;4;connect to address 192.168.1.251 and port 80: Connection refused [1449409393] SERVICE ALERT: 192.168.1.251;check_http;CRITICAL;HARD;5;connect to address 192.168.1.251 and port 80: Connection refused [1449409393] SERVICE NOTIFICATION: nagiosadmin;192.168.1.251;check_http;CRITICAL;notify-service-by-email;connect to address 192.168.1.251 and port 80: Connection refused [1449410874] Caught SIGTERM, shutting down... [1449410874] Successfully shutdown... (PID=1834) [1449410874] Nagios 3.5.1 starting... (PID=2330) [1449410874] Local time is Sun Dec 06 22:07:54 CST 2015 [1449410874] LOG VERSION: 2.0 [1449410874] Finished daemonizing... (New PID=2331) [1449411134] SERVICE ALERT: 192.168.1.251;check_http;OK;HARD;5;HTTP OK: HTTP/1.1 200 OK - 3910 bytes in 0.001 second response time [1449411134] SERVICE NOTIFICATION: nagiosadmin;192.168.1.251;check_http;OK;notify-service-by-email;HTTP OK: HTTP/1.1 200 OK - 3910 bytes in 0.001 second response time [1449411714] Caught SIGTERM, shutting down... [1449411714] Successfully shutdown... (PID=2331) [1449411714] Nagios 3.5.1 starting... (PID=2614) [1449411714] Local time is Sun Dec 06 22:21:54 CST 2015 [1449411714] LOG VERSION: 2.0 [1449411714] Finished daemonizing... (New PID=2615)
九、Nagios配置邮件警告
1、增加define contact和define contactgroup配置
[root@www ~]# vim /etc/nagios/objects/contacts.cfg # We only have one contact in this simple configuration file, so there is # no need to create more than one contact group. define contactgroup{ contactgroup_name admins alias Nagios Administrators members nagiosadmin } # add mail addressee define contact{ contact_name admin use generic-contact alias administrator email 741616710@qq.com } define contact{ contact_name ming use generic-contact alias HM email root@huangmingming.cn } define contactgroup{ contactgroup_name common alias common members admin,ming }2、修改define service,增加相应配置
[root@www ~]# vim /etc/nagios/conf.d/192.168.1.251.cfg
define service{
use generic-service
host_name 192.168.1.251
service_description check_http
check_command check_http
max_check_attempts 5
normal_check_interval 1
contact_groups common
notifications_enabled 1
notification_period 24x7
notification_options w,u,c,r
}
[root@www ~]# nagios -v /etc/nagios/nagios.cfg
免责声明:本站发布的内容(图片、视频和文字)以原创、转载和分享为主,文章观点不代表本网站立场,如果涉及侵权请联系站长邮箱:is@yisu.com进行举报,并提供相关证据,一经查实,将立刻删除涉嫌侵权内容。


