这篇文章主要介绍“Vue中如何使用Openlayer实现加载动画效果”,在日常操作中,相信很多人在Vue中如何使用Openlayer实现加载动画效果问题上存在疑惑,小编查阅了各式资料,整理出简单好用的操作方法,希望对大家解答”Vue中如何使用Openlayer实现加载动画效果”的疑惑有所帮助!接下来,请跟着小编一起来学习吧!
注意:实现动画时不能有scoped!!!!
通过gif
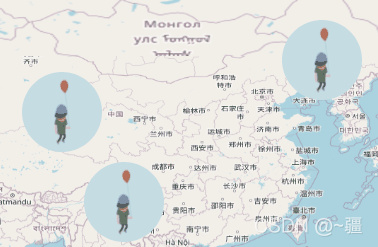
<template> <div class="test"> <div id="map" ref="map" ></div> </div> </template> <script> import "ol/ol.css"; import { Map, View, Overlay } from "ol"; import TileLayer from "ol/layer/Tile"; import OSM from "ol/source/OSM"; export default { name: "gif", data() { return { map: {}, overlay: {}, markerPoint: {}, geojsonData: { type: "FeatureCollection", features: [ { type: "Feature", properties: { title: "警报1", }, geometry: { type: "Point", coordinates: [91.48879670091165, 37.83814884701121], }, }, { type: "Feature", properties: { title: "警报2", }, geometry: { type: "Point", coordinates: [99.19515576149941, 26.713646654711134], }, }, { type: "Feature", properties: { title: "警报3", }, geometry: { type: "Point", coordinates: [123.74363825288785, 44.363694825734726], }, }, ], }, }; }, mounted() { this.initMap(); this.addGif(); }, methods: { // 初始化地图 initMap() { this.map = new Map({ target: "map", layers: [ new TileLayer({ source: new OSM(), }), ], view: new View({ projection: "EPSG:4326", center: [104.912777, 34.730746], zoom: 4.5, }), }); }, // 使用Overlay添加GIF动态图标点位信息 addGif() { let coordinates = this.getCoordinatesByGeojson(this.geojsonData); for (const i in coordinates) { let gif_span = document.createElement("span"); document.documentElement.appendChild(gif_span); this.$nextTick(() => { this.markerPoint = new Overlay({ position: coordinates[i], element: gif_span, positioning: "center-center", }); this.map.addOverlay(this.markerPoint); }); } }, //根据geojson数据获取坐标集 getCoordinatesByGeojson(geojsonData) { let coordinates = []; geojsonData.features.map((feature) => { coordinates = [...coordinates, feature.geometry.coordinates]; }); return coordinates; }, }, }; </script> <style lang='scss' > .test { span { display: inline-block; width: 80px; height: 80px; border-radius: 50%; background: url("https://smart-garden-manage.oss-cn-chengdu.aliyuncs.com/gif.gif") no-repeat; background-size: 80px 80px; } } </style>通过关键帧@keyframes

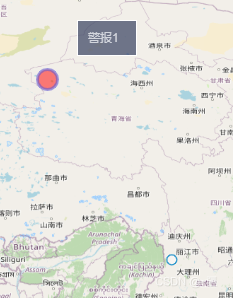
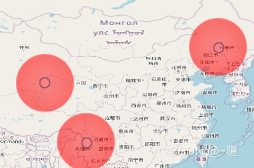
<template> <div class="test"> <div id="map" ref="map" ></div> </div> </template> <script> import "ol/ol.css"; import { Map, View, Overlay } from "ol"; import TileLayer from "ol/layer/Tile"; import OSM from "ol/source/OSM"; export default { name: "gif", data() { return { map: {}, overlay: {}, point_overlay: {}, geojsonData: { type: "FeatureCollection", features: [ { type: "Feature", properties: { title: "警报1", }, geometry: { type: "Point", coordinates: [91.48879670091165, 37.83814884701121], }, }, { type: "Feature", properties: { title: "警报2", }, geometry: { type: "Point", coordinates: [99.19515576149941, 26.713646654711134], }, }, { type: "Feature", properties: { title: "警报3", }, geometry: { type: "Point", coordinates: [123.74363825288785, 44.363694825734726], }, }, ], }, }; }, mounted() { this.initMap(); this.addGif(); }, methods: { // 初始化地图 initMap() { this.map = new Map({ target: "map", layers: [ new TileLayer({ source: new OSM(), }), ], view: new View({ projection: "EPSG:4326", center: [104.912777, 34.730746], zoom: 4.5, }), }); }, // 使用Overlay添加GIF动态图标点位信息 addGif() { let coordinates = this.getCoordinatesByGeojson(this.geojsonData); for (const i in coordinates) { let point_div = document.createElement("div"); point_div.className = "css_animation"; point_div.id = `coordinate_${i}`; document.documentElement.appendChild(point_div); this.$nextTick(() => { this.point_overlay = new Overlay({ position: coordinates[i], element: point_div, positioning: "center-center", }); this.map.addOverlay(this.point_overlay); }); } }, //根据geojson数据获取坐标集 getCoordinatesByGeojson(geojsonData) { let coordinates = []; geojsonData.features.map((feature) => { coordinates = [...coordinates, feature.geometry.coordinates]; }); return coordinates; }, }, }; </script> <style lang='scss' > .test { .css_animation { height: 50px; width: 50px; border-radius: 50%; background: rgba(255, 0, 0, 0.9); box-shadow: inset 0 0 8px red; transform: scale(0); animation: myfirst 3s; animation-iteration-count: infinite; //无限循环 } @keyframes myfirst { to { transform: scale(2); background: rgba(0, 0, 0, 0); box-shadow: inset 0 0 50px rgba(255, 0, 0, 0); } } } </style>既可加载动画,又可获取动画所在要素点的属性
注意:该代码存在问题。目前只能要么点击获取属性,要么展示动画,而不能同时存在,还有待优化!
<template> <div class="test"> <div id="map" ref="map" ></div> <div id="popup" style=" position: absolute; background-color: rgba(47, 57, 90, 0.678); bottom: 20px; left: 30px; border: 1px solid white; padding: 10px; width: 60px; " > {{ properties.title }} </div> </div> </template> <script> import "ol/ol.css"; import { Map, View, Overlay } from "ol"; import { OSM, Vector as VectorSource } from "ol/source"; import { Vector as VectorLayer, Tile as TileLayer } from "ol/layer"; import GeoJSON from "ol/format/GeoJSON"; import Select from "ol/interaction/Select"; import { altKeyOnly, click, pointerMove } from "ol/events/condition"; import { Fill, Stroke, Style, Circle } from "ol/style"; export default { name: "gif", data() { return { map: {}, layer: {}, overlay: {}, point_overlay: {}, geojsonData: { type: "FeatureCollection", features: [ { type: "Feature", properties: { title: "警报1", }, geometry: { type: "Point", coordinates: [91.48879670091165, 37.83814884701121], }, }, { type: "Feature", properties: { title: "警报2", }, geometry: { type: "Point", coordinates: [99.19515576149941, 26.713646654711134], }, }, { type: "Feature", properties: { title: "警报3", }, geometry: { type: "Point", coordinates: [123.74363825288785, 44.363694825734726], }, }, ], }, select: {}, properties: { title: "", }, }; }, mounted() { this.initMap(); // this.addGif();//注释掉后,点击可获取feature属性 }, methods: { // 初始化地图 initMap() { this.layer = new VectorLayer({ source: new VectorSource({ features: new GeoJSON().readFeatures(this.geojsonData), }), }); this.map = new Map({ target: "map", layers: [ new TileLayer({ source: new OSM(), }), this.layer, ], view: new View({ projection: "EPSG:4326", center: [104.912777, 34.730746], zoom: 4.5, }), }); this.select = new Select({ condition: click, //单击选择 }); this.map.addInteraction(this.select); let overlayer_popup = new Overlay({ element: document.getElementById("popup"), positioning: "center-center", //一定要加上,否则会有偏移 }); this.select.on("select", (e) => { let coordinate = e.mapBrowserEvent.coordinate; //获取选择的坐标 let featureSelect = e.selected[0]; //选中的feature要素 if (e.selected.length !== 0) { overlayer_popup.setPosition(coordinate); this.map.addOverlay(overlayer_popup); } else { overlayer_popup.setPosition(""); } if (featureSelect) { this.properties = featureSelect.getProperties(); //获取当前要素的所有属性 //设置选中的样式 featureSelect.setStyle( new Style({ image: new Circle({ radius: 10, fill: new Fill({ //矢量图层填充颜色,以及透明度 color: "rgba(255,0,0,0.5)", }), stroke: new Stroke({ //边界样式 color: "rgba(100, 90, 209, 0.6)", width: 3, }), }), }) ); } }); // 设置鼠标划过矢量要素的样式 this.map.on("pointermove", (e) => { const isHover = this.map.hasFeatureAtPixel(e.pixel); this.map.getTargetElement().style.cursor = isHover ? "pointer" : ""; }); }, // 使用Overlay添加GIF动态图标点位信息 addGif() { let coordinates = this.getCoordinatesByGeojson(this.geojsonData); for (const i in coordinates) { let point_div = document.createElement("div"); point_div.className = "css_animation"; point_div.id = `coordinate_${i}`; document.documentElement.appendChild(point_div); this.$nextTick(() => { this.point_overlay = new Overlay({ position: coordinates[i], element: point_div, positioning: "center-center", }); this.map.addOverlay(this.point_overlay); }); } }, //根据geojson数据获取坐标集 getCoordinatesByGeojson(geojsonData) { let coordinates = []; geojsonData.features.map((feature) => { coordinates = [...coordinates, feature.geometry.coordinates]; }); return coordinates; }, }, }; </script> <style lang='scss' scoped> .test { } </style> <style lang='scss' > .test { .css_animation { height: 50px; width: 50px; border-radius: 50%; background: rgba(255, 0, 0, 0.9); box-shadow: inset 0 0 8px red; transform: scale(0); animation: myfirst 3s; animation-iteration-count: infinite; //无限循环 } @keyframes myfirst { to { transform: scale(2); background: rgba(0, 0, 0, 0); box-shadow: inset 0 0 50px rgba(255, 0, 0, 0); } } } </style>到此,关于“Vue中如何使用Openlayer实现加载动画效果”的学习就结束了,希望能够解决大家的疑惑。理论与实践的搭配能更好的帮助大家学习,快去试试吧!若想继续学习更多相关知识,请继续关注亿速云网站,小编会继续努力为大家带来更多实用的文章!
免责声明:本站发布的内容(图片、视频和文字)以原创、转载和分享为主,文章观点不代表本网站立场,如果涉及侵权请联系站长邮箱:is@yisu.com进行举报,并提供相关证据,一经查实,将立刻删除涉嫌侵权内容。


