如何在matplotlib中利用mpldatacursor实现一个交互式数据光标?很多新手对此不是很清楚,为了帮助大家解决这个难题,下面小编将为大家详细讲解,有这方面需求的人可以来学习下,希望你能有所收获。
mpldatacursor包可以为matplotlib提供交互式的数据光标(弹出式注释框)。
它的典型功能是:
鼠标左键单击图表数据元素时会弹出文本框显示最近的数据元素的坐标值。
鼠标右键单击文本框取消显示数据光标。
按d键时切换显示\关闭数据光标。
如果matplotlib版本低于3.3可以直接使用pip安装
pip install mpldatacursor
如果matplotlib版本高于3.3,虽然pip安装成功,但是运行案例时会出现AttributeError: 'ScalarFormatter' object has no attribute 'pprint_val'错误。
通过查看源码可知:
try: # Again, older versions of mpl return formatter.pprint_val(x) except AttributeError: # 3.3.0 or later return formatter.format_data_short(x)
通过分析,预计是因为使用了国内pip源,mpldatacursor包还未修复该问题(pip 安装的 mpldatacursor包版本号是0.7.1)。
因此,建议到https://github.com/joferkington/mpldatacursor
下载源码,进行源码安装(源码安装的 mpldatacursor包版本号是0.7.dev0)。
python setup.py install
mpldatacursor包基本应用方式比较简单:
从mpldatacursor包中导入datacursor函数。
应用datacursor函数。
查看源码可知,mpldatacursor包的结构如下:
mpldatacursor convenience.py datacursor.py pick_info.py __init__.py
datacursor函数定义在convenience.py中,datacursor函数的返回值是DataCursor类实例。DataCursor类定义在datacursor.py中。pick_info.py定义了一系列和弹出文本框相关的函数,供DataCursor类调用。
由 datacursor函数定义可知:
datacursor函数可以不提供参数,这样图像内所有数据元素都会应用交互式数据光标。
datacursor函数可以指定哪些数据元素应用交互式数据光标。
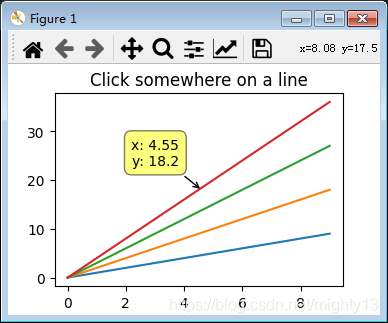
def datacursor(artists=None, axes=None, **kwargs): """ Create an interactive data cursor for the specified artists or specified axes. The data cursor displays information about a selected artist in a "popup" annotation box. If a specific sequence of artists is given, only the specified artists will be interactively selectable. Otherwise, all manually-plotted artists in *axes* will be used (*axes* defaults to all axes in all figures). Parameters ----------- artists : a matplotlib artist or sequence of artists, optional The artists to make selectable and display information for. If this is not specified, then all manually plotted artists in `axes` will be used. axes : a matplotlib axes of sequence of axes, optional The axes to selected artists from if a sequence of artists is not specified. If `axes` is not specified, then all available axes in all figures will be used. tolerance : number, optional The radius (in points) that the mouse click must be within to select the artist. Default: 5 points. formatter : callable, optional A function that accepts arbitrary kwargs and returns a string that will be displayed with annotate. Often, it is convienent to pass in the format method of a template string, e.g. ``formatter="{label}".format``. Keyword arguments passed in to the `formatter` function: `x`, `y` : floats The x and y data coordinates of the clicked point `event` : a matplotlib ``PickEvent`` The pick event that was fired (note that the selected artist can be accessed through ``event.artist``). `label` : string or None The legend label of the selected artist. `ind` : list of ints or None If the artist has "subitems" (e.g. points in a scatter or line plot), this will be a list of the item(s) that were clicked on. If the artist does not have "subitems", this will be None. Note that this is always a list, even when a single item is selected. Some selected artists may supply additional keyword arguments that are not always present, for example: `z` : number The "z" (usually color or array) value, if present. For an ``AxesImage`` (as created by ``imshow``), this will be the uninterpolated array value at the point clicked. For a ``PathCollection`` (as created by ``scatter``) this will be the "c" value if an array was passed to "c". `i`, `j` : ints The row, column indicies of the selected point for an ``AxesImage`` (as created by ``imshow``) `s` : number The size of the selected item in a ``PathCollection`` if a size array is specified. `c` : number The array value displayed as color for a ``PathCollection`` if a "c" array is specified (identical to "z"). `point_label` : list If `point_labels` is given when the data cursor is initialized and the artist has "subitems", this will be a list of the items of `point_labels` that correspond to the selected artists. Note that this is always a list, even when a single artist is selected. `width`, `height`, `top`, `bottom` : numbers The parameters for ``Rectangle`` artists (e.g. bar plots). point_labels : sequence or dict, optional For artists with "subitems" (e.g. Line2D's), the item(s) of `point_labels` corresponding to the selected "subitems" of the artist will be passed into the formatter function as the "point_label" kwarg. If a single sequence is given, it will be used for all artists with "subitems". Alternatively, a dict of artist:sequence pairs may be given to match an artist to the correct series of point labels. display : {"one-per-axes", "single", "multiple"}, optional Controls whether more than one annotation box will be shown. Default: "one-per-axes" draggable : boolean, optional Controls whether or not the annotation box will be interactively draggable to a new location after being displayed. Defaults to False. hover : boolean, optional If True, the datacursor will "pop up" when the mouse hovers over an artist. Defaults to False. Enabling hover also sets `display="single"` and `draggable=False`. props_override : function, optional If specified, this function customizes the parameters passed into the formatter function and the x, y location that the datacursor "pop up" "points" to. This is often useful to make the annotation "point" to a specific side or corner of an artist, regardless of the position clicked. The function is passed the same kwargs as the `formatter` function and is expected to return a dict with at least the keys "x" and "y" (and probably several others). Expected call signature: `props_dict = props_override(**kwargs)` keybindings : boolean or dict, optional By default, the keys "d" and "t" will be bound to deleting/hiding all annotation boxes and toggling interactivity for datacursors, respectively. If keybindings is False, the ability to hide/toggle datacursors interactively will be disabled. Alternatively, a dict of the form {'hide':'somekey', 'toggle':'somekey'} may specified to customize the keyboard shortcuts. date_format : string, optional The strftime-style formatting string for dates. Used only if the x or y axes have been set to display dates. Defaults to "%x %X". display_button: int, optional The mouse button that will triggers displaying an annotation box. Defaults to 1, for left-clicking. (Common options are 1:left-click, 2:middle-click, 3:right-click) hide_button: int or None, optional The mouse button that triggers hiding the selected annotation box. Defaults to 3, for right-clicking. (Common options are 1:left-click, 2:middle-click, 3:right-click, None:hiding disabled) keep_inside : boolean, optional Whether or not to adjust the x,y offset to keep the text box inside the figure. This option has no effect on draggable datacursors. Defaults to True. Note: Currently disabled on OSX and NbAgg/notebook backends. **kwargs : additional keyword arguments, optional Additional keyword arguments are passed on to annotate. Returns ------- dc : A ``mpldatacursor.DataCursor`` instance """import matplotlib.pyplot as plt import numpy as np from mpldatacursor import datacursor data = np.outer(range(10), range(1, 5)) fig, ax = plt.subplots() lines = ax.plot(data) ax.set_title('Click somewhere on a line') datacursor() plt.show()本实例中,有两个数据元素(artist):line1和line2,datacursor(line1)函数提供了参数line1,因此只有line1可以使用交互式数据光标,line2则没有效果。
import matplotlib.pyplot as plt import numpy as np from mpldatacursor import datacursor fig, ax = plt.subplots() line1 = ax.plot([1,3]) line2 = ax.plot([1,2]) ax.set_title('Click somewhere on a line') datacursor(line1) plt.show()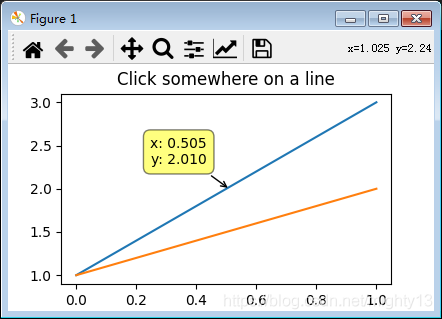
mpldatacursor提供了大量实际案例,详见https://github.com/joferkington/mpldatacursor/tree/master/examples。不再一一分析,仅简单说明功能。
basic_single_annotation.py:在多子图情况下,默认每个子图的数据光标是独立的,即每个子图都可以显示数据光标,相互不影响。使用datacursor(display='single')参数后,仅在当前子图显示数据光标,其余子图显示的数据光标自动关闭。
change_popup_color.py:提供了两个案例,一个取消了提示框的边框,一个将提示框的背景色改为白色。
hover_example.py:将数据光标的触发方式由鼠标左键单击改为鼠标悬浮。
show_artist_labels.py:将数据光标默认显示的坐标值改为数据元素的label。
highlighting_example.py:点击数据元素时,数据元素会高亮(黄色)显示。
draggable_example.py:在一个子图中,同时显示多个数据光标。
customize_keyboard_shortcuts.py:重新绑定数据光标快捷键。
labeled_points_example.py:自定义数据点标签。
date_example.py:日期数据显示。
bar_example.py:在柱状图中,在每个柱上方鼠标悬浮触发数据光标。
看完上述内容是否对您有帮助呢?如果还想对相关知识有进一步的了解或阅读更多相关文章,请关注亿速云行业资讯频道,感谢您对亿速云的支持。
免责声明:本站发布的内容(图片、视频和文字)以原创、转载和分享为主,文章观点不代表本网站立场,如果涉及侵权请联系站长邮箱:is@yisu.com进行举报,并提供相关证据,一经查实,将立刻删除涉嫌侵权内容。


