这篇文章将为大家详细讲解有关怎么在matplotlib中绘图样式,文章内容质量较高,因此小编分享给大家做个参考,希望大家阅读完这篇文章后对相关知识有一定的了解。
样式是定义图表可视化外观的配置,它由一组预置的rcParams参数构成。matplotlib预置了一系列样式风格,可直接使用。
样式相关模块为style。
matplotlib.style.available返回本机可用样式的列表。
列表只读,样式更新后,需要使用reload_library()重新加载样式。
In [1]: import matplotlib.style as style In [2]: style.available Out[2]: ['Solarize_Light2', '_classic_test_patch', 'bmh', 'classic', 'dark_background', 'fast', 'fivethirtyeight', 'ggplot', 'grayscale', 'seaborn', 'seaborn-bright', 'seaborn-colorblind', 'seaborn-dark', 'seaborn-dark-palette', 'seaborn-darkgrid', 'seaborn-deep', 'seaborn-muted', 'seaborn-notebook', 'seaborn-paper', 'seaborn-pastel', 'seaborn-poster', 'seaborn-talk', 'seaborn-ticks', 'seaborn-white', 'seaborn-whitegrid', 'tableau-colorblind10']
matplotlib.style.library以字典的形式返回所有样式的定义,字典键为样式名称,键为定义样式的 RcParams对象。
字典对象也是只读的,更新样式后,需要使用reload_library()重新加载样式。
In [6]: style.library['fast'] Out[6]: RcParams({'agg.path.chunksize': 10000, 'path.simplify': True, 'path.simplify_threshold': 1.0})matplotlib.style.reload_library()重新加载样式。
matplotlib.style.use(style)将matplotlib的绘图样式设置为某种样式。
使用default样式可以将样式为恢复到默认样式。
该函数只会更新style中定义的rcParams配置,其余rcParams配置保持不变。
参数style有四种取值:
str:样式名称或者样式文件的路径/url。通过style.available查看可用的样式名称。
dict:以rcParams配置项和值为键值对的字典。
Path:指向样式文件的Path对象。
list:样式支持组合使用,将多个样式配置配置放置在列表中,matplotlib将逐个执行列表中每个元素的配置,元素可以为str、Path或者dict,列表右边的元素会覆盖前面元素的配置。
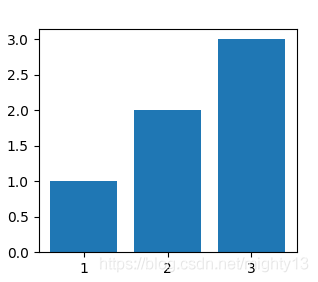
import matplotlib.pyplot as plt plt.bar([1,2,3],[1,2,3]) plt.show()
import matplotlib.pyplot as plt plt.style.use('ggplot') plt.bar([1,2,3],[1,2,3]) plt.show()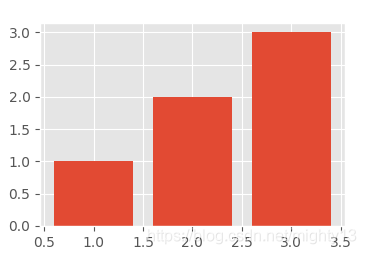
import matplotlib.pyplot as plt plt.style.use(['ggplot','dark_background']) plt.bar([1,2,3],[1,2,3]) plt.show()

import matplotlib.pyplot as plt plt.subplot(221) plt.bar([1,2,3],[1,2,3]) plt.style.use('ggplot') plt.subplot(222) plt.bar([1,2,3],[1,2,3]) plt.style.use('grayscale') plt.subplot(223) plt.bar([1,2,3],[1,2,3]) plt.style.use(['ggplot','grayscale']) plt.subplot(224) plt.bar([1,2,3],[1,2,3]) plt.show()关于怎么在matplotlib中绘图样式就分享到这里了,希望以上内容可以对大家有一定的帮助,可以学到更多知识。如果觉得文章不错,可以把它分享出去让更多的人看到。
免责声明:本站发布的内容(图片、视频和文字)以原创、转载和分享为主,文章观点不代表本网站立场,如果涉及侵权请联系站长邮箱:is@yisu.com进行举报,并提供相关证据,一经查实,将立刻删除涉嫌侵权内容。


