使用DragChartPanel怎么实现可拖拽曲线?很多新手对此不是很清楚,为了帮助大家解决这个难题,下面小编将为大家详细讲解,有这方面需求的人可以来学习下,希望你能有所收获。
初始化坐标格图:
chartpanel1 = new DragChartPanel(this); chartpanel1.setXtitle("时 间"); chartpanel1.setYtitle("负 荷(MW)"); chartpanel1.setDragLabel(jLabel1); chartpanel1.setTm((DefaultTableModel) jTable1.getModel()); chartpanel1.setStartRow(0); chartpanel1.setChartPanel(jPanel11);绘制曲线:
private void drawGraph(int col) { jLabel1.setText(""); int count = jTable1.getRowCount(); String[][] chartData1 = new String[1][count]; String[] chartIndex = new String[count]; DefaultTableModel tm = (DefaultTableModel) jTable1.getModel(); for (int i = 0; i < tm.getRowCount(); i++) { chartIndex[i] = tm.getValueAt(i, 0) == null ? "" : tm.getValueAt(i, 0).toString(); chartData1[0][i] = tm.getValueAt(i, col) == null ? "" : tm.getValueAt(i, col).toString(); } if (chartpanel1 != null) { chartpanel1.setEditColumn(col); chartpanel1.setData(chartData1); chartpanel1.setXLab(chartIndex); chartpanel1.setTitle(tm.getColumnName(col)); chartpanel1.setLs_linename(new String[]{tm.getColumnName(col)}); chartpanel1.getChart(); } }这个组件有一个缺点。只支持对列进行修改,这是这个组件的一个特点(拖动曲线表格的列会发生改动)。
为了使用它,很多表的结构就不得不迎合这一缺点。
例如如下表结构:
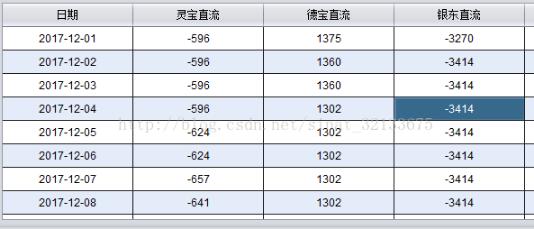
都是按列展示的。对于有些情况很不合理!如何解决(思考中。。。。。。)
上面思考的问题解决了!!!
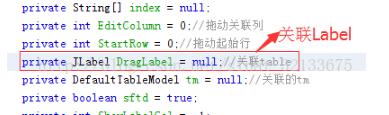
源码中有这样一个字段:
再使用的过程中会出现如下情况:
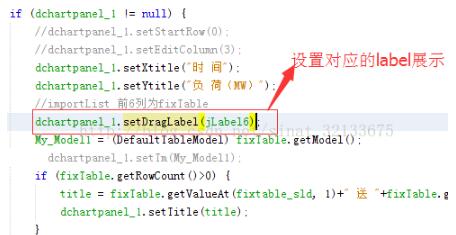
这个时候你get哪个model就无所谓了,为了避免影响,随便弄一样不会发生改变的model吧。
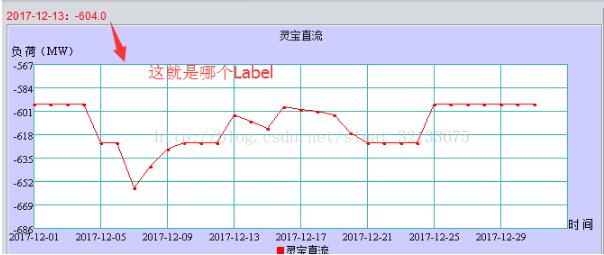
这样,拖动曲线的时候,label的值会实时显示曲线的坐标。
那么,给上面的label 加一个监听,改变值的时候,将label的内容用“:”分割开,不刚好是x轴和y轴的值了吗?
对应横向表格中,直接再label监听事件中就可以更改table的值。(完美!!!)
注意一下:有时拖动x轴的坐标是很详细很详细的数据移动,是因为你选这了setIndex而不是setXLab
private void initChartline() { //填充 图形 String[][] ChartData = new String[1][24]; String[] ChartIndex = new String[24]; if (fixTable.getRowCount() > 0) { for (int i = 0; i < dataTable.getColumnCount() - 2; i++) { ChartIndex[i] = String.valueOf(i); ChartData[0][i] = dataTable.getValueAt(fixtable_sld, i) == null ? "" : dataTable.getValueAt(fixtable_sld, i).toString(); } if (dchartpanel_1 != null) { //String pdate = (String) fixTable.getValueAt(fixTable.getSelectedRow(), 3); dchartpanel_1.setLs_linename(new String[]{"联络线曲线" + "ceshi1" + "(MW)"}); dchartpanel_1.setLcol(Lcol); dchartpanel_1.setXLab(ChartIndex);//setXLab 和setIndex的区别在于,setXLab拖动取值x轴是按照下标取值的,而setIndex则是拖动的位置,常常不是整数,推荐用前者 dchartpanel_1.setData(ChartData); //dchartpanel_1.setIndex(ChartIndex); dchartpanel_1.getChart(); } } }//曲线颜色 private java.awt.Color[] Lcol = { java.awt.Color.red, java.awt.Color.blue, java.awt.Color.blue};它的源码:
/* * To change this template, choose Tools | Templates * and open the template in the editor. */ package com.qctc.view.common.frame.pub; import com.qctc.common.util.period; import com.qctc.common.Constant; import com.qctc.view.common.frame.BaseSubTabModule; import com.qctc.view.common.frame.pub.datasysgraphdrag.datasysgraph; import java.awt.BorderLayout; import java.awt.Color; import java.awt.Container; import java.awt.Dimension; import javax.swing.JLabel; import javax.swing.JPanel; import javax.swing.table.DefaultTableModel; /** * * @author Administrator */ public class DragChartPanel { private java.awt.Color[] Lcol = Constant.Lcol; private Color bgcolor = new Color(204, 204, 255);//背景色 private Color rectcolor = Color.white;//图形矩形内颜色 public DragChartPanel(BaseSubTabModule parentModule, Color bgcolor, Color rectcolor) { this.bgcolor = bgcolor; this.rectcolor = rectcolor; this.parentModule = parentModule; initChartPanel(); } public DragChartPanel(BaseSubTabModule parentModule) { this.parentModule = parentModule; initChartPanel(); } public DragChartPanel() { initChartPanel(); } public void initChartPanel() { //设置是否翻页 chart.setMutiPage(false); chart.setConvertBool(true); //设置底色 chart.setBackColor(bgcolor); // chart.setBackColor(new Color(192,192,192)); //设置图形区域的边框颜色 chart.setBorderColor(Color.red); //设置图形区域的底色 // chart.setChartRectColor(new Color(204, 204, 250)); // if(Constant.SYSTEM_AREA.equals("山西")){ chart.setChartRectColor(rectcolor); // chart.setChartRectColor(new Color(74,74,107)); // } //设置xy坐标轴颜色 chart.setXyColor(new Color(30, 30, 30)); //设置标题颜色 chart.setTitleColor(new Color(30, 30, 30)); //设置网格颜色 chart.setGridColor(new Color(50, 180, 180)); //设置是否显示网格 1 显示 其他不显示 chart.setShowHidegrid(1); //设置显示点的大小 // chart.setShowHidep(0); // if (Constant.SYSTEM_AREA.equals("山西")) { chart.setShowHidep(1); // } //鼠标移动曲线上是否自动显示横纵坐标十字线 chart.setshowCrossLine(true); //设置鼠标移动曲线显示的十字线颜色 chart.setCrossLineColor(new Color(150, 180, 150)); //设置曲线类型:0 连续的曲线 3只显示点 chart.setLineType(0); //设置鼠标提示框框边颜色 chart.setLwBorderColor(Color.red); //设置鼠标显示提示框底色 chart.setLwColor(Color.yellow); //设置鼠标显示提示框提示字的颜色 chart.setLwTextColor(Color.white); //设置横竖网格线条数 chart.setXzPoints(9); chart.setYzPoints(10); chartpanel.setLayout(new BorderLayout()); chartpanel.add(getChart(), java.awt.BorderLayout.CENTER); chart.addMouseListener(new java.awt.event.MouseAdapter() { public void mousePressed(java.awt.event.MouseEvent evt) { dragState = true; } public void mouseReleased(java.awt.event.MouseEvent evt) { dragState = false; } }); } public boolean isDragState() { return dragState; } private boolean dragState = false; protected BaseSubTabModule parentModule; private JPanel chartpanel = new JPanel(); // private datasysgraph chart = new datasysgraph(); //图形参数 private double maxv = -999999999, minv = 999999999; private boolean maxv_zd = true; private boolean minv_zd = true; private String[][] data = null; private String[] ls_linename = null; private String title = ""; private String xtitle = ""; private String ytitle = ""; private int xpoints = 12; private int xmax = 96; private int xmin = 0; private String[] index = null; private int EditColumn = 0;//拖动关联列 private int StartRow = 0;//拖动起始行 private JLabel DragLabel = null;//关联table private DefaultTableModel tm = null;//关联的tm private boolean sftd = true; private int ShowLabelCol = -1; private int[] LineShowLabelCols; public void setSftd(boolean sftd) { this.sftd = sftd; } public void setShowLabelCol(int ShowLabelCol) { this.ShowLabelCol = ShowLabelCol; } public void setLineShowLabelCols(int[] LineShowLabelCols) { this.LineShowLabelCols = LineShowLabelCols; } public void setTm(DefaultTableModel tm) { this.tm = tm; } public void setDragLabel(JLabel DragLabel) { this.DragLabel = DragLabel; } public void setEditColumn(int EditColumn) { this.EditColumn = EditColumn; } public void setStartRow(int StartRow) { this.StartRow = StartRow; } public void setXtitle(String xtitle) { this.xtitle = xtitle; } public void setYtitle(String ytitle) { this.ytitle = ytitle; } public void setIndex(String[] index) { this.index = index; } public void setData(String[][] data) { this.data = data; } public void setLs_linename(String[] ls_linename) { this.ls_linename = ls_linename; } public void setTitle(String title) { this.title = title; } public datasysgraph getChart() { try { createChart(); return chart; } catch (Exception e) { e.printStackTrace(); return null; } } public datasysgraph getChartByColor(Color[] col) { try { createChartByColor(col); return chart; } catch (Exception e) { e.printStackTrace(); return null; } } /** * 设置chart要加入的JPanel * @param panel */ public void setChartPanel(JPanel panel) { Container parent = chartpanel.getParent(); if (parent != null) { parent.removeAll(); } panel.add(chartpanel); panel.setMinimumSize(new Dimension(300, 100)); } private void createChart() { setMaxMin(this.data); setPara(); setDragPara(); setXY(); buildChart(); } private void createChartByColor(Color[] col) { setMaxMin(this.data); setPara(); setDragPara(); setXY(); buildChartByColor(col); } /** * 生成图 */ private void buildChart() { try { if (this.data != null) { int len = this.data.length; for (int i = 0; i < len; i++) { chart.AddItem(ls_linename[i], data[i].length, this.Lcol[i]); chart.setPointValue(ls_linename[i], this.index, this.data[i]); } chart.refresh(); } } catch (Exception e) { e.printStackTrace(); } } /** * 生成图 */ private void buildChartByColor(Color[] col) { try { if (this.data != null) { int len = this.data.length; for (int i = 0; i < len; i++) { chart.AddItem(ls_linename[i], data[i].length, col[i]); chart.setPointValue(ls_linename[i], this.index, this.data[i]); } chart.refresh(); } } catch (Exception e) { e.printStackTrace(); } } /** * 设置参数 */ private void setPara() { try { chart.ClearAll(); chart.setTitle(this.title); chart.setLtitlex(this.xtitle); chart.setLtitley(this.ytitle); chart.setMutiPage(false); chart.setYbzzb(this.getMaxv(), this.getMinv()); chart.setShowLabelCol(ShowLabelCol); chart.setLineShowLabelCols(LineShowLabelCols); } catch (Exception e) { e.printStackTrace(); } } private void setDragPara() { // 拖动数据列设置 chart.setEditColumn(this.EditColumn); // 拖动起始行设置 chart.setStartIndex(this.StartRow); chart.setJlabel(this.DragLabel); // 是否 实现拖动 设置 chart.setIsDrag(this.sftd); chart.setTableDataModel(this.tm); } private String[] XLab = null; /** * 设置 图形x轴标签 * @param XLab */ public void setXLab(String[] XLab) { this.XLab = XLab; } public void setXpoints(int xpoints) { this.xpoints = xpoints; } /** * x轴显示坐标间隔点数 */ private int XTabN = 10; /** * 设置xy轴 */ private void setXY() { try { chart.setXzPoints(this.xpoints);//x轴 分割线 chart.setXmin(this.xmin); if (XLab == null) { chart.setXmax(this.xmax); this.xpoints = 12; period period1 = new period(); String[] ls_pd = new String[97]; for (int i = 0; i < 96; i++) { ls_pd[i] = period1.getPeriod()[i]; } ls_pd[96] = "24:00"; for (int i = 0; i <= 12; i++) { if (i == 0) { chart.SetXlab(i, ls_pd[i]); } else { chart.SetXlab(i, ls_pd[i * 8]); } } chart.setConvertBool(true); chart.setdxLab(ls_pd); } else { int len = this.data[0].length; this.XTabN = len / 8 + 1; this.xpoints = len / this.XTabN + 1; chart.setXzPoints(this.xpoints);//x轴 分割线 this.index = new String[len]; for (int i = 0; i < len; i++) { index[i] = String.valueOf(i); } this.xmax = this.xpoints * this.XTabN; chart.setXmax(this.xmax); String[] TmXLab = new String[this.xmax]; for (int i = 0; i < this.xmax; i++) { if (i < XLab.length) { TmXLab[i] = XLab[i]; } else { TmXLab[i] = ""; } } for (int i = 0; i < this.xpoints; i++) { if (i * this.XTabN < len) { chart.SetXlab(i, TmXLab[i * this.XTabN]); } else { chart.SetXlab(i, ""); } } chart.SetXlab(this.xpoints, " "); chart.setConvertBool(true); chart.setdxLab(TmXLab); } } catch (Exception e) { e.printStackTrace(); } } /** * 获取最值 * @param data */ private void setMaxMin(String[][] data) { if (this.maxv_zd) { this.maxv = -999999999; try { if (data != null) { for (int i = 0; i < data.length; i++) { for (int j = 0; j < data[i].length; j++) { if (data[i][j] != null && !data[i][j].equals("")) { try { double maxdd = Double.parseDouble( (data[i][j] == null || "null".equals(data[i][j]) || "".equals(data[i][j])) ? "0" : data[i][j]); if ( maxdd > getMaxv()) { this.maxv = maxdd; } } catch (Exception e1) { e1.printStackTrace(); } } } } } } catch (Exception e) { e.printStackTrace(); } if (getMaxv() == -999999999) { this.maxv = 100; } else { if (getMaxv() > 0) { this.maxv = getMaxv() * 1.05; } else { this.maxv = getMaxv() * 0.95; } } } if (this.minv_zd) { this.minv = 999999999; try { if (data != null) { for (int i = 0; i < data.length; i++) { for (int j = 0; j < data[i].length; j++) { if (data[i][j] != null && !data[i][j].equals("")) { try { double mindd = Double.parseDouble( (data[i][j] == null || "null".equals(data[i][j]) || "".equals(data[i][j])) ? "0" : data[i][j]); if (mindd < getMinv()) { this.minv = mindd; } } catch (Exception e1) { e1.printStackTrace(); } } } } } } catch (Exception e) { e.printStackTrace(); } if (getMinv() == 999999999) { this.minv = 0; } else { if (getMinv() > 0) { this.minv = getMinv() * 0.95; } else { this.minv = getMinv() * 1.05; } } } } /** * @return the Lcol */ public java.awt.Color[] getLcol() { return Lcol; } /** * @param Lcol the Lcol to set */ public void setLcol(java.awt.Color[] Lcol) { this.Lcol = Lcol; } /** * @return the maxv */ public double getMaxv() { return maxv; } /** * @param maxv the maxv to set */ public void setMaxv(double maxv) { this.maxv = maxv; this.maxv_zd = false; } /** * @return the minv */ public double getMinv() { return minv; } /** * @param minv the minv to set */ public void setMinv(double minv) { this.minv = minv; this.minv_zd = false; } /** * 返回修改的曲线数据 * 2013-04-08 hwh * @return */ public double[] getGraphDataY() { return chart.getGraphDataY(); } }看完上述内容是否对您有帮助呢?如果还想对相关知识有进一步的了解或阅读更多相关文章,请关注亿速云行业资讯频道,感谢您对亿速云的支持。
免责声明:本站发布的内容(图片、视频和文字)以原创、转载和分享为主,文章观点不代表本网站立场,如果涉及侵权请联系站长邮箱:is@yisu.com进行举报,并提供相关证据,一经查实,将立刻删除涉嫌侵权内容。


