жё©йҰЁжҸҗзӨәГ—
жӮЁеҘҪпјҢзҷ»еҪ•еҗҺжүҚиғҪдёӢи®ўеҚ•е“ҰпјҒ
еҜҶз Ғзҷ»еҪ•Г—
зҷ»еҪ•жіЁеҶҢГ—
зӮ№еҮ» зҷ»еҪ•жіЁеҶҢ еҚіиЎЁзӨәеҗҢж„ҸгҖҠдәҝйҖҹдә‘з”ЁжҲ·жңҚеҠЎжқЎж¬ҫгҖӢ
з”ЁжҲ·зҷ»еҪ•Г—
жӮЁеҘҪпјҢзҷ»еҪ•еҗҺжүҚиғҪдёӢи®ўеҚ•е“ҰпјҒ
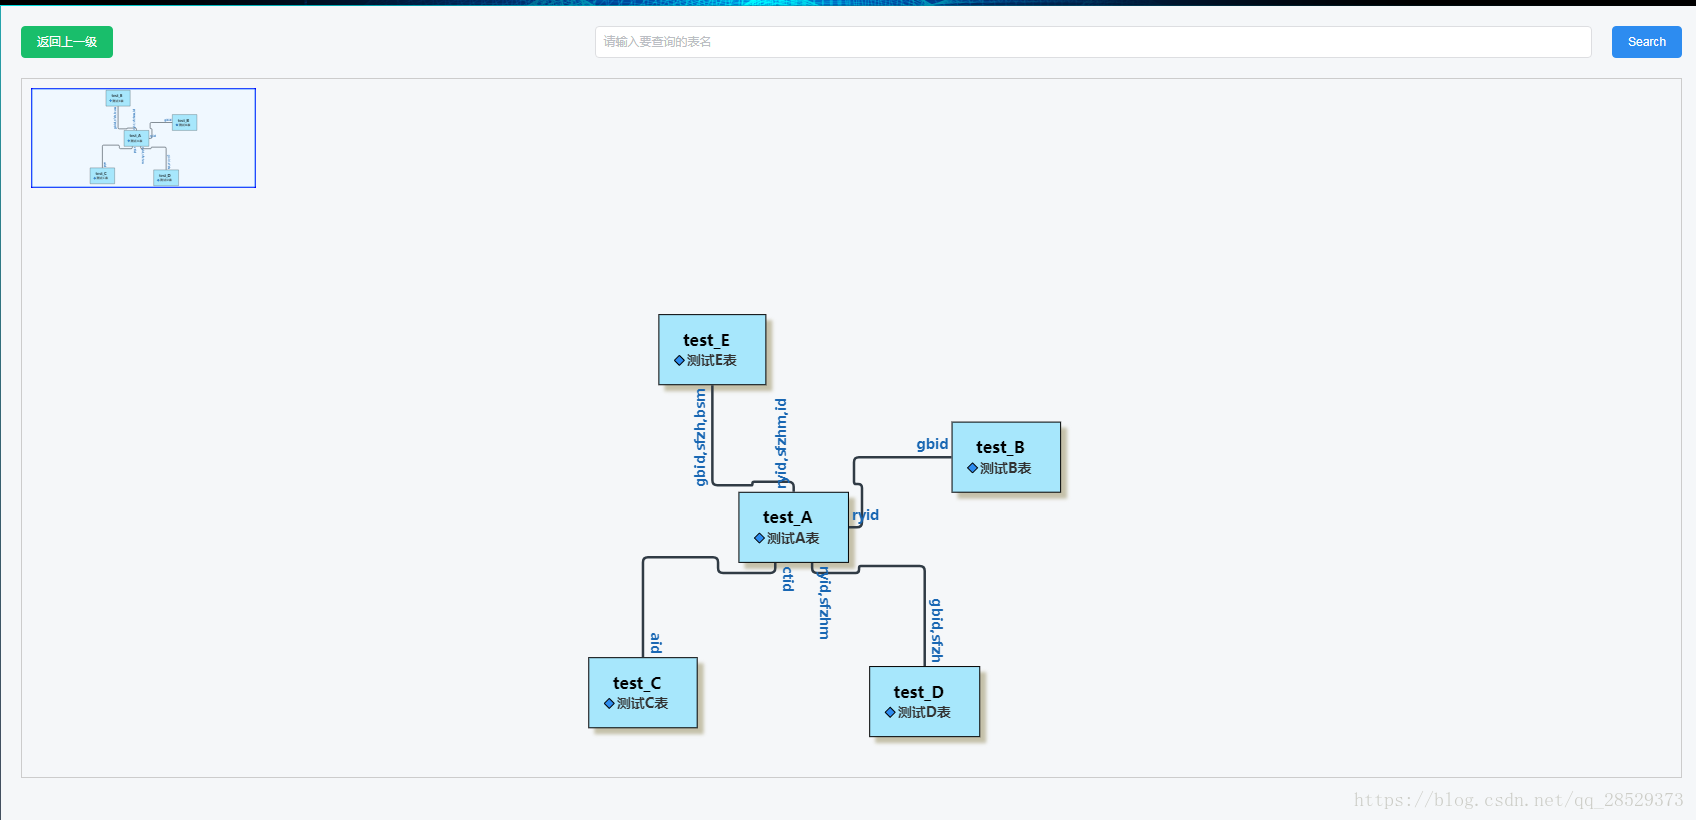
еҰӮдҪ•еңЁvue дёӯдҪҝз”Ёgojsз»ҳеҲ¶E-Rеӣҫпјҹй’ҲеҜ№иҝҷдёӘй—®йўҳпјҢиҝҷзҜҮж–Үз« иҜҰз»Ҷд»Ӣз»ҚдәҶзӣёеҜ№еә”зҡ„еҲҶжһҗе’Ңи§Јзӯ”пјҢеёҢжңӣеҸҜд»Ҙеё®еҠ©жӣҙеӨҡжғіи§ЈеҶіиҝҷдёӘй—®йўҳзҡ„е°ҸдјҷдјҙжүҫеҲ°жӣҙз®ҖеҚ•жҳ“иЎҢзҡ„ж–№жі•гҖӮ
Vueе…·дҪ“иҪ»йҮҸзә§жЎҶжһ¶гҖҒз®ҖеҚ•жҳ“еӯҰгҖҒеҸҢеҗ‘ж•°жҚ®з»‘е®ҡгҖҒ组件еҢ–гҖҒж•°жҚ®е’Ңз»“жһ„зҡ„еҲҶзҰ»гҖҒиҷҡжӢҹDOMгҖҒиҝҗиЎҢйҖҹеәҰеҝ«зӯүдјҳеҠҝпјҢVueдёӯйЎөйқўдҪҝз”Ёзҡ„жҳҜеұҖйғЁеҲ·ж–°пјҢдёҚз”ЁжҜҸж¬Ўи·іиҪ¬йЎөйқўйғҪиҰҒиҜ·жұӮжүҖжңүж•°жҚ®е’ҢdomпјҢеҸҜд»ҘеӨ§еӨ§жҸҗеҚҮи®ҝй—®йҖҹеәҰе’Ңз”ЁжҲ·дҪ“йӘҢгҖӮ
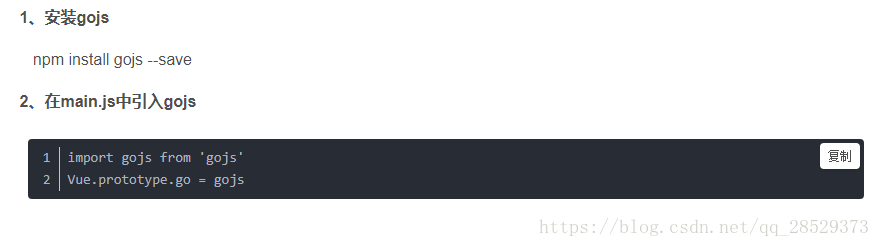
йҰ–е…ҲпјҢеңЁvueйЎ№зӣ®дёӯе®үиЈ…gojsзҡ„дҫқиө–еҢ…пјҢ并еңЁйЎ№зӣ®дёӯеј•е…ҘгҖӮ
еҲӣе»әtablePreview.vue
<style> #sample{ position: relative; margin: 20px; } #myOverviewDiv { position: absolute; width:225px; height:100px; top: 10px; left: 10px; background-color: aliceblue; z-index: 300; /* make sure its in front */ border: solid 1px blue; } #mySearch{ width: 60%; float: right; margin-right: 20px; } .input_button{ margin: 20px; } #entityRelation{ width: 100%; height: 700px; border:1px solid #cccccc; } .returnShang{ color: #fff; text-underline: none; } .returnShang:hover{ color: #fff; text-underline: none; } </style> <template> <div> <div class="input_button"> <Button type="success"><router-link to="/dataSourceAdmin" class="returnShang">иҝ”еӣһдёҠдёҖзә§</router-link></Button> <Button type="primary" @click="searchDiagram()" >Search</Button> <Input placeholder="иҜ·иҫ“е…ҘиҰҒжҹҘиҜўзҡ„иЎЁеҗҚ" id="mySearch" v-model="searchText" @keyup.enter.native="searchDiagram()"></Input> </div> <div id="sample"> <div id="entityRelation"></div> <div id="myOverviewDiv"></div> </div> </div> </template> <script src="./tablePreview.js"></script>еңЁjsж–Ү件дёӯз»ҳеҲ¶E-RеӣҫпјҢжіЁж„ҸпјҡеҲқе§ӢеҢ–ж–№йқўеҝ…йЎ»ж”ҫеңЁmountedдёӯи°ғз”ЁгҖӮ
tablePreview.jsеҰӮдёӢ
export default{ data() { return { myDiagram: '', searchText: '', tabViewList: '', tabRelView: '' } }, mounted() { var dataSoureId = JSON.parse(sessionStorage.getItem("previewInfo")).datasourceId let _this = this _this.$ajax.post(_this.cfg.api.dataPoolAdmin.tableRelView +'?datasourceId=' + dataSoureId) .then(function (res) { if(res.data.result) { _this.tabViewList = res.data.data.tabViewList _this.tabRelView = res.data.data.tabRelViewList _this.init() } }) }, methods: { init() { var go = this.go if (window.goSamples) goSamples(); // init for these samples -- you don't need to call this var a = go.GraphObject.make; // е®ҡд№үжЁЎжқҝ this.myDiagram = a(go.Diagram, 'entityRelation', // еҝ…йЎ»е‘ҪеҗҚжҲ–еј•з”Ёdiv htmlе…ғзҙ { initialContentAlignment: go.Spot.Center, allowDelete: false, allowCopy: false, layout: a(go.ForceDirectedLayout), "undoManager.isEnabled": true }); // define several shared Brushes var bluegrad = a(go.Brush, "Linear", { 0: "rgb(150, 150, 250)", 0.5: "rgb(86, 86, 186)", 1: "rgb(86, 86, 186)" }); var greengrad = a(go.Brush, "Linear", { 0: "rgb(158, 209, 159)", 1: "rgb(67, 101, 56)" }); var redgrad = a(go.Brush, "Linear", { 0: "rgb(206, 106, 100)", 1: "rgb(180, 56, 50)" }); var yellowgrad = a(go.Brush, "Linear", { 0: "rgb(254, 221, 50)", 1: "rgb(254, 182, 50)" }); var lightgrad = a(go.Brush, "Linear", { 1: "#E6E6FA", 0: "#FFFAF0" }); // the template for each attribute in a node's array of item data var itemTempl = a(go.Panel, "Horizontal", a(go.Shape, { desiredSize: new go.Size(10, 10) }, new go.Binding("figure", "figure"), new go.Binding("fill", "color")), a(go.TextBlock,//itemsж ·ејҸ { stroke: "#333333", row: 0, alignment: go.Spot.Center, margin: new go.Margin(0, 14, 0, 2), font: "bold 14px sans-serif" }, new go.Binding("text", "name")) ); // define the Node template, representing an entity this.myDiagram.nodeTemplate = a(go.Node, "Auto", // the whole node panel { selectionAdorned: true, resizable: true, layoutConditions: go.Part.LayoutStandard & ~go.Part.LayoutNodeSized, fromSpot: go.Spot.AllSides, toSpot: go.Spot.AllSides, isShadowed: true, shadowColor: "#CCAA" }, new go.Binding("location", "location").makeTwoWay(), // whenever the PanelExpanderButton changes the visible property of the "LIST" panel, // clear out any desiredSize set by the ResizingTool. new go.Binding("desiredSize", "visible", function(v) { return new go.Size(NaN, NaN); }).ofObject("LIST"), // define the node's outer shape, which will surround the Table a(go.Shape, "Rectangle", /*{ fill: lightgrad, stroke: "#756875", strokeWidth: 3 }),*/ new go.Binding("fill", "isHighlighted", function(h) { return h ? "#F44336" : "#A7E7FC"; }).ofObject()), a(go.Panel, "Table", { margin: 15, stretch: go.GraphObject.Fill }, a(go.RowColumnDefinition, { row: 0, sizing: go.RowColumnDefinition.None }), // the table header a(go.TextBlock, { row: 0, alignment: go.Spot.Center, margin: new go.Margin(0, 14, 0, 2), // leave room for Button font: "bold 16px sans-serif" }, new go.Binding("text", "key")), // жҠҳеҸ /еұ•ејҖжҢүй’® /*a("PanelExpanderButton", "LIST", // the name of the element whose visibility this button toggles { row: 0, alignment: go.Spot.TopRight }),*/ // the list of Panels, each showing an attribute a(go.Panel, "Vertical", { name: "LIST", row: 1, padding: 0,//иЎЁеҗҚеҲ°дёӢиҫ№жЎҶзҡ„и·қзҰ» alignment: go.Spot.TopLeft, defaultAlignment: go.Spot.Left, stretch: go.GraphObject.Horizontal, itemTemplate: itemTempl }, new go.Binding("itemArray", "items")) ) // end Table Panel ); // end Node // define the Link template, representing a relationship this.myDiagram.linkTemplate = a(go.Link, // the whole link panel { selectionAdorned: true, layerName: "Foreground", reshapable: true, routing: go.Link.AvoidsNodes, corner: 5, curve: go.Link.JumpOver, toEndSegmentLength: 100 }, a(go.Shape, // the link shape { stroke: "#303B45", strokeWidth: 2.5 }), a(go.TextBlock, // the "from" label { textAlign: "center", font: "bold 14px sans-serif", stroke: "#1967B3", segmentIndex: 0, segmentOffset: new go.Point(NaN, NaN), segmentOrientation: go.Link.OrientUpright }, new go.Binding("text", "text")), a(go.TextBlock, // the "to" label { textAlign: "center", font: "bold 14px sans-serif", stroke: "#1967B3", segmentIndex: -1, segmentOffset: new go.Point(NaN, NaN), segmentOrientation: go.Link.OrientUpright }, new go.Binding("text", "toText")) ); // create the model for the E-R diagram var nodeDataArray = [] for(var i =0; i< this.tabViewList.length; i++){ nodeDataArray.push(JSON.parse(JSON.stringify( { key: this.tabViewList[i].tableName, name: this.tabViewList[i].tableCnName, items: [{name: this.tabViewList[i].tableCnName, isKey: false, figure: 'Decision', color: "#2d8cf0"}] } ))) } var linkDataArray = [] for(var j =0; j< this.tabRelView.length; j++){ linkDataArray.push(JSON.parse(JSON.stringify( { from: this.tabRelView[j].fromTableName, to: this.tabRelView[j].toTableName, text: this.tabRelView[j].fromText, toText: this.tabRelView[j].toText }) )) } /*var nodeDataArray = [ { key: this.tabViewList[].tableName, items: [ { name: "и§’иүІж ҮиҜҶ:BIGINT", iskey: true, figure: "Decision", color: yellowgrad }, { name: "жЁЎеқ—ж ҮиҜҶ:BIGINT", iskey: false, figure: "Cube", color: bluegrad }] }, { key: "и§’иүІдҝЎжҒҜиЎЁ", items: [ { name: "ж ҮиҜҶ:BIGINT", iskey: true, figure: "Decision", color: yellowgrad }, { name: "еҗҚз§°:VARCHAR(100)", iskey: false, figure: "Cube1", color: bluegrad }, { name: "жҸҸиҝ°:VARCHAR(100)", iskey: false, figure: "Cube1", color: bluegrad }, { name: "жҺ’еәҸ:VARCHAR(100)", iskey: false, figure: "Cube1", color: bluegrad } ] }, { key: "з”ЁжҲ·жқғйҷҗиЎЁ", items: [ { name: "CategoryID", iskey: true, figure: "Decision", color: yellowgrad }, { name: "CategoryName", iskey: false, figure: "Cube", color: bluegrad }, { name: "Description", iskey: false, figure: "Cube", color: bluegrad }, { name: "Picture", iskey: false, figure: "TriangleUp", color: redgrad } ] }, { key: "з”ЁжҲ·дҝЎжҒҜиЎЁ", items: [ { name: "OrderID", iskey: true, figure: "Decision", color: yellowgrad }, { name: "ProductID", iskey: true, figure: "Decision", color: yellowgrad }, { name: "UnitPrice", iskey: false, figure: "MagneticData", color: greengrad }, { name: "Quantity", iskey: false, figure: "MagneticData", color: greengrad }, { name: "Discount", iskey: false, figure: "MagneticData", color: greengrad } ] }, { key: "иЎЁ1", items: [ { name: "OrderID", iskey: true, figure: "Decision", color: yellowgrad }, { name: "ProductID", iskey: true, figure: "Decision", color: yellowgrad }, { name: "UnitPrice", iskey: false, figure: "MagneticData", color: greengrad }, { name: "Quantity", iskey: false, figure: "MagneticData", color: greengrad }, { name: "Discount", iskey: false, figure: "MagneticData", color: greengrad } ] }, { key: "иЎЁ2", items: [ { name: "OrderID", iskey: true, figure: "Decision", color: yellowgrad }, { name: "ProductID", iskey: true, figure: "Decision", color: yellowgrad }, { name: "UnitPrice", iskey: false, figure: "MagneticData", color: greengrad }, { name: "Quantity", iskey: false, figure: "MagneticData", color: greengrad }, { name: "Discount", iskey: false, figure: "MagneticData", color: greengrad } ] }, { key: "иЎЁ3" }, { key: "иЎЁ4", items: [ { name: "OrderID", iskey: true, figure: "Decision", color: yellowgrad }, { name: "ProductID", iskey: true, figure: "Decision", color: yellowgrad }, { name: "UnitPrice", iskey: false, figure: "MagneticData", color: greengrad }, { name: "Quantity", iskey: false, figure: "MagneticData", color: greengrad }, { name: "Discount", iskey: false, figure: "MagneticData", color: greengrad } ] }, ];*/ /*var linkDataArray = [ { from: "и§’иүІжқғйҷҗиЎЁ", to: "и§’иүІдҝЎжҒҜиЎЁ", text: "N", toText: "1" }, { from: "и§’иүІжқғйҷҗиЎЁ", to: "з”ЁжҲ·жқғйҷҗиЎЁ", text: "N", toText: "1" }, { from: "з”ЁжҲ·дҝЎжҒҜиЎЁ", to: "и§’иүІжқғйҷҗиЎЁ", text: "N", toText: "1" }, { from: "иЎЁ1", to: "и§’иүІжқғйҷҗиЎЁ", text: "N", toText: "1" }, { from: "и§’иүІжқғйҷҗиЎЁ", to: "иЎЁ1", text: "N", toText: "1" }, { from: "иЎЁ2", to: "з”ЁжҲ·дҝЎжҒҜиЎЁ", text: "N", toText: "1" }, { from: "иЎЁ3", to: "з”ЁжҲ·дҝЎжҒҜиЎЁ", text: "N", toText: "1" }, { from: "иЎЁ4", to: "и§’иүІжқғйҷҗиЎЁ", text: "N", toText: "1" } ];*/ this.myDiagram.model = new go.GraphLinksModel(nodeDataArray, linkDataArray); // Overview var myOverview = a(go.Overview, "myOverviewDiv", // the HTML DIV element for the Overview { observed: this.myDiagram, contentAlignment: go.Spot.Center }); }, searchDiagram() { // called by button var input = document.getElementById("mySearch"); if (!input) return; input.focus(); this.myDiagram.startTransaction("highlight search"); if (this.searchText) { // search four different data properties for the string, any of which may match for success // create a case insensitive RegExp from what the user typed var regex = new RegExp(this.searchText, "i"); var results = this.myDiagram.findNodesByExample({ key: regex },{name: regex}); this.myDiagram.highlightCollection(results); // try to center the diagram at the first node that was found if (results.count > 0) this.myDiagram.centerRect(results.first().actualBounds); } else { // empty string only clears highlighteds collection this.myDiagram.clearHighlighteds(); } this.myDiagram.commitTransaction("highlight search"); } } }иҝҷйҮҢеңЁgojsзҡ„EntityRelationshipе®һдҫӢзҡ„еҹәзЎҖдёҠпјҢеҠ дәҶйҒ®зҪ©еӣҫдёҺжҗңзҙўеҗҺй«ҳдә®жҳҫзӨәеҠҹиғҪгҖӮ
йҒ®зҪ©еұӮзҡ„дҪңз”ЁжҳҜеҪ“жңүеҫҲеӨҡж•°жҚ®ж—¶пјҢеҸҜд»ҘйҖҡиҝҮжӢ–еҠЁйҒ®зҪ©еұӮжқҘжҹҘжүҫгҖӮ
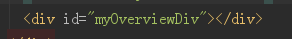
иҝҷдёӘжҳҜйҒ®зҪ©еұӮзҡ„div
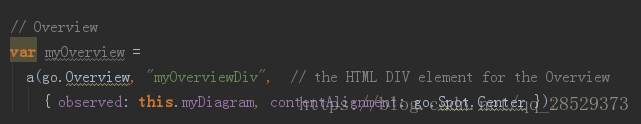
иҝҷйҮҢжҳҜжҠҠд№ӢеүҚе®ҡд№үеҘҪзҡ„Diagramж”ҫиҝӣйҒ®зҪ©еұӮгҖӮ
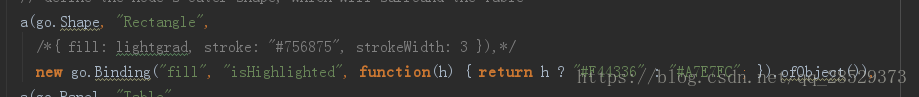
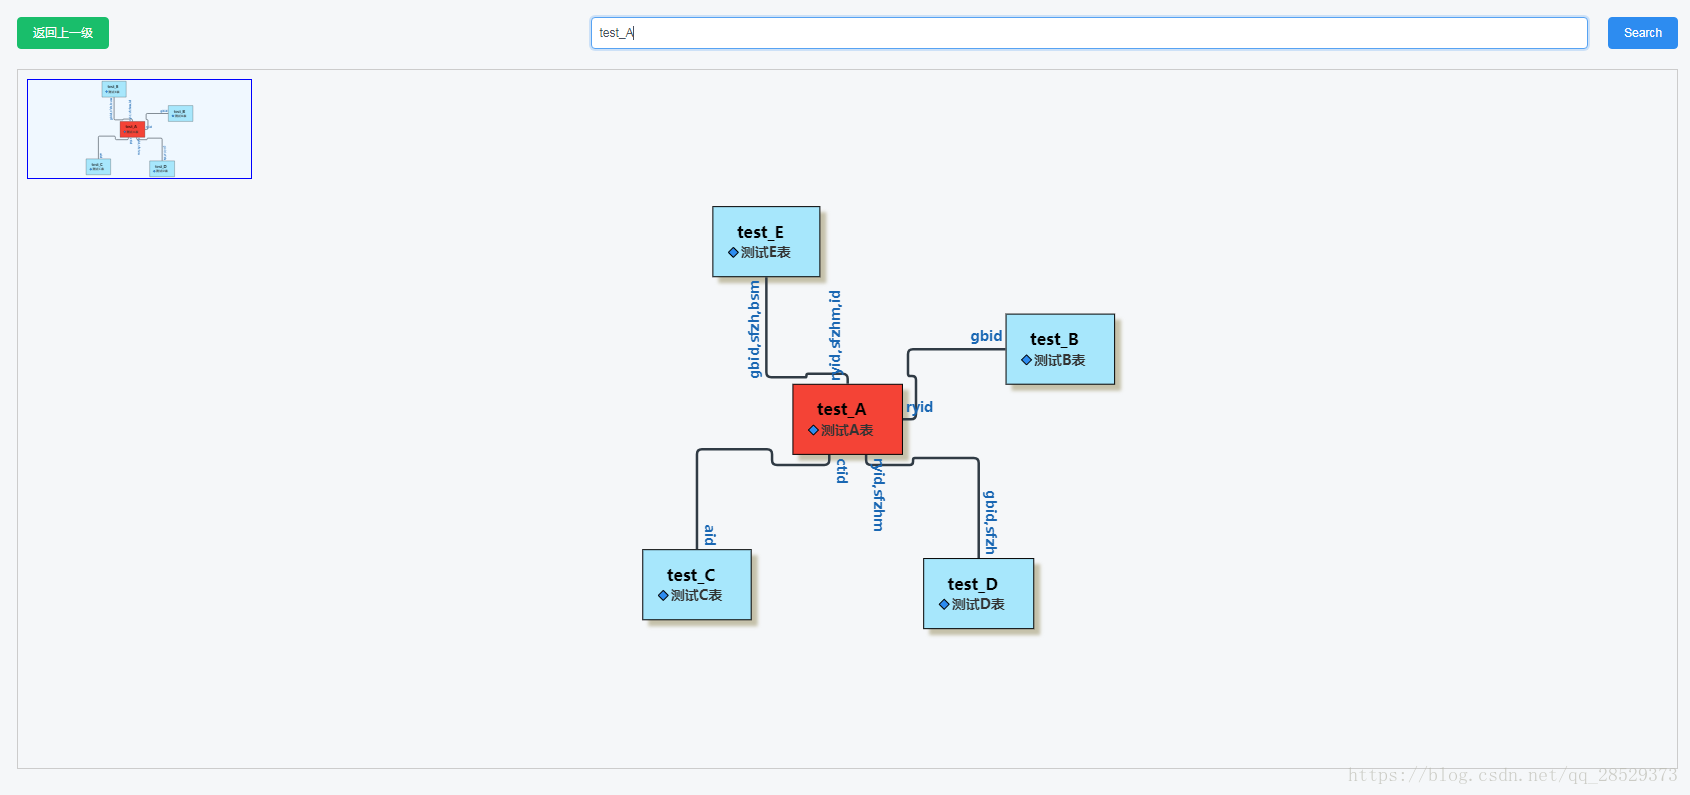
жҗңзҙўжЎҶзҡ„дҪңз”ЁеҚіжҳҜжӣҙеҝ«зҡ„жүҫеҲ°зӣёеә”зҡ„ж•°жҚ®пјҢдёӢеӣҫд»Јз ҒжҳҜи®ҫзҪ®жҗңзҙўеҗҺжҳҫзӨәй«ҳдә®зҡ„ж•°жҚ®гҖӮ
ж•ҲжһңеӣҫеҰӮдёӢпјҡ
е…ідәҺеҰӮдҪ•еңЁvue дёӯдҪҝз”Ёgojsз»ҳеҲ¶E-Rеӣҫй—®йўҳзҡ„и§Јзӯ”е°ұеҲҶдә«еҲ°иҝҷйҮҢдәҶпјҢеёҢжңӣд»ҘдёҠеҶ…е®№еҸҜд»ҘеҜ№еӨ§е®¶жңүдёҖе®ҡзҡ„её®еҠ©пјҢеҰӮжһңдҪ иҝҳжңүеҫҲеӨҡз–‘жғ‘жІЎжңүи§ЈејҖпјҢеҸҜд»Ҙе…іжіЁдәҝйҖҹдә‘иЎҢдёҡиө„и®Ҝйў‘йҒ“дәҶи§ЈжӣҙеӨҡзӣёе…ізҹҘиҜҶгҖӮ
е…ҚиҙЈеЈ°жҳҺпјҡжң¬з«ҷеҸ‘еёғзҡ„еҶ…е®№пјҲеӣҫзүҮгҖҒи§Ҷйў‘е’Ңж–Үеӯ—пјүд»ҘеҺҹеҲӣгҖҒиҪ¬иҪҪе’ҢеҲҶдә«дёәдё»пјҢж–Үз« и§ӮзӮ№дёҚд»ЈиЎЁжң¬зҪ‘з«ҷз«ӢеңәпјҢеҰӮжһңж¶үеҸҠдҫөжқғиҜ·иҒ”зі»з«ҷй•ҝйӮ®з®ұпјҡis@yisu.comиҝӣиЎҢдёҫжҠҘпјҢ并жҸҗдҫӣзӣёе…іиҜҒжҚ®пјҢдёҖз»ҸжҹҘе®һпјҢе°Ҷз«ӢеҲ»еҲ йҷӨж¶үе«ҢдҫөжқғеҶ…е®№гҖӮ

дәҝйҖҹдә‘е…¬дј—еҸ·

жүӢжңәзҪ‘з«ҷдәҢз»ҙз Ғ


