这篇文章主要介绍怎么使用python实现画AR模型时序图,文中介绍的非常详细,具有一定的参考价值,感兴趣的小伙伴们一定要看完!
背景:
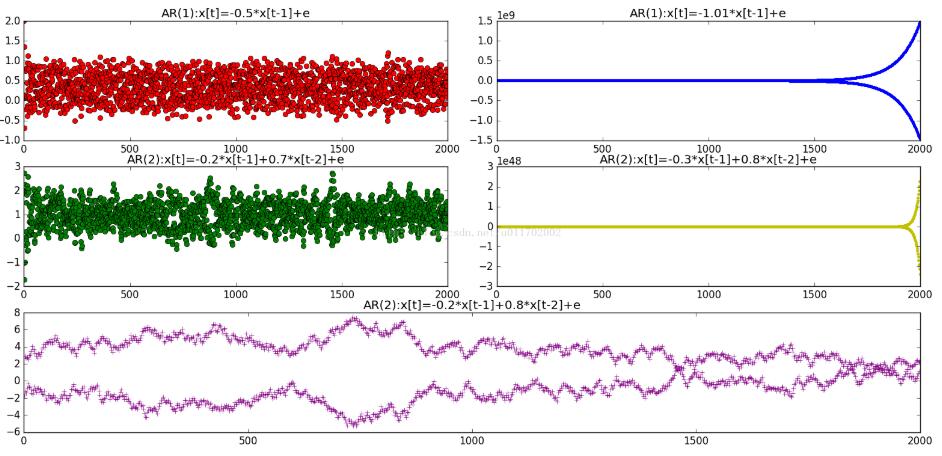
用python画AR模型的时序图。
结果:
代码:
import numpy as np import matplotlib.pyplot as plt """ AR(1)的时序图:x[t]=a*x[t-1]+e """ num = 2000 e = np.random.rand(num) x = np.empty(num) """ 平稳AR(1) """ a = -0.5 x[0] = 2 for i in range(1,num): x[i] = a*x[i-1]+e[i] plt.subplot(321,title = "AR({0}):x[t]={1}*x[t-1]+e".format(1,a)) plt.plot(x,"or") """ 非平稳AR(1) """ a = -1.01 x[0] = 2 for i in range(1,num): x[i] = a*x[i-1]+e[i] plt.subplot(322,title = "AR({0}):x[t]={1}*x[t-1]+e".format(1,a)) plt.plot(x,".b") """ 平稳AR(2) """ a = -0.2 b = 0.7 x[0] = 2 for i in range(2,num): x[i] = a*x[i-1]+b*x[i-2]+e[i] plt.subplot(323,title = "AR({0}):x[t]={1}*x[t-1]+{2}*x[t-2]+e".format(2,a,b)) plt.plot(x,"og") """ 非平稳AR(2) """ a = -0.3 b = 0.8 x[0] = 2 for i in range(2,num): x[i] = a*x[i-1]+b*x[i-2]+e[i] plt.subplot(324,title = "AR({0}):x[t]={1}*x[t-1]+{2}*x[t-2]+e".format(2,a,b)) plt.plot(x,".y") """ 非平稳AR(2) """ a = -0.2 b = 0.8 x[0] = 2 for i in range(2,num): x[i] = a*x[i-1]+b*x[i-2]+e[i] plt.subplot(313,title = "AR({0}):x[t]={1}*x[t-1]+{2}*x[t-2]+e".format(2,a,b)) plt.plot(x,"+",color="purple") plt.show()以上是“怎么使用python实现画AR模型时序图”这篇文章的所有内容,感谢各位的阅读!希望分享的内容对大家有帮助,更多相关知识,欢迎关注亿速云行业资讯频道!
免责声明:本站发布的内容(图片、视频和文字)以原创、转载和分享为主,文章观点不代表本网站立场,如果涉及侵权请联系站长邮箱:is@yisu.com进行举报,并提供相关证据,一经查实,将立刻删除涉嫌侵权内容。


