
 Data Structure
 Networking
 RDBMS
RDBMS Operating System
 Java
Java MS Excel
 iOS
iOS HTML
HTML CSS
CSS Android
 Python
 C Programming
 C++
C++ C#
C# MongoDB
 MySQL
MySQL Javascript
 PHP
PHP
- Selected Reading
- UPSC IAS Exams Notes
- Developer's Best Practices
- Questions and Answers
- Effective Resume Writing
- HR Interview Questions
- Computer Glossary
- Who is Who
What is hysteresis thresholding? How can it be achieved using scikit-learn in Python?
Hysteresis refers to the lagging effect of a result. With respect to threshold, hysteresis refers to the areas that are above a specific low threshold value or above high threshold values. It refers to areas that are highly-confident in nature.
With the help of hysteresis, the noise outside the edges of the object in the image can be ignored.
Let us see how hysteresis threshold can be achieved using scikit-learn library:
Example
import matplotlib.pyplot as plt from skimage import data, filters fig, ax = plt.subplots(nrows=2, ncols=2) orig_img = data.coins() edges = filters.sobel(orig_img) low = 0.1 high = 0.4 lowt = (edges > low).astype(int) hight = (edges > high).astype(int) hyst = filters.apply_hysteresis_threshold(edges, low, high) ax[0, 0].imshow(orig_img, cmap='gray') ax[0, 0].set_title('Original image') ax[0, 1].imshow(edges, cmap='magma') ax[0, 1].set_title('Sobel edges') ax[1, 0].imshow(lowt, cmap='magma') ax[1, 0].set_title('Low threshold') ax[1, 1].imshow(hight + hyst, cmap='magma') ax[1, 1].set_title('Hysteresis threshold') for a in ax.ravel(): a.axis('off') plt.tight_layout() plt.show() Output
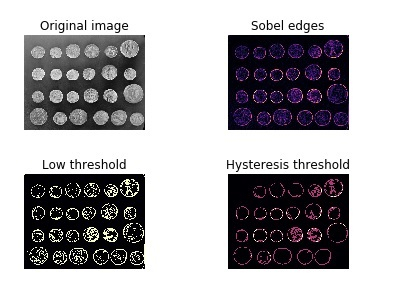
Explanation
The required libraries are imported.
The subplot function is used to set the plot area before plotting the images on the console.
The ‘coin’ data already present in scikit-learn package is used as input.
The ‘sobel’ filter is used to get the ‘sobel’ image of the input, wherein the edges are emphasized in the resultant image
The function ‘apply_hysteresis_threshold’ is used to get values above and below a certain threshold.
This data is displayed on the console using the function ‘imshow’.

2K+ Views
