
 Data Structure
 Networking
 RDBMS
RDBMS Operating System
 Java
Java MS Excel
 iOS
iOS HTML
HTML CSS
CSS Android
 Python
 C Programming
 C++
C++ C#
C# MongoDB
 MySQL
MySQL Javascript
 PHP
PHP
- Selected Reading
- UPSC IAS Exams Notes
- Developer's Best Practices
- Questions and Answers
- Effective Resume Writing
- HR Interview Questions
- Computer Glossary
- Who is Who
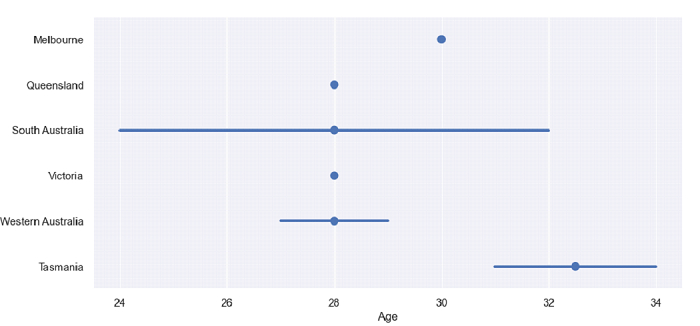
Python Pandas - Draw a set of Horizontal point plots but do not draw lines to connect points with Seaborn
Point Plot in Seaborn is used to show point estimates and confidence intervals using scatter plot glyphs. The seaborn.pointplot() is used for this. To avoid drawing lines to connect points, simply set the “join” parameter of the pointplot() method to False.
Let’s say the following is our dataset in the form of a CSV file − Cricketers.csv
At first, import the required libraries −
import seaborn as sb import pandas as pd import matplotlib.pyplot as plt
Load data from a CSV file into a Pandas DataFrame −
dataFrame = pd.read_csv("C:\Users\amit_\Desktop\Cricketers.csv") Now, plot the Horizontal point plot. The “join” parameter is set as False to avoid drawing lines to connect points −
sb.pointplot(x = 'Age', y = 'Academy', data = dataFrame, join=False)
Example
Following is the complete code −
import seaborn as sb import pandas as pd import matplotlib.pyplot as plt # Load data from a CSV file into a Pandas DataFrame dataFrame = pd.read_csv("C:\Users\amit_\Desktop\Cricketers.csv") sb.set_theme(style="darkgrid") # Horizontal point plot # join is set as false to avoid drawing lines to connect points # join is set using the join parameter sb.pointplot(x = 'Age', y = 'Academy', data = dataFrame, join=False) # display plt.show() Output
This will produce the following output −

Updated on: 2021-09-30T12:32:49+05:30
532 Views

Advertisements