
 Data Structure
 Networking
 RDBMS
RDBMS Operating System
 Java
Java MS Excel
 iOS
iOS HTML
HTML CSS
CSS Android
 Python
 C Programming
 C++
C++ C#
C# MongoDB
 MySQL
MySQL Javascript
 PHP
PHP
- Selected Reading
- UPSC IAS Exams Notes
- Developer's Best Practices
- Questions and Answers
- Effective Resume Writing
- HR Interview Questions
- Computer Glossary
- Who is Who
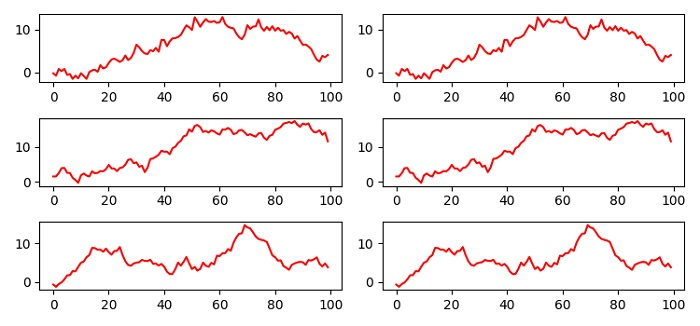
Populating Matplotlib subplots through a loop and a function
To populate matplotlib subplots through a loop and a function, we can take the following steps −
Set the figure size and adjust the padding between and around the subplots.
Create a figure and a set of subplots with number of rows = 3 and number of columns = 2.
Make a function to iterate the columns of each row and plot the x data points using plot() method at each column index.
Iterate rows (Step 2) and create random x data points and call iterate_columns() function (Step 3).
To display the figure, use show() method.
Example
import numpy as np import matplotlib.pyplot as plt plt.rcParams["figure.figsize"] = [7.50, 3.50] plt.rcParams["figure.autolayout"] = True fig, axes = plt.subplots(3, 2) """ Iterate column's axes""" def iterate_columns(cols, x): for col in cols: col.plot(x, color='red') """ Iterate row's axes""" for row in axes: x = np.random.normal(0, 1, 100).cumsum() iterate_columns(row, x) plt.show()
Output

Updated on: 2021-06-03T13:27:19+05:30
6K+ Views

Advertisements