
 Data Structure
 Networking
 RDBMS
RDBMS Operating System
 Java
Java MS Excel
 iOS
iOS HTML
HTML CSS
CSS Android
 Python
 C Programming
 C++
C++ C#
C# MongoDB
 MySQL
MySQL Javascript
 PHP
PHP
- Selected Reading
- UPSC IAS Exams Notes
- Developer's Best Practices
- Questions and Answers
- Effective Resume Writing
- HR Interview Questions
- Computer Glossary
- Who is Who
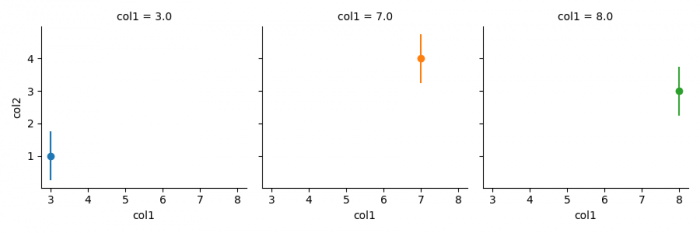
Plotting error bars from a dataframe using Seaborn FacetGrid (Matplotlib)
To plot error bars from a dataframe using Seaborn FacetGrid, we can use following steps −
- Get a two-dimensional, size-mutable, potentially heterogeneous tabular data.
- Multi-plot grid for plotting conditional relationships.
- Apply a plotting function to each facet's subset of the data.
- To display the figure, use show() method.
Example
import pandas as pd import seaborn as sns from matplotlib import pyplot as plt df = pd.DataFrame({'col1': [3.0, 7.0, 8.0], 'col2': [1.0, 4.0, 3.0]}) g = sns.FacetGrid(df, col="col1", hue="col1") g.map(plt.errorbar, "col1", "col2", yerr=0.75, fmt='o') plt.show() Output

Updated on: 2021-06-18T10:34:13+05:30
584 Views

Advertisements