
 Data Structure
 Networking
 RDBMS
RDBMS Operating System
 Java
Java MS Excel
 iOS
iOS HTML
HTML CSS
CSS Android
 Python
 C Programming
 C++
C++ C#
C# MongoDB
 MySQL
MySQL Javascript
 PHP
PHP
- Selected Reading
- UPSC IAS Exams Notes
- Developer's Best Practices
- Questions and Answers
- Effective Resume Writing
- HR Interview Questions
- Computer Glossary
- Who is Who
JavaFX LineChart example with category axis
Inline chart, the data values have represented a series of points connected by a line. In JavaFX, you can create a line chart by instantiating the javafx.scene.chart.LineChart class.
While instantiating this class you must pass the two objects of the Axis class representing the x and y-axis (as parameters of the constructor). Since the Axis class is abstract you need to pass objects of its concrete subclasses, NumberAxis (for numerical values) or, CategoryAxis (String values).
Example
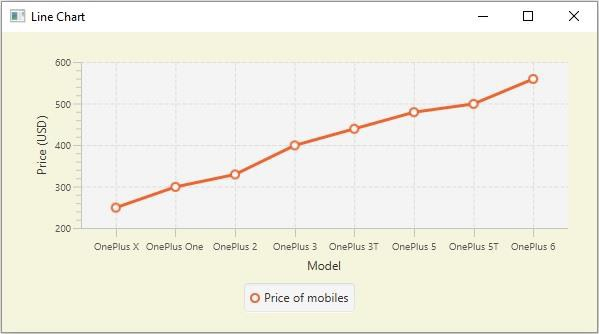
Following is an example demonstrating the usage of the category axis. Here, We are plotting the sales of various models of OnePlus mobile, we are using the Category (x) axis to plot the mobile models.
import javafx.application.Application; import javafx.geometry.Insets; import javafx.scene.Scene; import javafx.stage.Stage; import javafx.scene.chart.CategoryAxis; import javafx.scene.chart.LineChart; import javafx.scene.chart.NumberAxis; import javafx.scene.chart.XYChart; import javafx.scene.layout.StackPane; public class LineChart_Category extends Application { public void start(Stage stage) { //Defining the x an y axes CategoryAxis xAxis = new CategoryAxis(); NumberAxis yAxis = new NumberAxis(200, 600, 100); //Setting labels for the axes xAxis.setLabel("Model"); yAxis.setLabel("Price (USD)"); //Creating a line chart LineChart linechart = new LineChart(xAxis, yAxis); //Preparing the data points for the line XYChart.Series series = new XYChart.Series(); series.getData().add(new XYChart.Data("OnePlus X", 249)); series.getData().add(new XYChart.Data("OnePlus One", 299)); series.getData().add(new XYChart.Data("OnePlus 2", 329)); series.getData().add(new XYChart.Data("OnePlus 3", 399)); series.getData().add(new XYChart.Data("OnePlus 3T", 439)); series.getData().add(new XYChart.Data("OnePlus 5", 479)); series.getData().add(new XYChart.Data("OnePlus 5T", 499)); series.getData().add(new XYChart.Data("OnePlus 6", 559)); //Setting the name to the line (series) series.setName("Price of mobiles"); //Setting the data to Line chart linechart.getData().add(series); //Creating a stack pane to hold the chart StackPane pane = new StackPane(linechart); pane.setPadding(new Insets(15, 15, 15, 15)); pane.setStyle("-fx-background-color: BEIGE"); //Setting the Scene Scene scene = new Scene(pane, 595, 300); stage.setTitle("Line Chart"); stage.setScene(scene); stage.show(); } public static void main(String args[]){ launch(args); } } Output

Updated on: 2020-05-20T08:07:00+05:30
1K+ Views

Advertisements