
 Data Structure
 Networking
 RDBMS
RDBMS Operating System
 Java
Java MS Excel
 iOS
iOS HTML
HTML CSS
CSS Android
 Python
 C Programming
 C++
C++ C#
C# MongoDB
 MySQL
MySQL Javascript
 PHP
PHP
- Selected Reading
- UPSC IAS Exams Notes
- Developer's Best Practices
- Questions and Answers
- Effective Resume Writing
- HR Interview Questions
- Computer Glossary
- Who is Who
How to write your own LaTeX preamble in Matplotlib?
To write your own LaTeX preamble in Matplotlib, we can take the following steps −
- Set the figure size and adjust the padding between and around the subplots.
- Create x and y random data points using numpy.
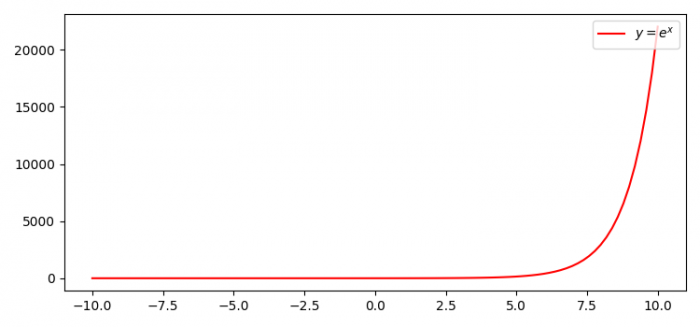
- Plot x and y data points using plot() method. Use LaTex formatting for the label.label="$y=e^{x}$"
- Place a legend on the figure using legend() method.
- To display the figure, use show() method.
Example
import numpy as np from matplotlib import pyplot as plt plt.rcParams["figure.figsize"] = [7.50, 3.50] plt.rcParams["figure.autolayout"] = True x = np.linspace(-10, 10, 100) y = np.exp(x) plt.plot(x, y, color='red', label="$y=e^{x}$") plt.legend(loc='upper right') plt.show() Output

Updated on: 2021-06-17T11:58:50+05:30
281 Views

Advertisements