
 Data Structure
 Networking
 RDBMS
RDBMS Operating System
 Java
Java MS Excel
 iOS
iOS HTML
HTML CSS
CSS Android
 Python
 C Programming
 C++
C++ C#
C# MongoDB
 MySQL
MySQL Javascript
 PHP
PHP
- Selected Reading
- UPSC IAS Exams Notes
- Developer's Best Practices
- Questions and Answers
- Effective Resume Writing
- HR Interview Questions
- Computer Glossary
- Who is Who
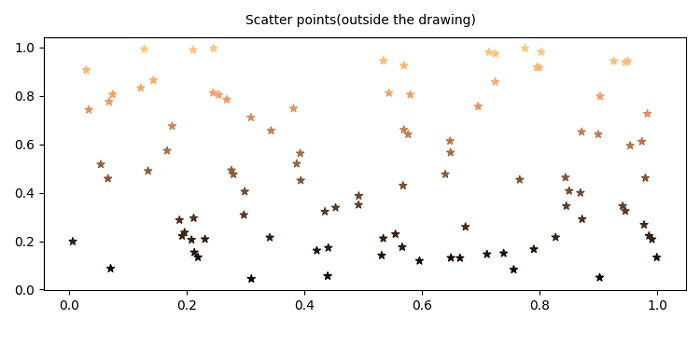
How to write annotation outside the drawing in data coords in Matplotlib?
We can use annotate() method to place annotation outside the drawing.
Steps
Set the figure size and adjust the padding between and around the subplots.
Create x and y data points using numpy.
Create a figure and a set of subplots using subplots() method.
Use scatter() method to plot x and y data points using star marker and copper color map.
To place annotation outside the drawing, use xy coordinates tuple accordingly.
To display the figure, use show() method.
Example
import numpy as np from matplotlib import pyplot as plt plt.rcParams["figure.figsize"] = [7.50, 3.50] plt.rcParams["figure.autolayout"] = True x = np.random.rand(100) y = np.random.rand(100) fig, ax = plt.subplots() ax.scatter(x, y, c=y, marker="*", cmap="copper") ax.annotate('Scatter points(outside the drawing)', xy=(0.30, 1.05), xycoords=ax.get_xaxis_transform()) plt.show() Output

Updated on: 2021-06-01T11:43:44+05:30
1K+ Views

Advertisements