
 Data Structure
 Networking
 RDBMS
RDBMS Operating System
 Java
Java MS Excel
 iOS
iOS HTML
HTML CSS
CSS Android
 Python
 C Programming
 C++
C++ C#
C# MongoDB
 MySQL
MySQL Javascript
 PHP
PHP
- Selected Reading
- UPSC IAS Exams Notes
- Developer's Best Practices
- Questions and Answers
- Effective Resume Writing
- HR Interview Questions
- Computer Glossary
- Who is Who
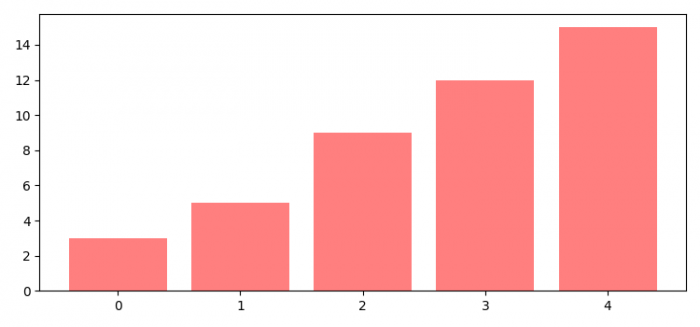
How to sort bars in a bar plot in ascending order (Matplotlib)?
To sort bars in a bar plot in ascending order, we can take the following steps −
Set the figure size and adjust the padding between and around the subplots.
Make a list of data for bar plots.
Create a bar plot using bar() method, with sorted data.
To display the figure, use show() method.
Example
from matplotlib import pyplot as plt plt.rcParams["figure.figsize"] = [7.50, 3.50] plt.rcParams["figure.autolayout"] = True data = [3, 5, 9, 15, 12] plt.bar(range(len(data)), sorted(data), color='red', alpha=0.5) plt.show()
Output

Updated on: 2021-08-10T06:58:34+05:30
15K+ Views

Advertisements