
 Data Structure
 Networking
 RDBMS
RDBMS Operating System
 Java
Java MS Excel
 iOS
iOS HTML
HTML CSS
CSS Android
 Python
 C Programming
 C++
C++ C#
C# MongoDB
 MySQL
MySQL Javascript
 PHP
PHP
- Selected Reading
- UPSC IAS Exams Notes
- Developer's Best Practices
- Questions and Answers
- Effective Resume Writing
- HR Interview Questions
- Computer Glossary
- Who is Who
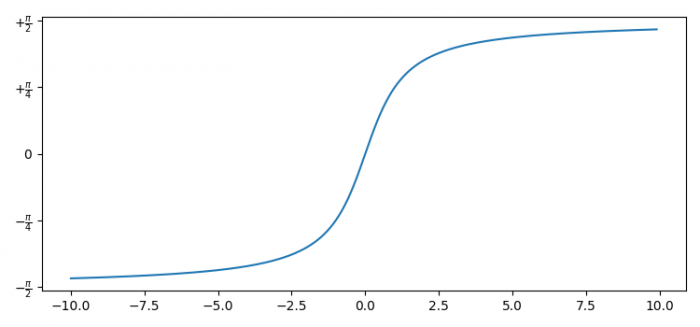
How to set the Y-axis in radians in a Python plot?
To set the Y-axis in radians in a Python plot, we can take the following steps −
- Set the figure size and adjust the padding between and around the subplots.
- Create x and y data point using numpy.
- Create a new figure or activate an existing figure using figure() method.
- Add an axes, ax, to the figure as part of a subplot arrangement.
- Get the list of Y-axis ticks and ticklabels.
- Set the ticks and ticklabels using set_yticks() and set_yticklabels() methods.
- To display the figure, use show() method.
Example
import matplotlib.pyplot as plt import numpy as np plt.rcParams["figure.figsize"] = [7.50, 3.50] plt.rcParams["figure.autolayout"] = True x = np.arange(-10.0, 10.0, 0.1) y = np.arctan(x) fig = plt.figure() ax = fig.add_subplot(111) ax.plot(x, y) unit = 0.25 y_tick = np.arange(-0.5, 0.5 + unit, unit) y_label = [r"$-\frac{\pi}{2}$", r"$-\frac{\pi}{4}$", r"$0$", r"$+\frac{\pi}{4}$", r"$+\frac{\pi}{2}$"] ax.set_yticks(y_tick * np.pi) ax.set_yticklabels(y_label, fontsize=10) plt.show() Output


Updated on: 2021-08-03T12:29:24+05:30
951 Views

Advertisements