
 Data Structure
 Networking
 RDBMS
RDBMS Operating System
 Java
Java MS Excel
 iOS
iOS HTML
HTML CSS
CSS Android
 Python
 C Programming
 C++
C++ C#
C# MongoDB
 MySQL
MySQL Javascript
 PHP
PHP
- Selected Reading
- UPSC IAS Exams Notes
- Developer's Best Practices
- Questions and Answers
- Effective Resume Writing
- HR Interview Questions
- Computer Glossary
- Who is Who
How to save an image with matplotlib.pyplot?
To save an image with matplotlib.pyplot.savefig(), we can take the following steps −
- Set the figure size and adjust the padding between and around the subplots.
- Create x and y data points using numpy.
- Plot x and y data points using plot() method.
- To save the figure, use savefig() method.
Example
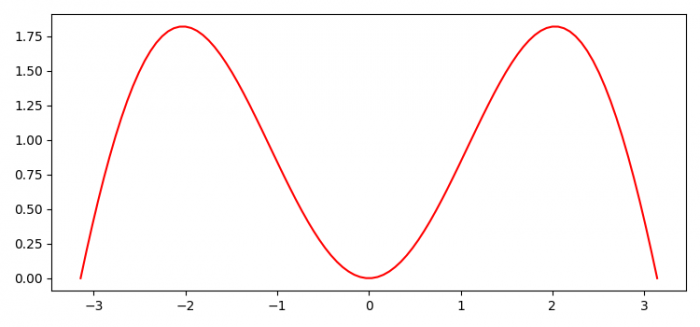
import numpy as np import matplotlib.pyplot as plt plt.rcParams["figure.figsize"] = [7.50, 3.50] plt.rcParams["figure.autolayout"] = True x = np.linspace(-np.pi, np.pi, 100) plt.plot(x, np.sin(x) * x, c='red') plt.savefig("myimage.png") Output
When we execute the code, it will save the following image as "myimage.png" in the Project directory.

Updated on: 2021-08-03T12:10:48+05:30
5K+ Views

Advertisements