
 Data Structure
 Networking
 RDBMS
RDBMS Operating System
 Java
Java MS Excel
 iOS
iOS HTML
HTML CSS
CSS Android
 Python
 C Programming
 C++
C++ C#
C# MongoDB
 MySQL
MySQL Javascript
 PHP
PHP
- Selected Reading
- UPSC IAS Exams Notes
- Developer's Best Practices
- Questions and Answers
- Effective Resume Writing
- HR Interview Questions
- Computer Glossary
- Who is Who
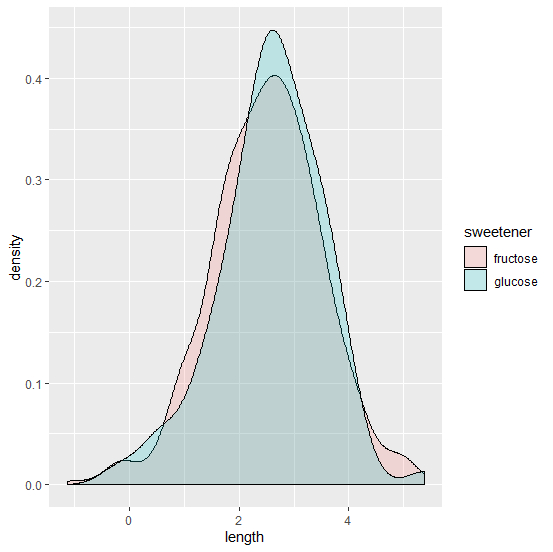
How to plot two histograms together in R?
Consider the below data frames −
> glucose <- data.frame(length = rnorm(100, 2.5)) > fructose <- data.frame(length = rnorm(500, 2.5))
We need to combine these two data frames but before that we have to make a new column in each of these data frames to create their identification
> glucose$sweetener <- 'glucose' > fructose$sweetener <- 'fructose' > sweeteners <- rbind(glucose, fructose)
Now let’s create the histograms
> library(ggplot2) > ggplot(sweeteners, aes(length, fill = sweetener)) + geom_density(alpha = 0.2)

Updated on: 2020-07-06T14:41:01+05:30
378 Views

Advertisements