
 Data Structure
 Networking
 RDBMS
RDBMS Operating System
 Java
Java MS Excel
 iOS
iOS HTML
HTML CSS
CSS Android
 Python
 C Programming
 C++
C++ C#
C# MongoDB
 MySQL
MySQL Javascript
 PHP
PHP
- Selected Reading
- UPSC IAS Exams Notes
- Developer's Best Practices
- Questions and Answers
- Effective Resume Writing
- HR Interview Questions
- Computer Glossary
- Who is Who
How to plot the lines first and points last in Matplotlib?
To plot the lines first and points last, we can take the following Steps −
Create xpoints, y1points and y2points using numpy, to draw lines.
Plot the curves using the plot() method with x, y1 and y2 points.
Draw the scatter points using the scatter method.
To display the figure, use the show() method.
Example
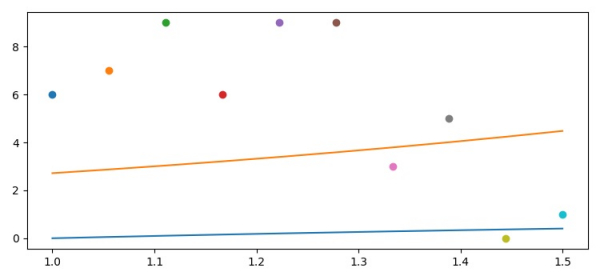
import numpy as np from matplotlib import pyplot as plt plt.rcParams["figure.figsize"] = [7.50, 3.50] plt.rcParams["figure.autolayout"] = True xpoints = np.linspace(1, 1.5, 10) y1points = np.log(xpoints) y2points = np.exp(xpoints) plt.plot(xpoints, y1points) plt.plot(xpoints, y2points) for i in xpoints: plt.scatter(i, np.random.randint(10)) plt.show()
Output

Updated on: 2021-04-10T11:40:58+05:30
570 Views

Advertisements