
 Data Structure
 Networking
 RDBMS
RDBMS Operating System
 Java
Java MS Excel
 iOS
iOS HTML
HTML CSS
CSS Android
 Python
 C Programming
 C++
C++ C#
C# MongoDB
 MySQL
MySQL Javascript
 PHP
PHP
- Selected Reading
- UPSC IAS Exams Notes
- Developer's Best Practices
- Questions and Answers
- Effective Resume Writing
- HR Interview Questions
- Computer Glossary
- Who is Who
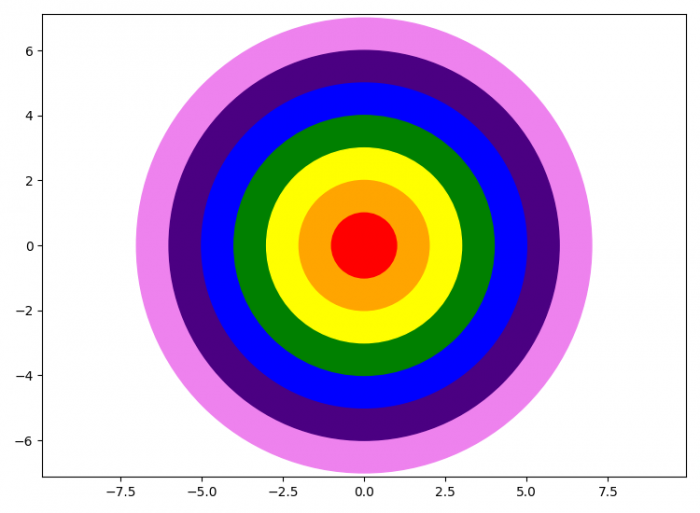
How to plot a rainbow cricle in matplotlib?
To plot a rainbow circles in Matplotlib, we can take the following steps −
- Set the figure size and adjust the padding between and around the subplots.
- Create a figure and a set of subplots.
- Set the X and Y axes scale.
- Make a list of rainbow colors.
- Create a true circle at (0, 0).
- Add a circle instance 'c' to the figure.
- To display the figure, use show() method.
Example
import matplotlib.pyplot as plt plt.rcParams["figure.figsize"] = [7.50, 5.50] plt.rcParams["figure.autolayout"] = True fig, ax = plt.subplots() plt.axis("equal") ax.set(xlim=(-10, 10), ylim=(-10, 10)) for i in range(0, 7): rainbow = ['violet', 'indigo', 'blue', 'green', 'yellow', 'orange', 'red'] c = plt.Circle((0, 0), 7-i, fill=True, color=rainbow[i]) ax.add_artist(c) plt.show() Output
It will produce the following output


Updated on: 2021-09-22T06:07:00+05:30
894 Views

Advertisements