
 Data Structure
 Networking
 RDBMS
RDBMS Operating System
 Java
Java MS Excel
 iOS
iOS HTML
HTML CSS
CSS Android
 Python
 C Programming
 C++
C++ C#
C# MongoDB
 MySQL
MySQL Javascript
 PHP
PHP
- Selected Reading
- UPSC IAS Exams Notes
- Developer's Best Practices
- Questions and Answers
- Effective Resume Writing
- HR Interview Questions
- Computer Glossary
- Who is Who
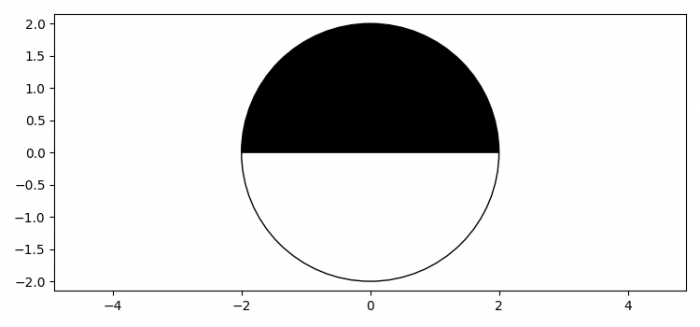
How to plot a half-black and half-white circle using Matplotlib?
To plot a half-black and half-white circle using Matplotlib, we can take the following steps −
- Set the figure size and adjust the padding between and around the subplots.
- Create a figure and a set of subplots.
- Initialize theta1 and theta2 to draw edges from theta1 to theta2 and vice-versa.
- Add the wedge instance on the current axes.
- Set equal scaling by changing axis limits.
- Set x and y scale.
- To display the figure, use show() method.
Example
import matplotlib.pyplot as plt from matplotlib.patches import Wedge plt.rcParams["figure.figsize"] = [7.50, 3.50] plt.rcParams["figure.autolayout"] = True fig, ax = plt.subplots() theta1, theta2 = 0, 0 + 180 radius = 2 center = (0, 0) w1 = Wedge(center, radius, theta1, theta2, fc='black', edgecolor='black') w2 = Wedge(center, radius, theta2, theta1, fc='white', edgecolor='black') for wedge in [w1, w2]: ax.add_artist(wedge) ax.axis('equal') ax.set_xlim(-5, 5) ax.set_ylim(-5, 5) plt.show() Output

Updated on: 2021-06-16T12:19:01+05:30
2K+ Views

Advertisements