
 Data Structure
 Networking
 RDBMS
RDBMS Operating System
 Java
Java MS Excel
 iOS
iOS HTML
HTML CSS
CSS Android
 Python
 C Programming
 C++
C++ C#
C# MongoDB
 MySQL
MySQL Javascript
 PHP
PHP
- Selected Reading
- UPSC IAS Exams Notes
- Developer's Best Practices
- Questions and Answers
- Effective Resume Writing
- HR Interview Questions
- Computer Glossary
- Who is Who
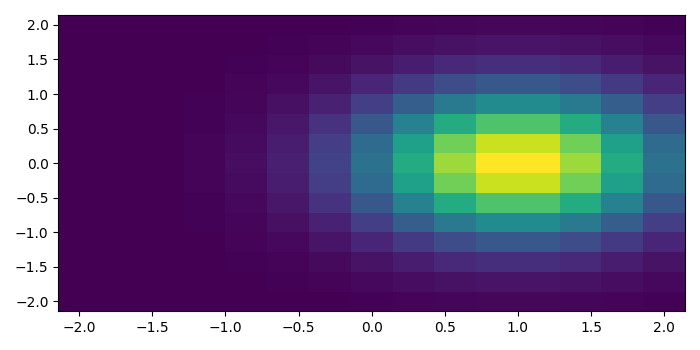
How to plot a density map in Python Matplotlib?
To plot a density map in Python, we can take the following steps −
Create side, x, y, and z using numpy. Numpy linspace helps to create data between two points based on a third number.
Return coordinate matrices from coordinate vectors using side data.
Create exponential data using x and y (Step 2).
Create a pseudocolor plot with a non-regular rectangular grid using pcolormesh() method.
To display the figure, use show() method.
Example
from matplotlib import pyplot as plt, cm, colors import numpy as np plt.rcParams["figure.figsize"] = [7.00, 3.50] plt.rcParams["figure.autolayout"] = True side = np.linspace(-2, 2, 15) X, Y = np.meshgrid(side, side) Z = np.exp(-((X - 1) ** 2 + Y ** 2)) plt.pcolormesh(X, Y, Z, shading='auto') plt.show()
Output

Updated on: 2021-09-29T12:38:42+05:30
4K+ Views

Advertisements