
 Data Structure
 Networking
 RDBMS
RDBMS Operating System
 Java
Java MS Excel
 iOS
iOS HTML
HTML CSS
CSS Android
 Python
 C Programming
 C++
C++ C#
C# MongoDB
 MySQL
MySQL Javascript
 PHP
PHP
- Selected Reading
- UPSC IAS Exams Notes
- Developer's Best Practices
- Questions and Answers
- Effective Resume Writing
- HR Interview Questions
- Computer Glossary
- Who is Who
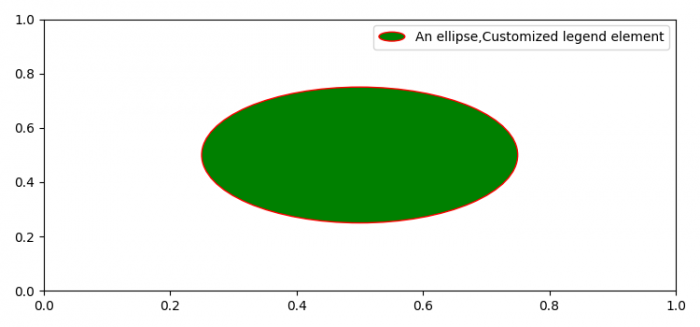
How to place customized legend symbols on a plot using Matplotlib?
To plot customized legend symbols on a plot, we can take the following steps −
- Set the figure size and adjust the padding between and around the subplots.
- Inherit HandlerPatch class, override create artists method, add an elliptical patch to the plot, and return the patch handler.
- Plot a circle on the plot using Circle class.
- Add a circle patch on the current axis.
- Use legend() method to place the legend on the plot.
- To display the figure, use show() method.
Example
import matplotlib.pyplot as plt, matplotlib.patches as mpatches from matplotlib.legend_handler import HandlerPatch plt.rcParams["figure.figsize"] = [7.50, 3.50] plt.rcParams["figure.autolayout"] = True class HandlerEllipse(HandlerPatch): def create_artists(self, legend, orig_handle, xdescent, ydescent, width, height, fontsize, trans): center = 0.5 * width - 0.5 * xdescent, 0.5 * height - 0.5 * ydescent p = mpatches.Ellipse(xy=center, width=width + xdescent, height=height + ydescent) self.update_prop(p, orig_handle, legend) p.set_transform(trans) return [p] c = mpatches.Circle((0.5, 0.5), 0.25, facecolor="green", edgecolor="red", linewidth=1) plt.gca().add_patch(c) plt.legend([c], ["An ellipse,Customized legend element"], handler_map={mpatches.Circle: HandlerEllipse()}) plt.show() Output

Updated on: 2021-06-05T08:19:20+05:30
989 Views

Advertisements