
 Data Structure
 Networking
 RDBMS
RDBMS Operating System
 Java
Java MS Excel
 iOS
iOS HTML
HTML CSS
CSS Android
 Python
 C Programming
 C++
C++ C#
C# MongoDB
 MySQL
MySQL Javascript
 PHP
PHP
- Selected Reading
- UPSC IAS Exams Notes
- Developer's Best Practices
- Questions and Answers
- Effective Resume Writing
- HR Interview Questions
- Computer Glossary
- Who is Who
How to pause a pylab figure until a key is pressed or mouse is clicked? (Matplotlib)
To pause a pylab figure until a key is pressed of mouse is clicked, we can use"button_press_event" key event.
Steps
- Set the figure size and adjust the padding between and around the subplots.
- Set the "TkAgg" background.
- Turn the interactive mode ON.
- Create a new figure or activate an existing figure.
- Make a variable, pause=False.
- Whenever "button_press_event", pause the figure.
- Bind the function to the event.
- Create data, x and y data points using numpy.
- Iterate a True loop to change the plot line and color.
- To display the figure, use show() method.
Example
import matplotlib from matplotlib import pyplot as plt import numpy as np plt.rcParams["figure.figsize"] = [7.50, 3.50] plt.rcParams["figure.autolayout"] = True matplotlib.use("TkAgg") plt.ion() fig = plt.figure() pause = False def onclick(event): global pause pause = not pause fig.canvas.mpl_connect('button_press_event', onclick) data = np.linspace(-10, 10, 100) x = np.sin(data) y = np.cos(data) flag = 1 while True: if not pause: if flag == 1: fig.clear() plt.plot(data, y, color='red') flag = 0 else: fig.clear() plt.plot(data, x, color='yellow') flag = 1 fig.canvas.get_tk_widget().update() Output
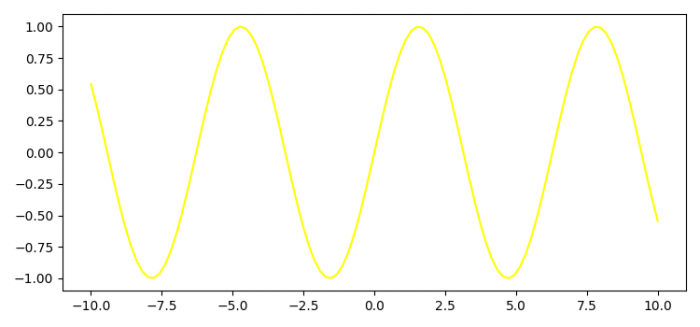
You will see sine and cosine waves alternatively in yellow and red until you click a mouse button. The figure will pause after clicking either of the mouse buttons.

Updated on: 2021-06-18T10:38:03+05:30
885 Views

Advertisements