
 Data Structure
 Networking
 RDBMS
RDBMS Operating System
 Java
Java MS Excel
 iOS
iOS HTML
HTML CSS
CSS Android
 Python
 C Programming
 C++
C++ C#
C# MongoDB
 MySQL
MySQL Javascript
 PHP
PHP
- Selected Reading
- UPSC IAS Exams Notes
- Developer's Best Practices
- Questions and Answers
- Effective Resume Writing
- HR Interview Questions
- Computer Glossary
- Who is Who
How to pass RGB color values to Python's Matplotlib eventplot?
To pass RGB color values to Python's Matplotlib eventplot, we can take the following steps
Steps
- Set the figure size and adjust the padding between and around the subplots.
- Create a 1D array, pos, to define the positions of one sequence of events
- Make a list of color tuple r, g, b.
- Plot identical parallel lines at the given positions.
- To display the figure, use show() method.
Example
import numpy as np import matplotlib.pyplot as plt plt.rcParams["figure.figsize"] = [7.50, 3.50] plt.rcParams["figure.autolayout"] = True pos = 10 * np.random.random(100) colors = [(0.75, 0.50, 0.25)] plt.eventplot(pos, orientation='horizontal', linelengths=0.75, color=colors) plt.show()
Output
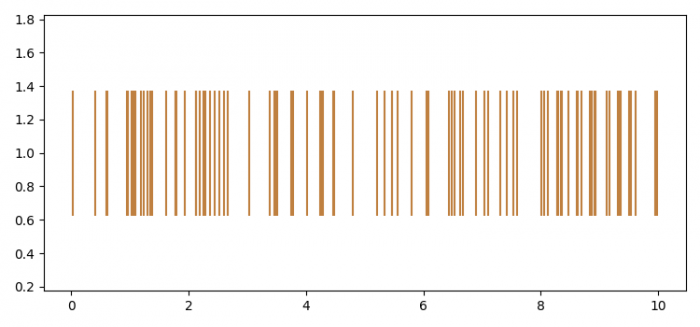
You can change the R, G, B values inside colors to get different colors in the plot.

Updated on: 2021-06-16T12:07:56+05:30
2K+ Views

Advertisements