
 Data Structure
 Networking
 RDBMS
RDBMS Operating System
 Java
Java MS Excel
 iOS
iOS HTML
HTML CSS
CSS Android
 Python
 C Programming
 C++
C++ C#
C# MongoDB
 MySQL
MySQL Javascript
 PHP
PHP
- Selected Reading
- UPSC IAS Exams Notes
- Developer's Best Practices
- Questions and Answers
- Effective Resume Writing
- HR Interview Questions
- Computer Glossary
- Who is Who
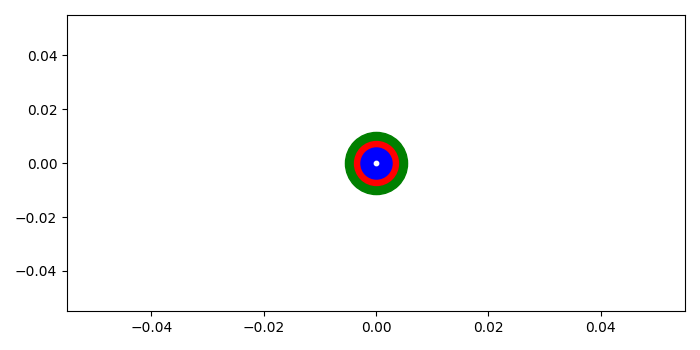
How to make a multicolored point in Matplotlib?
To make a multicolored point in matplotlib, we can take the following steps−
- Initialize two varuables, x and y.
- Use scatter method with x and y data points with green color having marker size 2000.
- Use scatter method with x and y data points with red color having marker size 1000.
- Use scatter method with x and y data points with blue color having marker size 500.
- Use scatter method with x and y data points with white color having marker size 10.
- To display the figure, use show() method.
Example
from matplotlib import pyplot as plt plt.rcParams["figure.figsize"] = [7.00, 3.50] plt.rcParams["figure.autolayout"] = True x, y = 0, 0 plt.scatter(x, y, c='green', s=2000) plt.scatter(x, y, c='red', s=1000) plt.scatter(x, y, c='blue', s=500) plt.scatter(x, y, c='white', s=10) plt.show()
Output

Updated on: 2021-05-06T13:34:14+05:30
302 Views

Advertisements