
 Data Structure
 Networking
 RDBMS
RDBMS Operating System
 Java
Java MS Excel
 iOS
iOS HTML
HTML CSS
CSS Android
 Python
 C Programming
 C++
C++ C#
C# MongoDB
 MySQL
MySQL Javascript
 PHP
PHP
- Selected Reading
- UPSC IAS Exams Notes
- Developer's Best Practices
- Questions and Answers
- Effective Resume Writing
- HR Interview Questions
- Computer Glossary
- Who is Who
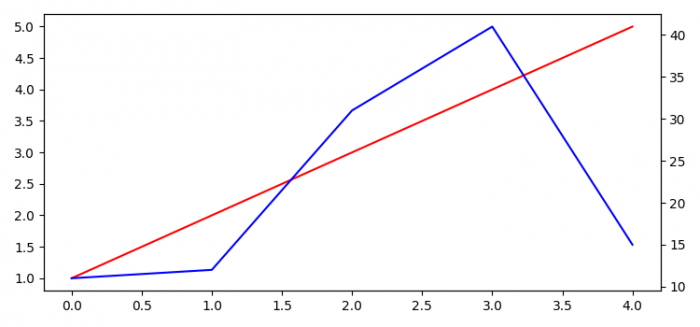
How to get multiple overlapping plots with independent scaling in Matplotlib?
To get multiple overlapping plots with independent scaling in Matplotlib, we can take the following steps −
Set the figure size and adjust the padding between and around the subplots.
Create a figure and a set of subplots.
Plot a list of data points using plot() method on a seperate Y-axis and overlapping X-axis.
Create a twin Axes sharing the X-axis.
Plot a list of data points using plot() method on a seperate Y-axis and overlapping X-axis.
To display the figure, use show() method.
Example
import matplotlib.pyplot as plt plt.rcParams["figure.figsize"] = [7.50, 3.50] plt.rcParams["figure.autolayout"] = True fig, ax1 = plt.subplots() ax1.plot([1, 2, 3, 4, 5], color='red') ax2 = ax1.twinx() ax2.plot([11, 12, 31, 41, 15], color='blue') plt.show()
Output

Updated on: 2021-09-23T09:37:50+05:30
3K+ Views

Advertisements