
 Data Structure
 Networking
 RDBMS
RDBMS Operating System
 Java
Java MS Excel
 iOS
iOS HTML
HTML CSS
CSS Android
 Python
 C Programming
 C++
C++ C#
C# MongoDB
 MySQL
MySQL Javascript
 PHP
PHP
- Selected Reading
- UPSC IAS Exams Notes
- Developer's Best Practices
- Questions and Answers
- Effective Resume Writing
- HR Interview Questions
- Computer Glossary
- Who is Who
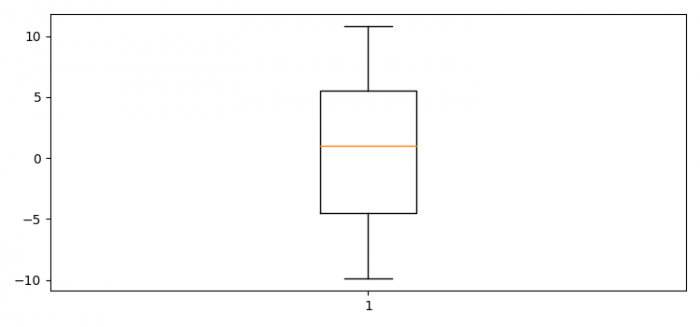
How to deal with NaN values while plotting a boxplot using Python Matplotlib?
To deal with NaN value while plotting a boxplot using Python, we can take the following steps −
Steps
Set the figure size and adjust the padding between and around the subplots.
Initialize a variable N for data samples and for range.
Next create the random spread, center's data, flier high and low, get the concatenated data, and the filtered data.
Create a box plot using boxplot() method.
To display the figure, use show() method.
Example
import matplotlib.pyplot as plt import numpy as np # Set the figure size plt.rcParams["figure.figsize"] = [7.50, 3.50] plt.rcParams["figure.autolayout"] = True # Data samples N = 10 # Random spread spread = np.random.rand(N) # Center's data center = np.ones(N) # Flier high and low fh = np.random.rand(N)+N fl = np.random.rand(N)-N # Concatenated data data = np.concatenate((spread, center, fh, fl), 0) data[5] = np.NaN # Filtered data filtered_data = data[~np.isnan(data)] # Plot the boxplot plt.boxplot(filtered_data) plt.show()
Output
It will produce the following output −

Updated on: 2022-02-01T11:35:26+05:30
3K+ Views

Advertisements