
 Data Structure
 Networking
 RDBMS
RDBMS Operating System
 Java
Java MS Excel
 iOS
iOS HTML
HTML CSS
CSS Android
 Python
 C Programming
 C++
C++ C#
C# MongoDB
 MySQL
MySQL Javascript
 PHP
PHP
- Selected Reading
- UPSC IAS Exams Notes
- Developer's Best Practices
- Questions and Answers
- Effective Resume Writing
- HR Interview Questions
- Computer Glossary
- Who is Who
How to create dotted vertical lines in a plot using ggplot2 in R?
In any plot, the vertical lines are generally used to show the thresholds for something, for example, range of the variable under consideration. The package ggplot2 provides geom_vline function to create vertical lines on a plot and we have linetype argument of this function which can be used to draw dotted vertical lines.
Example
Consider the below data frame −
set.seed(9) x <-rnorm(100,0.5) df <-data.frame(x)
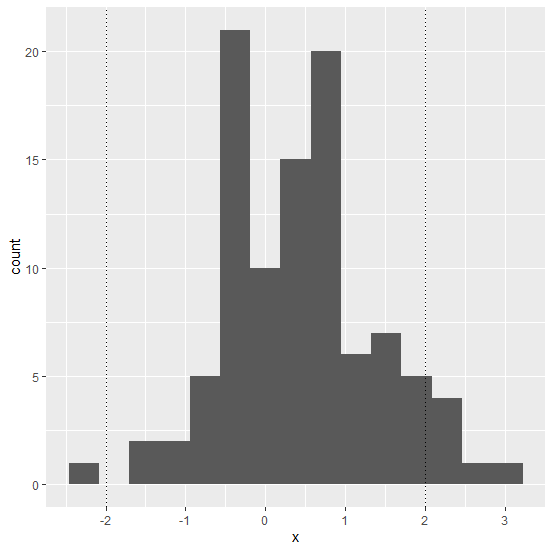
Creating histogram of x with dotted vertical lines −
Example
library(ggplot2) ggplot(df,aes(x))+geom_histogram(bins=15)+geom_vline(xintercept=c(-2,2),linetype="dotted")
Output
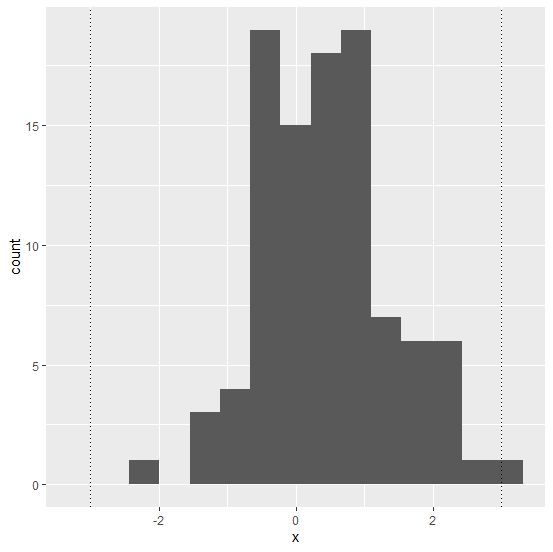
Example
ggplot(df,aes(x))+geom_histogram(bins=15)+geom_vline(xintercept=c(-3,3),linetype="dotted")
Output

Updated on: 2020-08-24T12:17:29+05:30
766 Views

Advertisements