
 Data Structure
 Networking
 RDBMS
RDBMS Operating System
 Java
Java MS Excel
 iOS
iOS HTML
HTML CSS
CSS Android
 Python
 C Programming
 C++
C++ C#
C# MongoDB
 MySQL
MySQL Javascript
 PHP
PHP
- Selected Reading
- UPSC IAS Exams Notes
- Developer's Best Practices
- Questions and Answers
- Effective Resume Writing
- HR Interview Questions
- Computer Glossary
- Who is Who
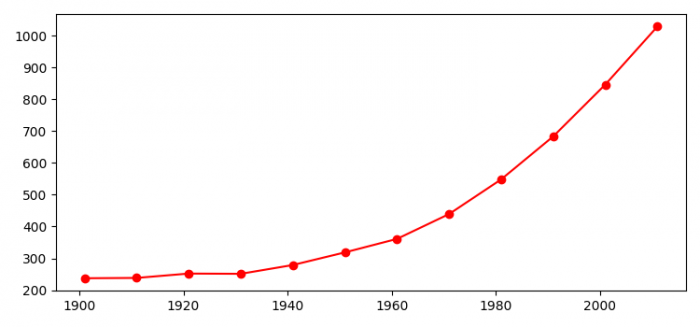
How to create a line chart using Matplotlib?
To create a line chart using matplotlib, we can take the following steps −
- Set the figure size and adjust the padding between and around the subplots.
- Make lists of years and population growth.
- Plot years and population on the line using plot() method.
- To display the figure, use show() method.
Example
from matplotlib import pyplot as plt plt.rcParams["figure.figsize"] = [7.50, 3.50] plt.rcParams["figure.autolayout"] = True years = [1901, 1911, 1921, 1931, 1941, 1951, 1961, 1971, 1981, 1991, 2001, 2011] population = [237.4, 238.4, 252.09, 251.31, 278.98, 318.66, 361.09, 439.23, 548.16, 683.33, 846.42, 1028.74] plt.plot(years, population, color='red', marker='o') plt.show()
Output


Updated on: 2021-08-04T12:46:01+05:30
935 Views

Advertisements