
 Data Structure
 Networking
 RDBMS
RDBMS Operating System
 Java
Java MS Excel
 iOS
iOS HTML
HTML CSS
CSS Android
 Python
 C Programming
 C++
C++ C#
C# MongoDB
 MySQL
MySQL Javascript
 PHP
PHP
- Selected Reading
- UPSC IAS Exams Notes
- Developer's Best Practices
- Questions and Answers
- Effective Resume Writing
- HR Interview Questions
- Computer Glossary
- Who is Who
How to create a horizontal line in a histogram in base R?
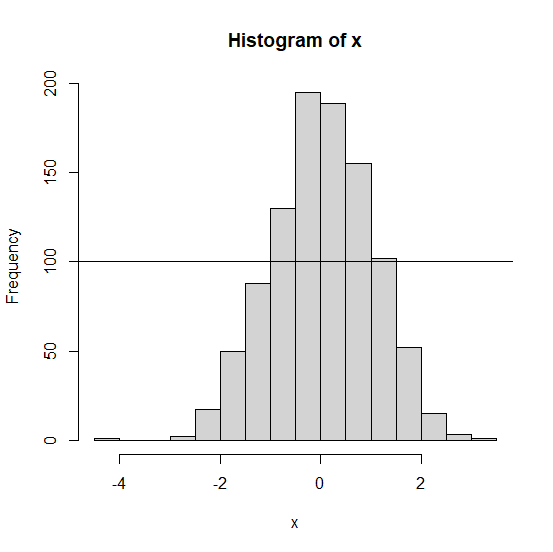
A horizontal line in a histogram is not much useful but we might want to create it in some situations such as where we want to display a specific value on the Y-axis that helps us to differentiate in the density of frequencies above or below a certain value. To create a horizontal line in a histogram, we simply need to use abline function as shown in the below example
Example
> x<-rnorm(1000) > hist(x) > abline(h=100)
Output
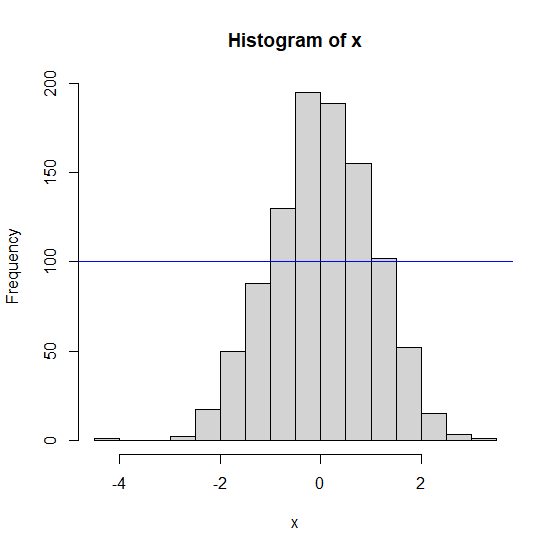
Example
> abline(h=100,col="blue")
Output
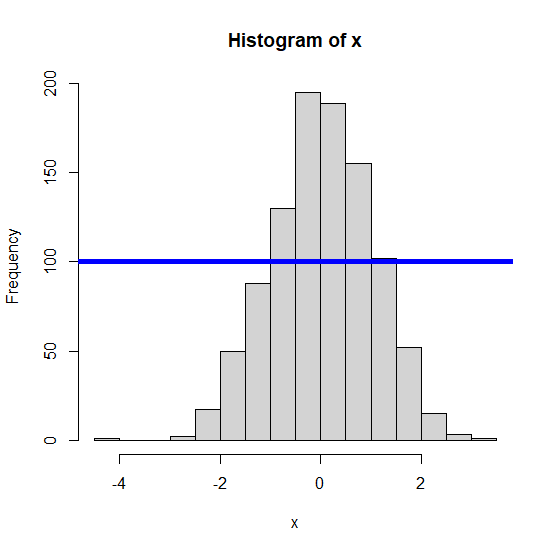
Example
> abline(h=100,col="blue",lwd=5)
Output

Updated on: 2020-11-21T05:02:39+05:30
1K+ Views

Advertisements