
 Data Structure
 Networking
 RDBMS
RDBMS Operating System
 Java
Java MS Excel
 iOS
iOS HTML
HTML CSS
CSS Android
 Python
 C Programming
 C++
C++ C#
C# MongoDB
 MySQL
MySQL Javascript
 PHP
PHP
- Selected Reading
- UPSC IAS Exams Notes
- Developer's Best Practices
- Questions and Answers
- Effective Resume Writing
- HR Interview Questions
- Computer Glossary
- Who is Who
How to create a dotchart using ggplot2 without gridlines in R?
To create a dotchart using ggplot2 in R, we can use geom_dotplot function but the default gridlines will be in the output. If we want to remove the gridlines from the plot then theme function can be added in the rest of the command as theme(panel.grid=element_blank()).
Example
Consider the below data frame −
set.seed(214) x<−rpois(20,10) df<−data.frame(x) df
Output
x 1 8 2 10 3 13 4 16 5 10 6 11 7 12 8 11 9 3 10 8 11 10 12 12 13 10 14 6 15 8 16 6 17 19 18 10 19 8 20 14
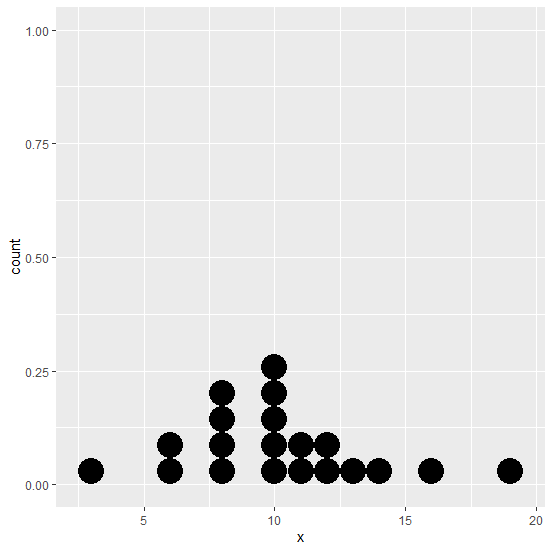
Loading ggplot2 package and creating the dotchart −
library(ggplot2) ggplot(df,aes(x))+geom_dotplot(binwidth=1)
Output
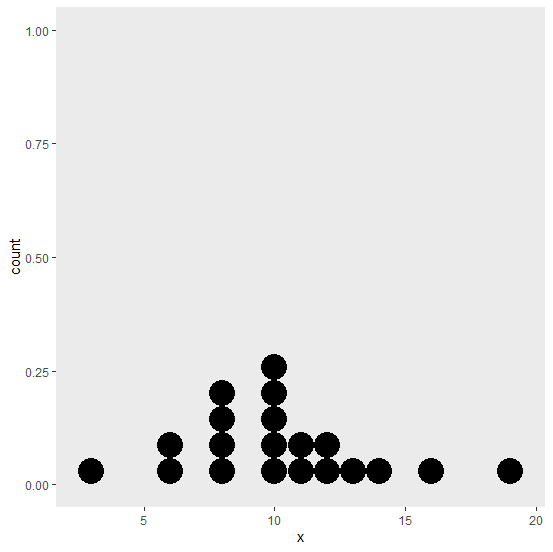
Creating the dotchart without gridlines −
Example
ggplot(df,aes(x))+geom_dotplot(binwidth=1)+theme(panel.grid=element_blank())
Output

Updated on: 2021-02-05T10:39:53+05:30
288 Views

Advertisements