
 Data Structure
 Networking
 RDBMS
RDBMS Operating System
 Java
Java MS Excel
 iOS
iOS HTML
HTML CSS
CSS Android
 Python
 C Programming
 C++
C++ C#
C# MongoDB
 MySQL
MySQL Javascript
 PHP
PHP
- Selected Reading
- UPSC IAS Exams Notes
- Developer's Best Practices
- Questions and Answers
- Effective Resume Writing
- HR Interview Questions
- Computer Glossary
- Who is Who
How to conduct ANOVA two-factor with replication in Excel?
A diversity of statistical methods is available in MS Excel to generate the descriptive summary of data. Two-factor ANOVA is a paramount technique utilized by research scholars and data analysts to verify whether the relevant output is to be generated or not after performing a few tests. It would be possible to evaluate the means of more than one set of values using an analysis of variance. The major variations of ANOVA are unidirectional ANOVA and two-way ANOVA. The F-test is the statistical significance test for ANOVA.
To perform ANOVA two-factor with Replication in Excel
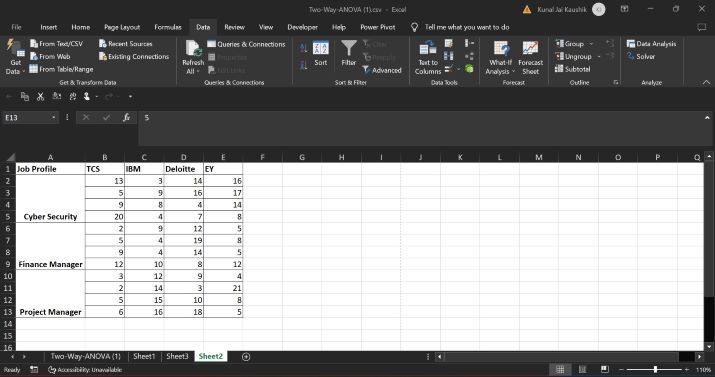
Step 1 Assume the sample dataset to perform two-factor ANOVA. Make sure that the number of rows is the same for all Job profiles, the number of rows for the Cyber Security, Finance Manager, and Project Manager profile should all be 4 in the given dataset.
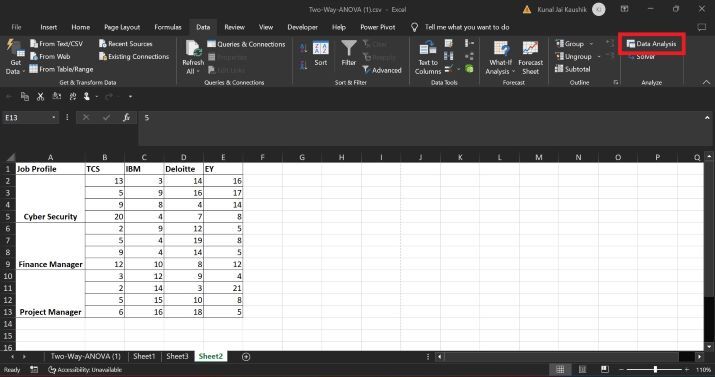
Step 2 Click the Data Analysis option after choosing the Data tab as highlighted in the below image
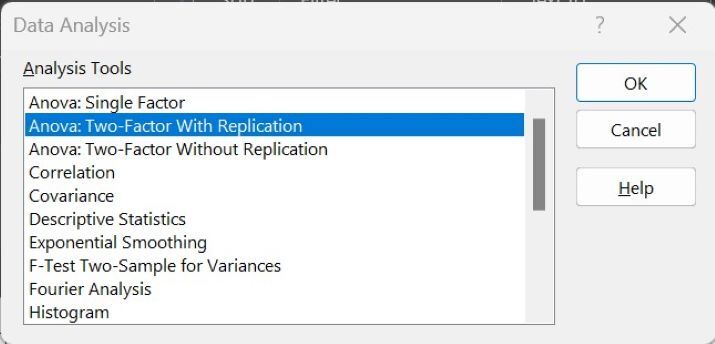
Step 3 Another dialog box named Data Analysis will appear. Choose the option Anova: Two-Factor With Replication from the drop-down list and then click on the OK button.
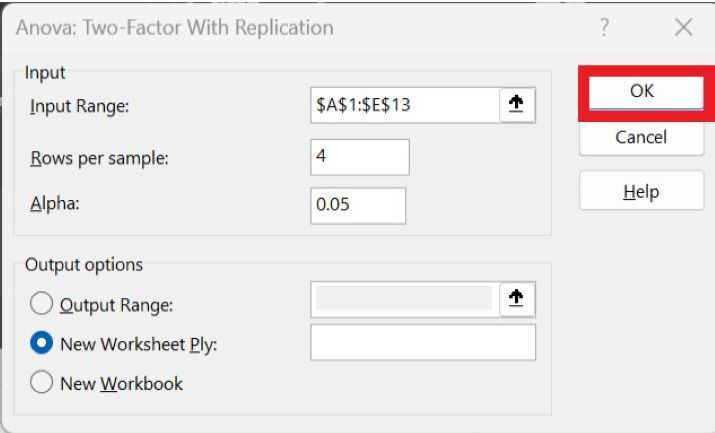
Step 4 Select the entire range of cells in the front of the Input Range option and write 4 in the next textbox representing Rows per sample. Users must ensure that the row per sample is the same for all the specified samples in the database. Choose the New Worksheet Ply: option to display the output. Users may choose any of the Output options.
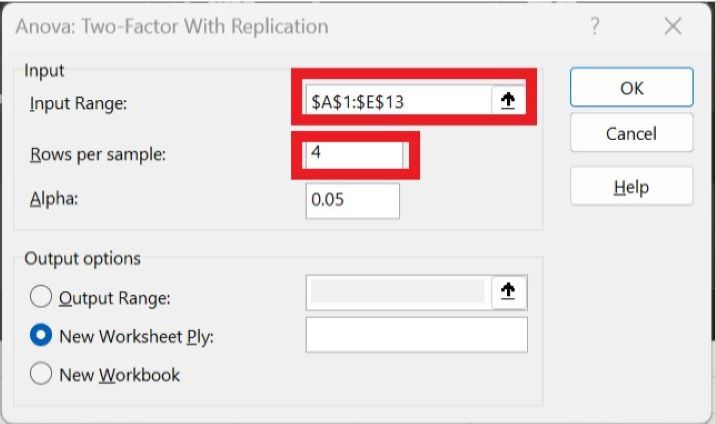
Step 5 Click on the OK button.
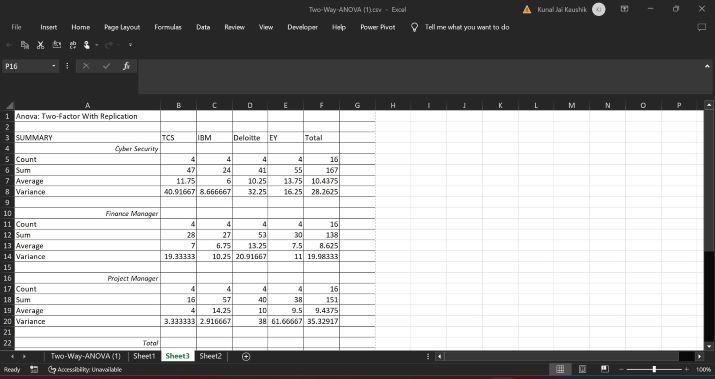
Step 6 The ANOVA table is displayed in another worksheet and depicts the summary of all the companies. It also gives a descriptive summary of individual job profiles like Cyber Security, Finance Manager, and Project Manager separately.
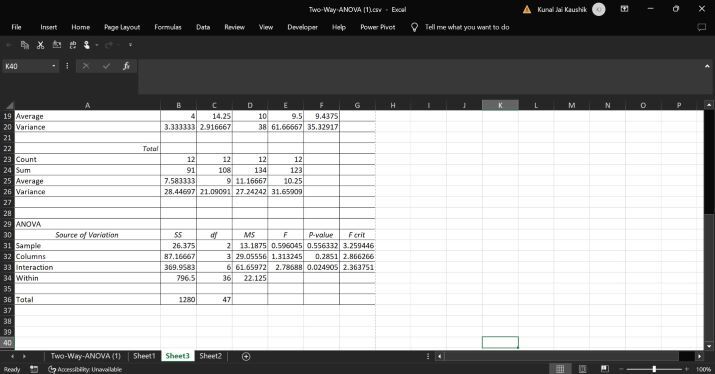
The ANOVA Table is displayed in the last section of the output as shown in the below image.
Conclusion
In this article, two factors that are Job profiles and companies that are independent and not correlated with each other are defined in the sample table to compute the two-factor ANOVA. The easier example is demonstrated so that users may acquire deep knowledge and delve into more statistical techniques like One-way ANOVA, Two-way ANOVA, etc. to improve their Excel skills.

595 Views
