
 Data Structure
 Networking
 RDBMS
RDBMS Operating System
 Java
Java MS Excel
 iOS
iOS HTML
HTML CSS
CSS Android
 Python
 C Programming
 C++
C++ C#
C# MongoDB
 MySQL
MySQL Javascript
 PHP
PHP
- Selected Reading
- UPSC IAS Exams Notes
- Developer's Best Practices
- Questions and Answers
- Effective Resume Writing
- HR Interview Questions
- Computer Glossary
- Who is Who
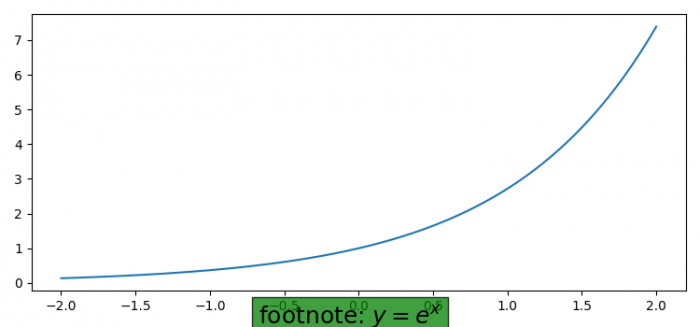
How to add footnote under the X-axis using Matplotlib?
To add footnote under the X-axis using matplotlib, we can use figtext() and text() method.
Steps
- Set the figure size and adjust the padding between and around the subplots.
- Create x and y data points using numpy.
- Plot x and y data points using numpy.
- To place the footnote, use figtext() method with x, y position and box properties.
- To display the figure, use show() method.
Example
import numpy as np import matplotlib.pyplot as plt plt.rcParams["figure.figsize"] = [7.50, 3.50] plt.rcParams["figure.autolayout"] = True x = np.linspace(-2, 2, 100) y = np.exp(x) plt.plot(x, y) plt.figtext(0.5, 0.01, "footnote: $y=e^{x}$", ha="center", fontsize=18, bbox={"facecolor": "green", "alpha": 0.75, "pad": 5}) plt.show() Output

Updated on: 2021-06-02T08:21:06+05:30
3K+ Views

Advertisements