
 Data Structure
 Networking
 RDBMS
RDBMS Operating System
 Java
Java MS Excel
 iOS
iOS HTML
HTML CSS
CSS Android
 Python
 C Programming
 C++
C++ C#
C# MongoDB
 MySQL
MySQL Javascript
 PHP
PHP
- Selected Reading
- UPSC IAS Exams Notes
- Developer's Best Practices
- Questions and Answers
- Effective Resume Writing
- HR Interview Questions
- Computer Glossary
- Who is Who
How do I put a circle with annotation in matplotlib?
To put a circle with annotation in matplotlib, we can take the following steps −
- Set the figure size and adjust the padding between and around the subplots.
- Create data points using numpy.
- Get the point coordinate to put circle with annotation.
- Get the current axis.
- Plot the data and data points using plot() method.
- Set X and Y axes scale.
- To put a circled marker, use the plot() method with marker='o' and some properties.
- Annotate that circle (Step 7) with arrow style.
- To display the figure, use show() method.
Example
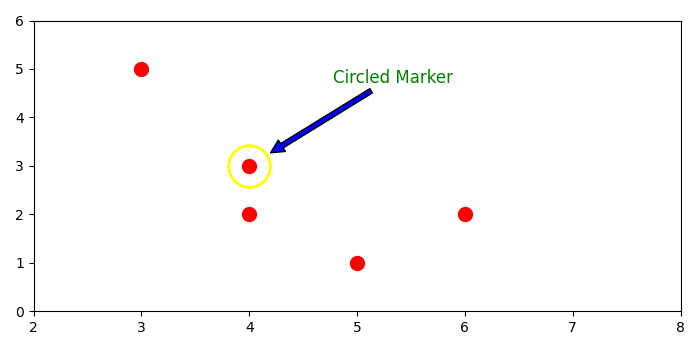
import matplotlib.pyplot as plt import numpy as np plt.rcParams["figure.figsize"] = [7.00, 3.50] plt.rcParams["figure.autolayout"] = True data = np.array([[5, 3, 4, 4, 6], [1, 5, 3, 2, 2]]) point = data[:, 2] ax = plt.gca() ax.plot(data[0], data[1], 'o', ms=10, color='red') ax.set_xlim([2, 8]) ax.set_ylim([0, 6]) radius = 15 ax.plot(point[0], point[1], 'o', ms=radius * 2, mec='yellow', mfc='none', mew=2) ax.annotate('Circled Marker', xy=point, xytext=(60, 60), textcoords='offset points', color='green', size='large', arrowprops=dict( arrowstyle='simple,tail_width=0.3,head_width=0.8,head_length=0.8', facecolor='b', shrinkB=radius * 1.2) ) plt.show() Output
It will produce the following output


Updated on: 2021-09-19T07:28:03+05:30
3K+ Views

Advertisements