
 Data Structure
 Networking
 RDBMS
RDBMS Operating System
 Java
Java MS Excel
 iOS
iOS HTML
HTML CSS
CSS Android
 Python
 C Programming
 C++
C++ C#
C# MongoDB
 MySQL
MySQL Javascript
 PHP
PHP
- Selected Reading
- UPSC IAS Exams Notes
- Developer's Best Practices
- Questions and Answers
- Effective Resume Writing
- HR Interview Questions
- Computer Glossary
- Who is Who
How can I cycle through line styles in Matplotlib?
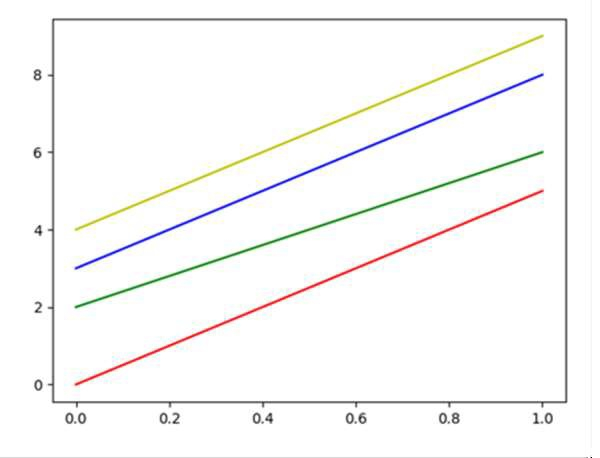
To plot multiple lines in a diagram, we can use the cycler that could help to set a new color from the given list of colors. (Here, ‘r’ => ‘red’, ‘g’ => ‘green’, ‘y’ => ‘yellow’, ‘b’ => ‘blue’).
Steps
Use a cycler to set the color for the group of lines. The color list consists of ‘r’ for red, ‘g’ for green, ‘b’ for blue, and ‘y’ for yellow.
The cycler class helps to create a new Cycler object from a single positional argument, a pair of positional arguments, or the combination of keyword arguments.
Plot the number of lines with different colors.
Use plt.show() to show the figure.
Example
import matplotlib.pyplot as plt from cycler import cycler plt.rc('axes', prop_cycle=(cycler('color', ['r', 'g', 'b', 'y']))) plt.plot([0, 5]) plt.plot([2, 6]) plt.plot([3, 8]) plt.plot([4, 9]) plt.show() Output

Updated on: 2021-03-17T08:27:19+05:30
430 Views

Advertisements