
 Data Structure
 Networking
 RDBMS
RDBMS Operating System
 Java
Java MS Excel
 iOS
iOS HTML
HTML CSS
CSS Android
 Python
 C Programming
 C++
C++ C#
C# MongoDB
 MySQL
MySQL Javascript
 PHP
PHP
- Selected Reading
- UPSC IAS Exams Notes
- Developer's Best Practices
- Questions and Answers
- Effective Resume Writing
- HR Interview Questions
- Computer Glossary
- Who is Who
How to use GoJS HTML5 Canvas Library for drawing diagrams and graphs?
GoJS is a JavaScript library, which you can use to implement interactive diagrams. This page will show you the essentials of using GoJS. If you want to add diagrams and graphs, then use this library, which is Open Source.
GoJS has a model-view architecture, in which Models holds arrays of JavaScript objects, which describe nodes and links. To visualize this data using actual Node and Link objects, the Diagrams act as views.
Constructing a Diagram with GoJS creates an HTML5 Canvas element to be placed inside the given DIV element.
How to draw a diagram
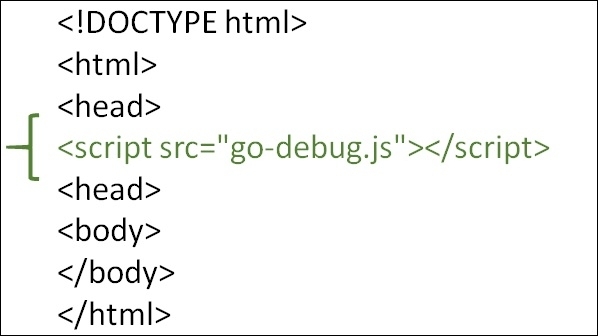
Start working with GoJS, you need to declare the library in the HTML document. With that, you need to load the library too. Load the GoJS library go.js.
To add, link to the GoJS library, which you can get from CDNJS.
Here’s how you can add it with CDNJS −
<script src="https://cdnjs.cloudflare.com/ajax/libs/gojs/1.7.20/go-debug.js"></script>
Note: Load go-debug.js when developing for run-time error checking. When deploying, go for “go.js”.

524 Views
