How to Plot an Array in Python Using Matplotlib?5 Mar 2025 | 3 min read Introduction:Graphs are used to visualise data when plotting arrays in Python using Matplotlib, which facilitates the comprehension of relationships and trends. You can produce understandable and instructive visual representations of your data by following a few easy procedures, like configuring plot parameters, defining arrays, and importing the required libraries. In Python, we may plot an array by following these steps:
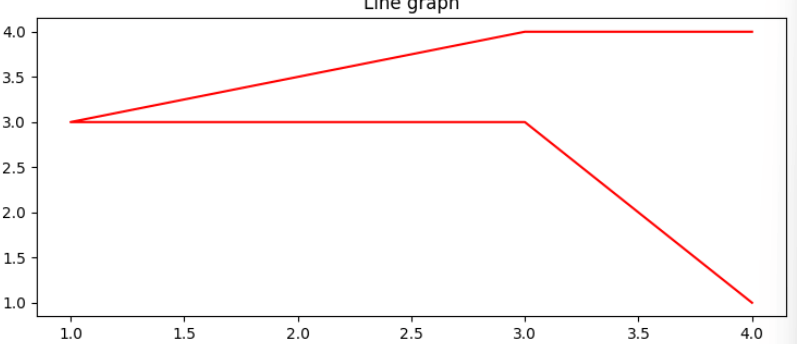
Example 1: Output:  Explanation: This Python software generates a line graph by using Matplotlib and NumPy. It first imports the required libraries and then configures the plot's auto layout and figure size. Subsequently, it constructs an array x and arranges its components to form an additional array y. The script adds a title to the plot and plots x against y with a red line. Finally, plt.show() is used to display the graph. The relationship between the initial array, x, and its sorted version, y, is depicted in the following line graph. Example 2: Output:  Explanation: This Python software generates and displays a sine wave using matplotlib and numpy. It calculates the sine values of each of the 100 values that are generated, which span from 0 to 10. The sine wave is shown on a plot by round markers and a blue dashed line. For easier reading, the plot has a title, axis labels, and a grid display. Lastly, the plot is rendered and displayed by calling plt.show(). Conclusion:You can efficiently plot arrays to visualise data trends by using Matplotlib and NumPy. Adding labels, colours, and sizes to the plot improves readability and sheds light on the connections between the data points. A simple method for using these libraries to create a line plot is shown in the code sample below. Next TopicHow-to-run-a-python-script-every-minute |
A 3D surface plot is a graphical representation of a three-dimensional surface in a Cartesian coordinate system. It is a way to visualize a mathematical function or a set of data points in three-dimensional space. In such plots, the x and y axes represent the...
6 min read
An Introduction to Sign Language Recognition and Python Due to the current nature of society where communication depends on passing information in the form of sounds this has been channeled as a priority. SLR stands for sign language recognition and is a growing area involving the use...
9 min read
Base URL A base URL is the main address of a website or resource. It serves as the foundation upon which other relative URLs are built. Think of it as the root from which all other URLs branch out. Typically, a base URL includes the domain name...
4 min read
The top ten incredible Python projects with source code are as follows: Random Story Generator Simple Email Slicer Acronyms Creator Body Mass Index(BMI) Calculator Dice Roll Simulator Basic Quiz Game Rock, Paper, and Scissors Game Chatbot Text to Speech Tic Tac Toe Project Random Story Generator It's one of the most fascinating source-code projects for beginners in...
17 min read
Graphs, those snarled-looking things with nodes and lines, are quite handy in math. They help solve tricky problems like computer networks or studying the shapes of chemicals. They're also the secret sauce behind sorting out city traffic, finding the best routes, and even deciphering the...
16 min read
In the following tutorial, we will learn the use of the trunc() method of the math module in Python with the help of some examples. So, let's get started. Truncate in Python Python has a large number of built-in modules. Among these modules, there is an intriguing one called...
3 min read
What are Decimal Numbers? Decimal Numbers are the number system that uses 10 digits, from 0 to 9. The base of the decimal number system is 10. It is also known as the base-10 number system. It is used to form digits with different combinations. Each...
4 min read
Understanding the Python's Art Library This library is famous for creating ASCII art in Python. It provides various functions for drawing shapes, text, and even animation. We must install an art library before trying out all the packages inside the library. Text-to-art conversion Converts text to ASCII art using...
4 min read
? When working with data in Python, it's often necessary to count the number of unique values inside a list. This can be useful for various data analysis tasks, such as finding the number of unique items in a shopping cart, counting unique words in a...
3 min read
The Kaprekar Constant is 6174. This number is unique because it is always obtained by following certain procedures for any four-digit number, with the caveat that none of the digits are the same (0000, 1111, ...). "asc" is the result of sorting four digits in ascending...
3 min read
We request you to subscribe our newsletter for upcoming updates.

We provides tutorials and interview questions of all technology like java tutorial, android, java frameworks
G-13, 2nd Floor, Sec-3, Noida, UP, 201301, India
