
In this JavaFX source code example, we will see how to create a Line Chart using JavaFX.
A line chart is a basic type of chart that displays information as a series of data points connected by straight line segments.
Java JavaFX
A line chart in JavaFX is created with the javafx.scene.chart.LineChart.
JavaFX LineChart Example
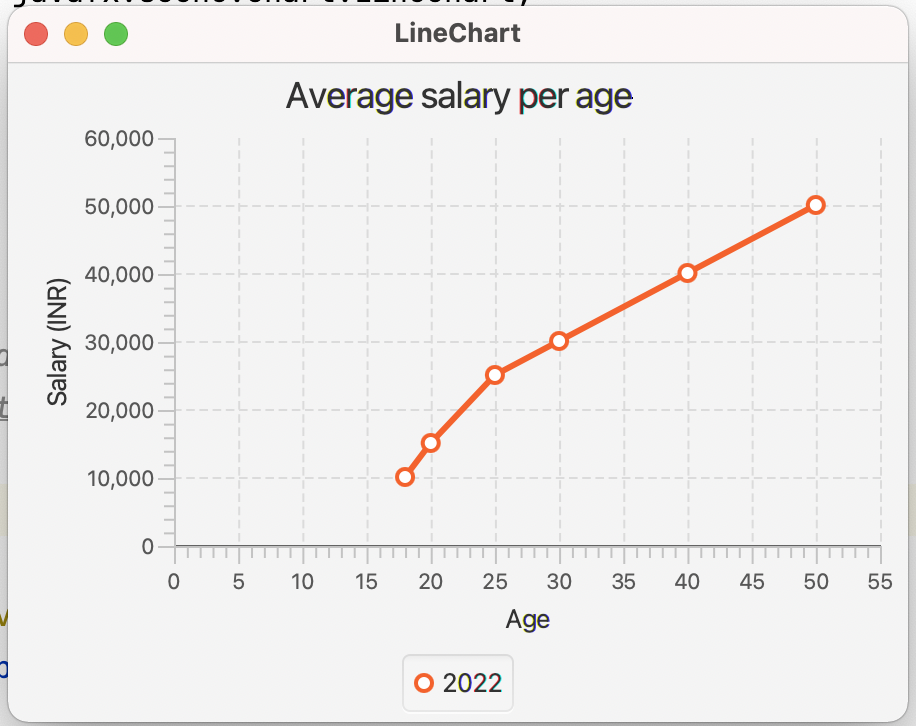
In the example, we have a line chart showing the average salary per age.package sample; import javafx.application.Application; import javafx.scene.Scene; import javafx.scene.chart.LineChart; import javafx.scene.chart.NumberAxis; import javafx.scene.chart.XYChart; import javafx.scene.layout.HBox; import javafx.stage.Stage; /** * JavaFX LineChart Example * @author https://www.sourcecodeexamples.net/ */ public class Main extends Application { @Override public void start(Stage stage) { initUI(stage); } private void initUI(Stage stage) { HBox root = new HBox(); Scene scene = new Scene(root, 450, 330); NumberAxis xAxis = new NumberAxis(); xAxis.setLabel("Age"); NumberAxis yAxis = new NumberAxis(); yAxis.setLabel("Salary (INR)"); LineChart lineChart = new LineChart<>(xAxis, yAxis); lineChart.setTitle("Average salary per age"); XYChart.Series data = new XYChart.Series<Number, Number>(); data.setName("2022"); data.getData().add(new XYChart.Data<>(18, 10000)); data.getData().add(new XYChart.Data<>(20, 15000)); data.getData().add(new XYChart.Data<>(25, 25000)); data.getData().add(new XYChart.Data<>(30, 30000)); data.getData().add(new XYChart.Data<>(40, 40000)); data.getData().add(new XYChart.Data<>(50, 50000)); lineChart.getData().add(data); root.getChildren().add(lineChart); stage.setTitle("LineChart"); stage.setScene(scene); stage.show(); } public static void main(String[] args) { launch(args); } }Output:
Comments
Post a Comment