Tuning SQL for Oracle Exadata: The Good, The Bad, and The Ugly Tuning SQL for Oracle Exadata: The Good, The Bad, and The Ugly
This document discusses tuning SQL on Oracle Exadata. It makes three main points: 1. Gathering and displaying execution plan data differs slightly on Exadata compared to non-Exadata databases. 2. The general approach to optimization is similar to non-Exadata, focusing on features like smart scans, storage indexes, and parallelism that provide the most benefit. 3. Rewriting SQL queries can have a dramatic impact on performance by enabling offloading and reducing disk I/O, with examples showing savings of over 98% in run time.
Overview of the presentation about tuning SQL for Exadata by Karen Morton.
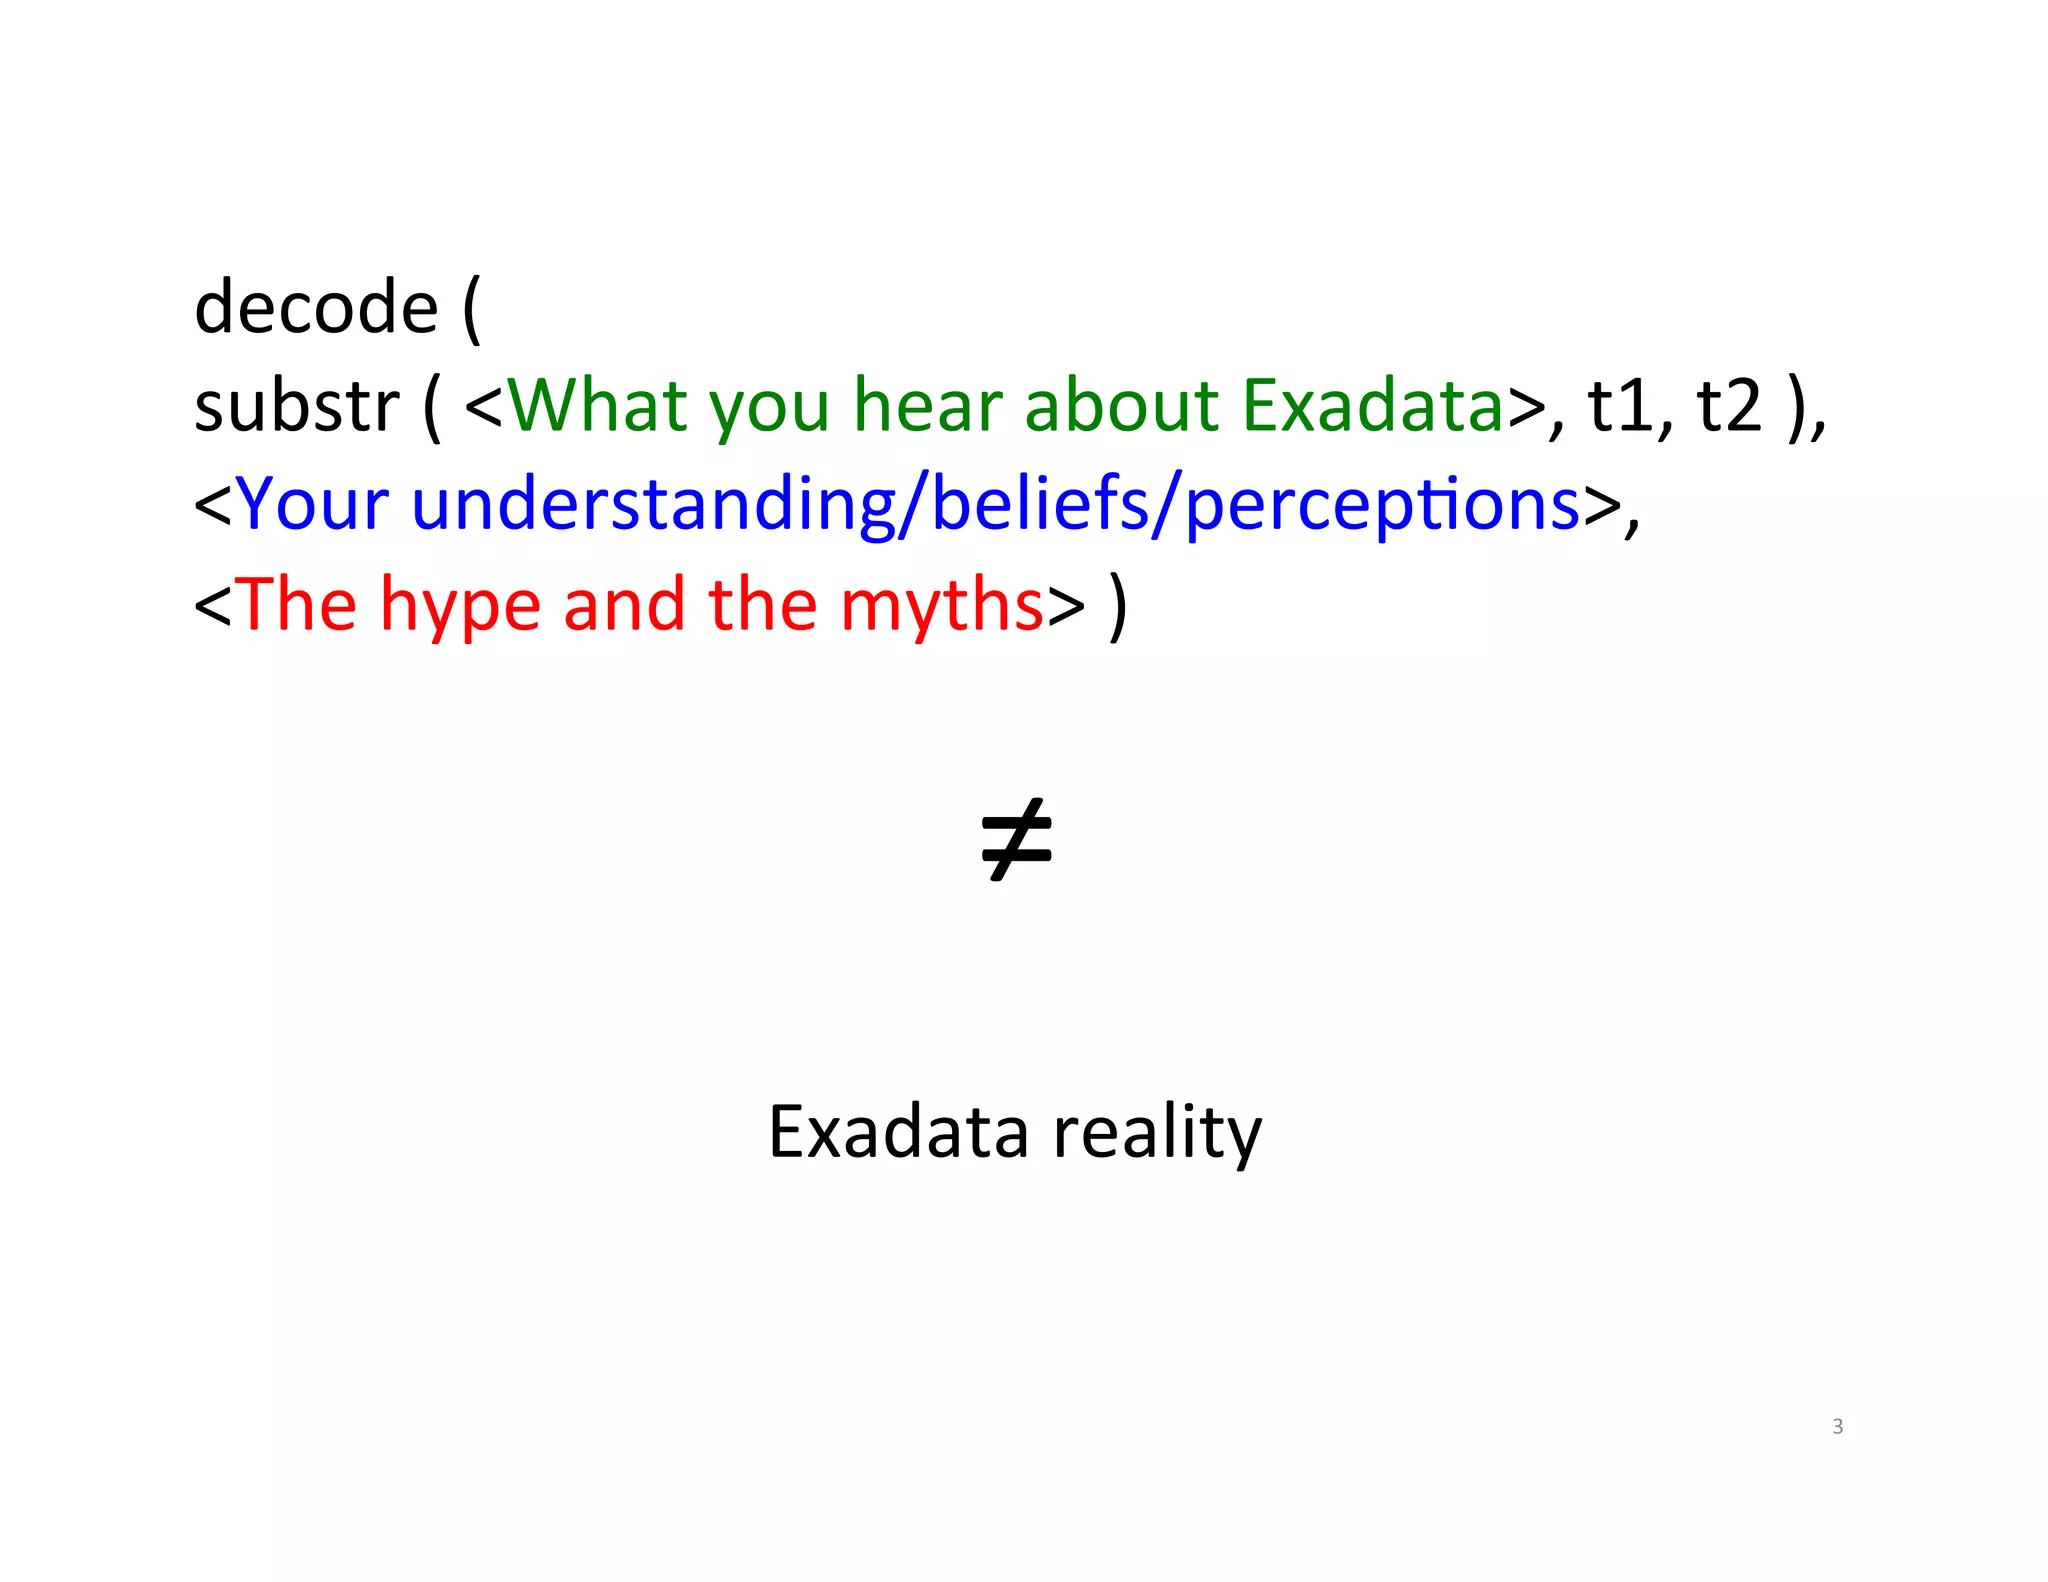
Clarification regarding tuning for Exadata, noting it does not magically fix bad SQL.
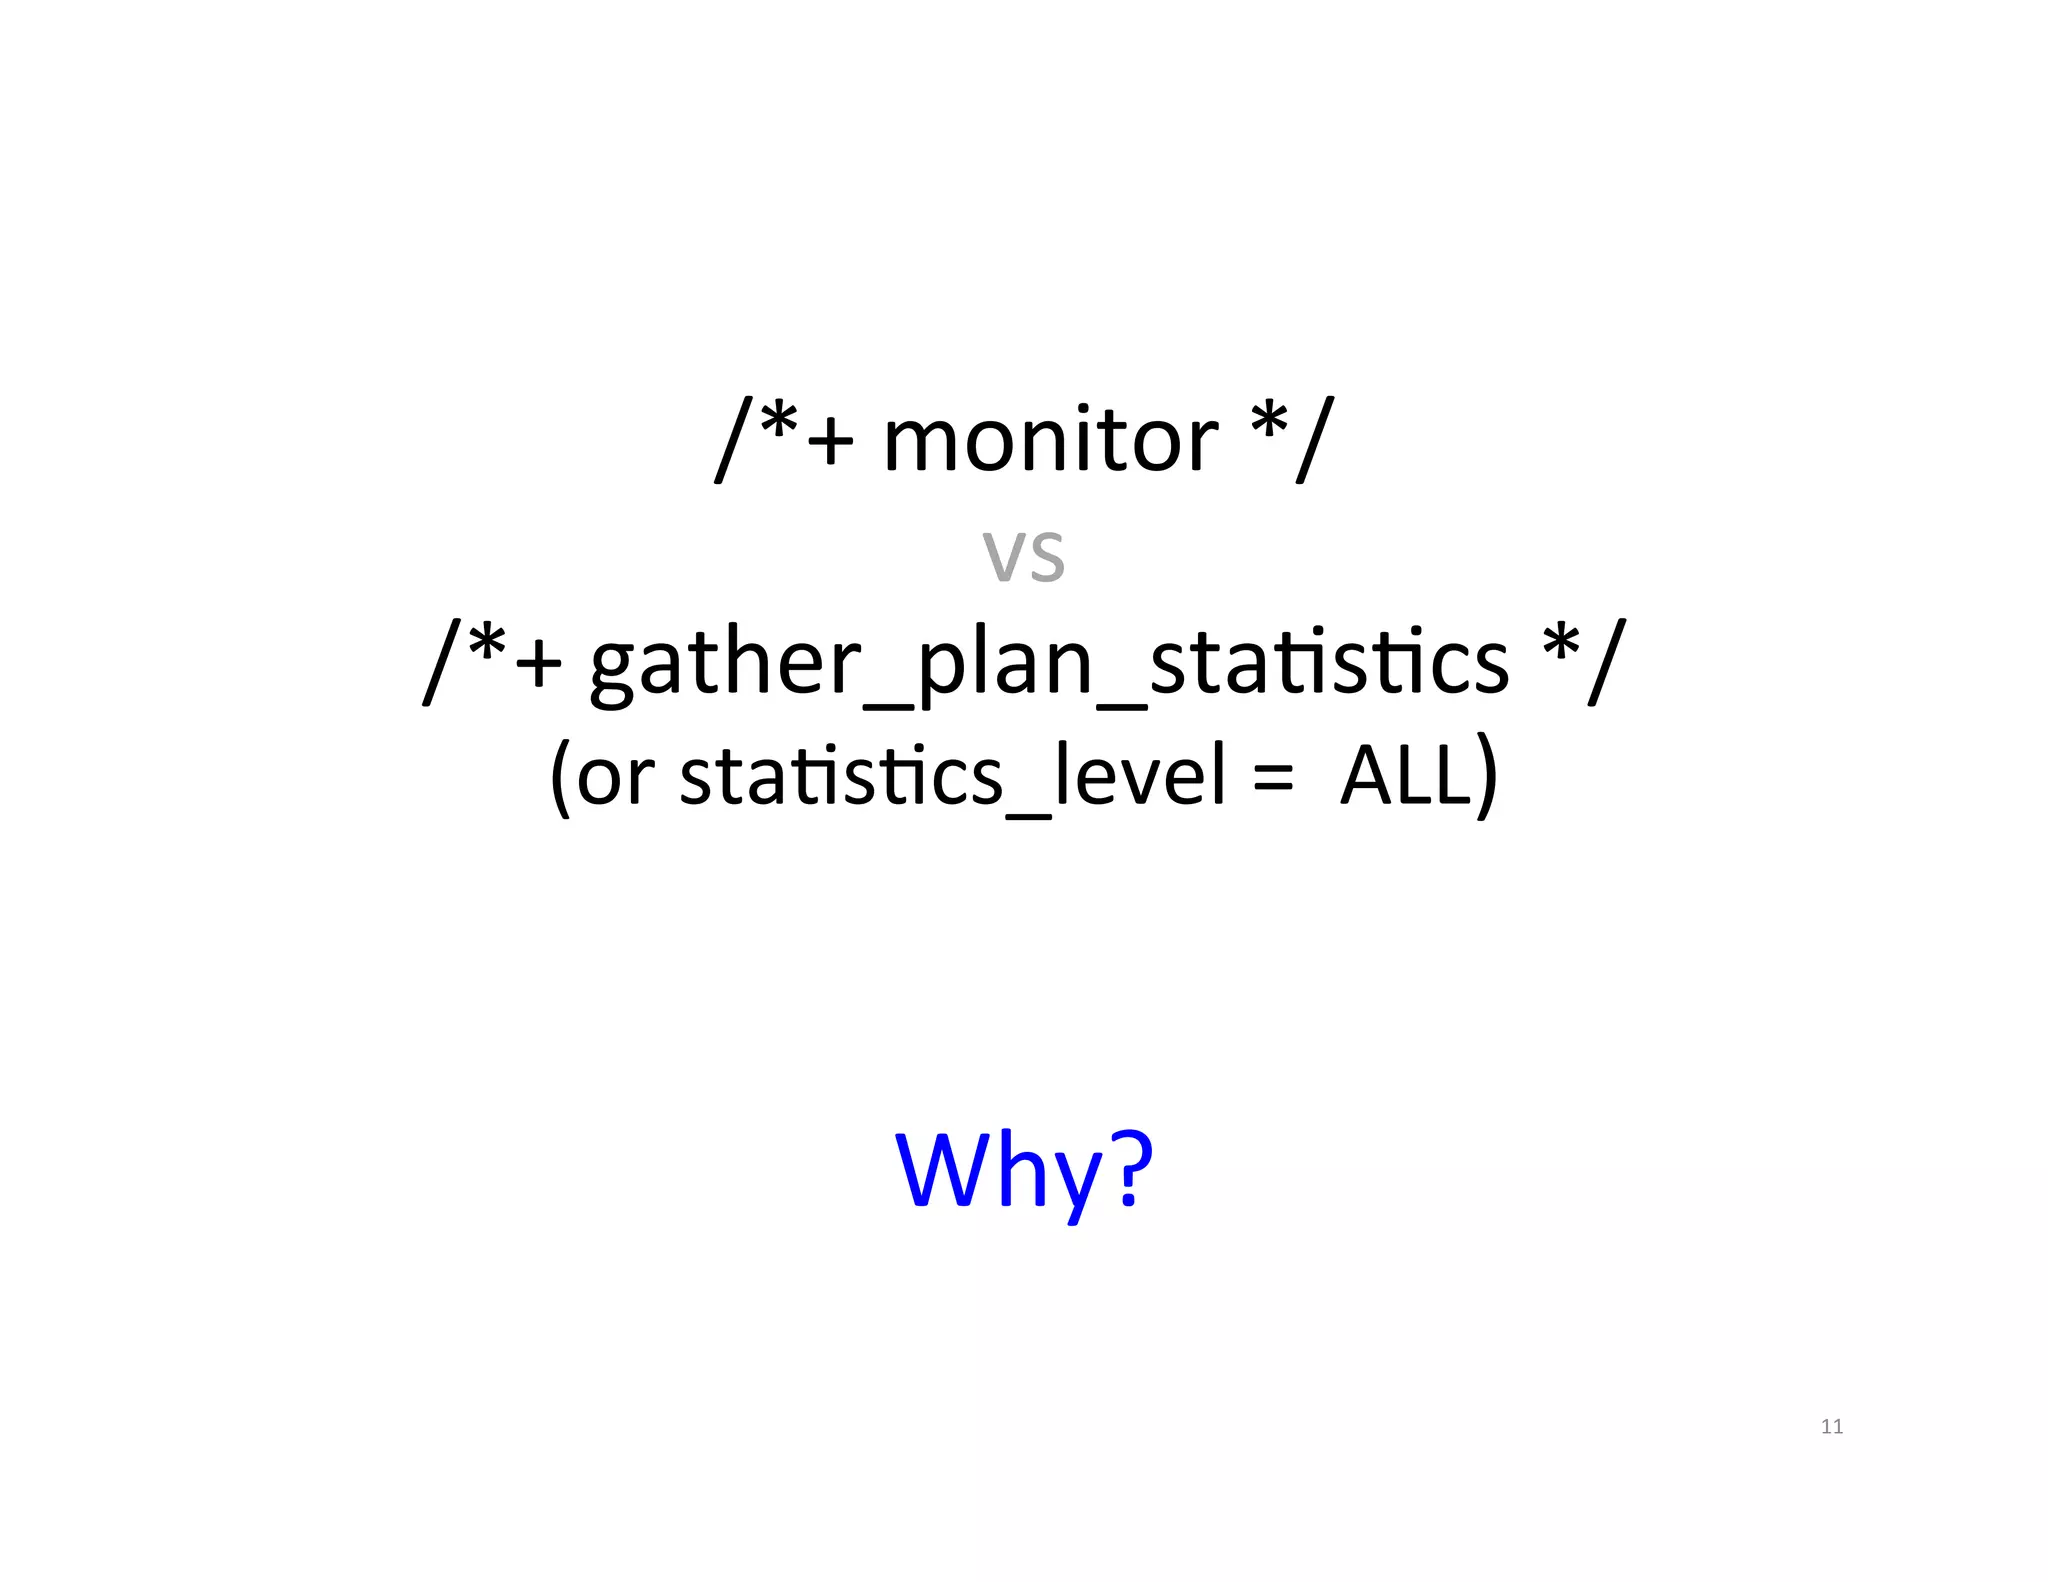
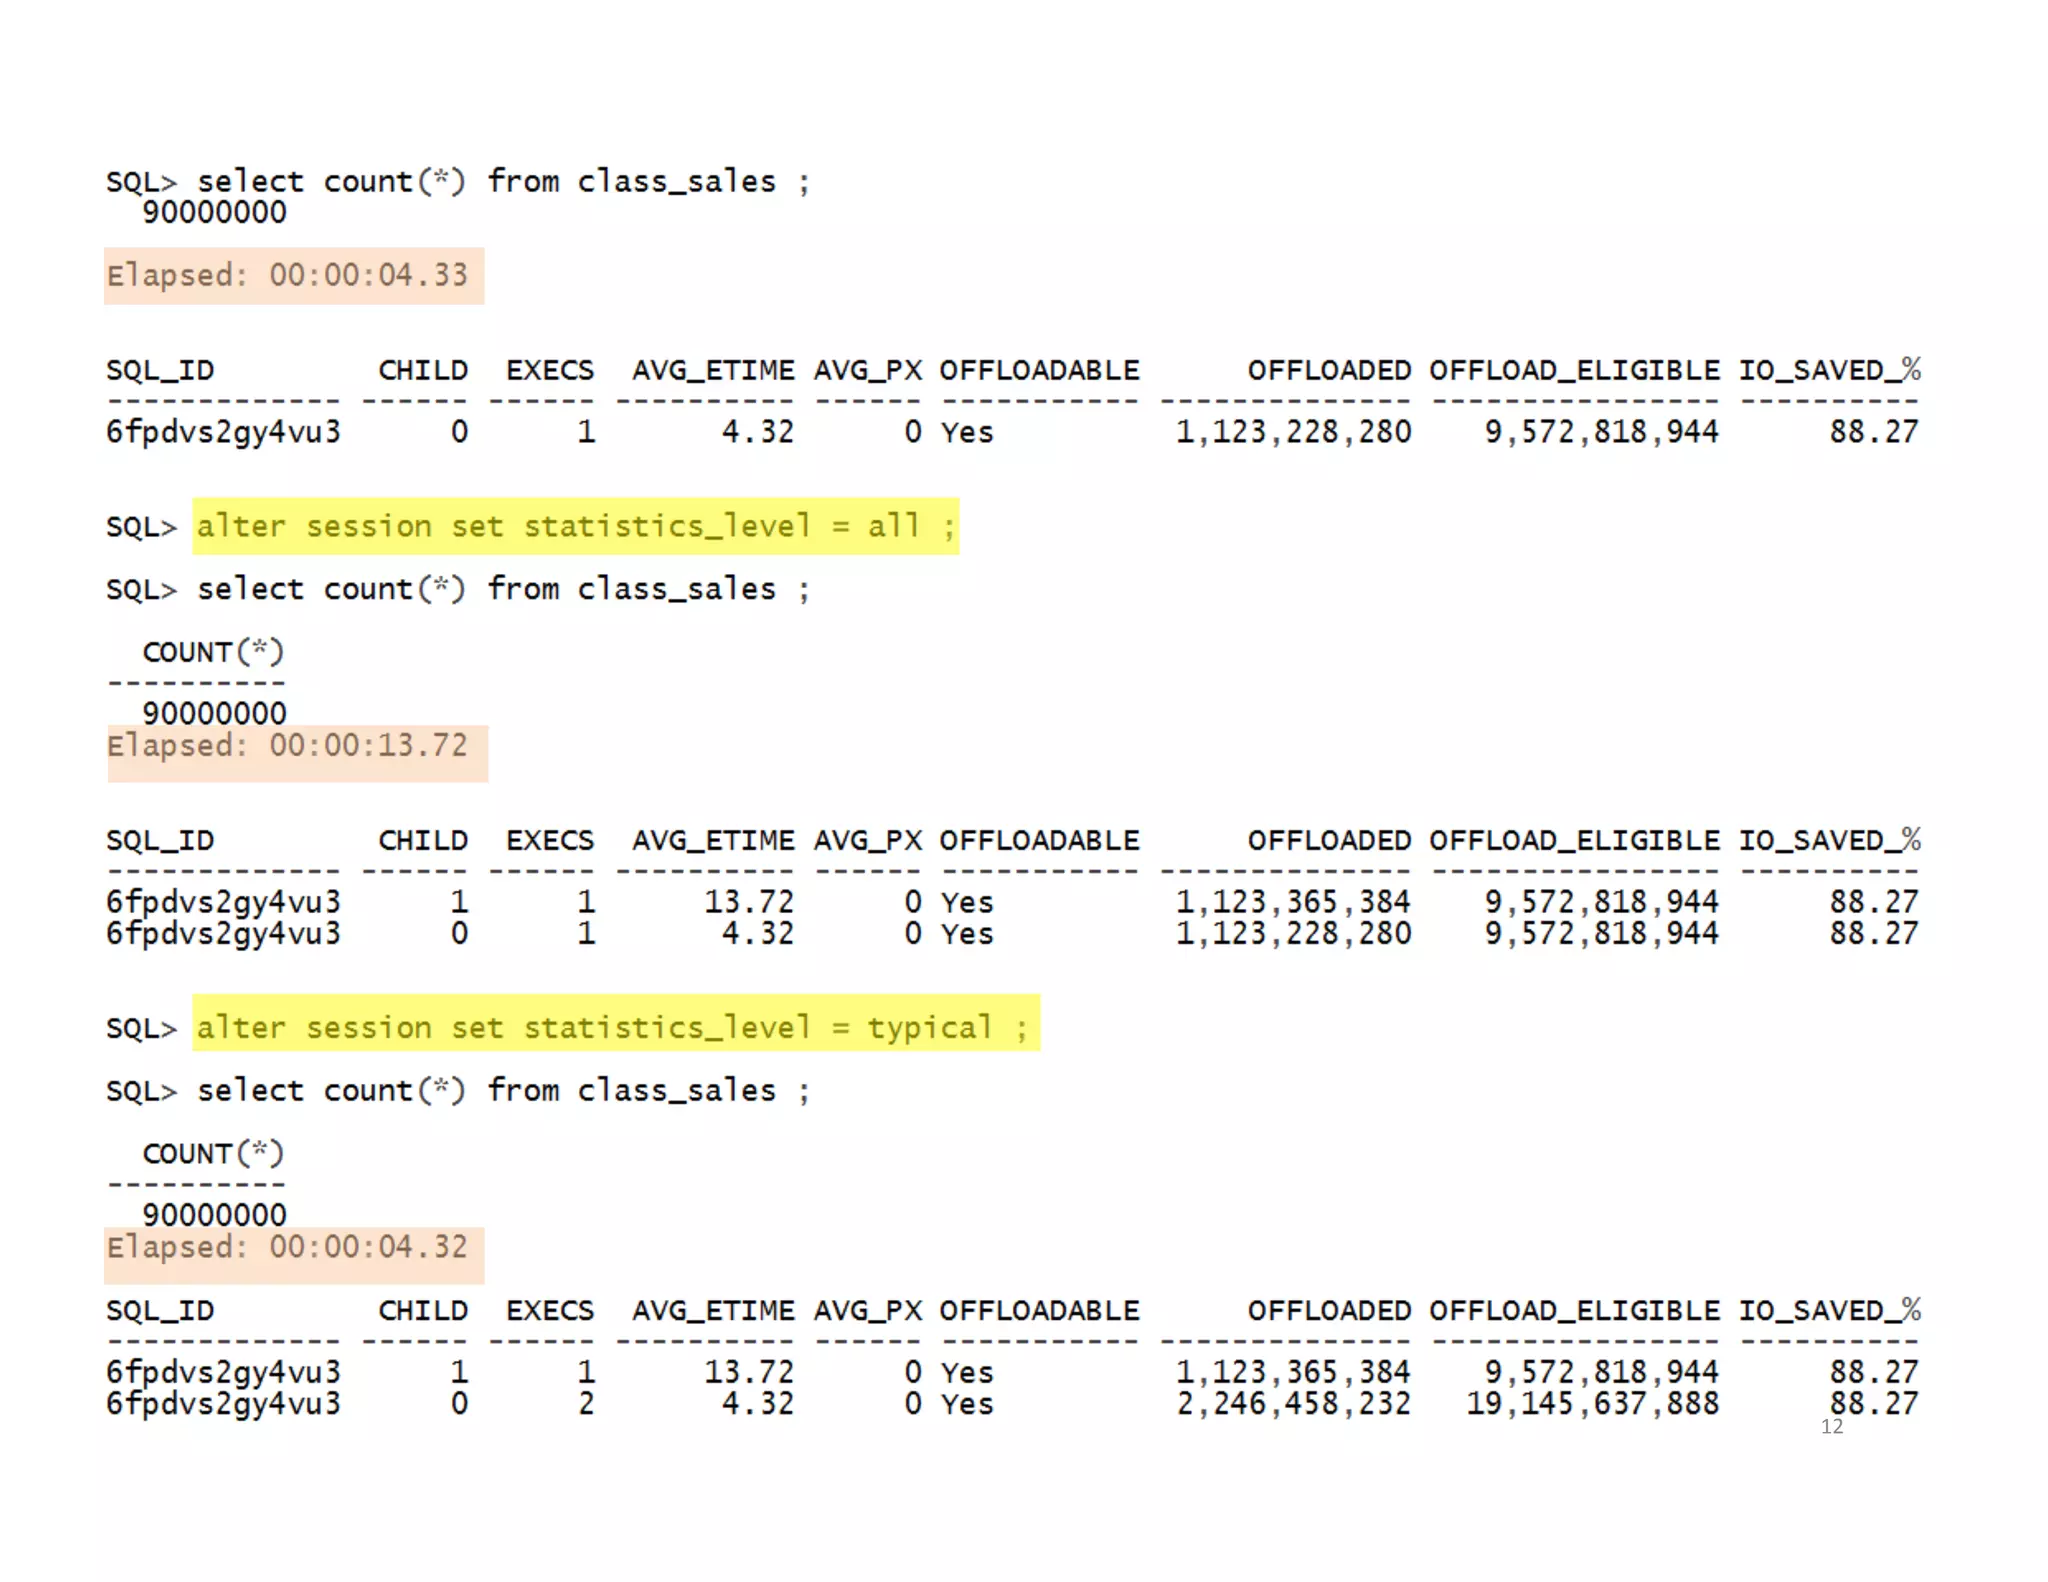
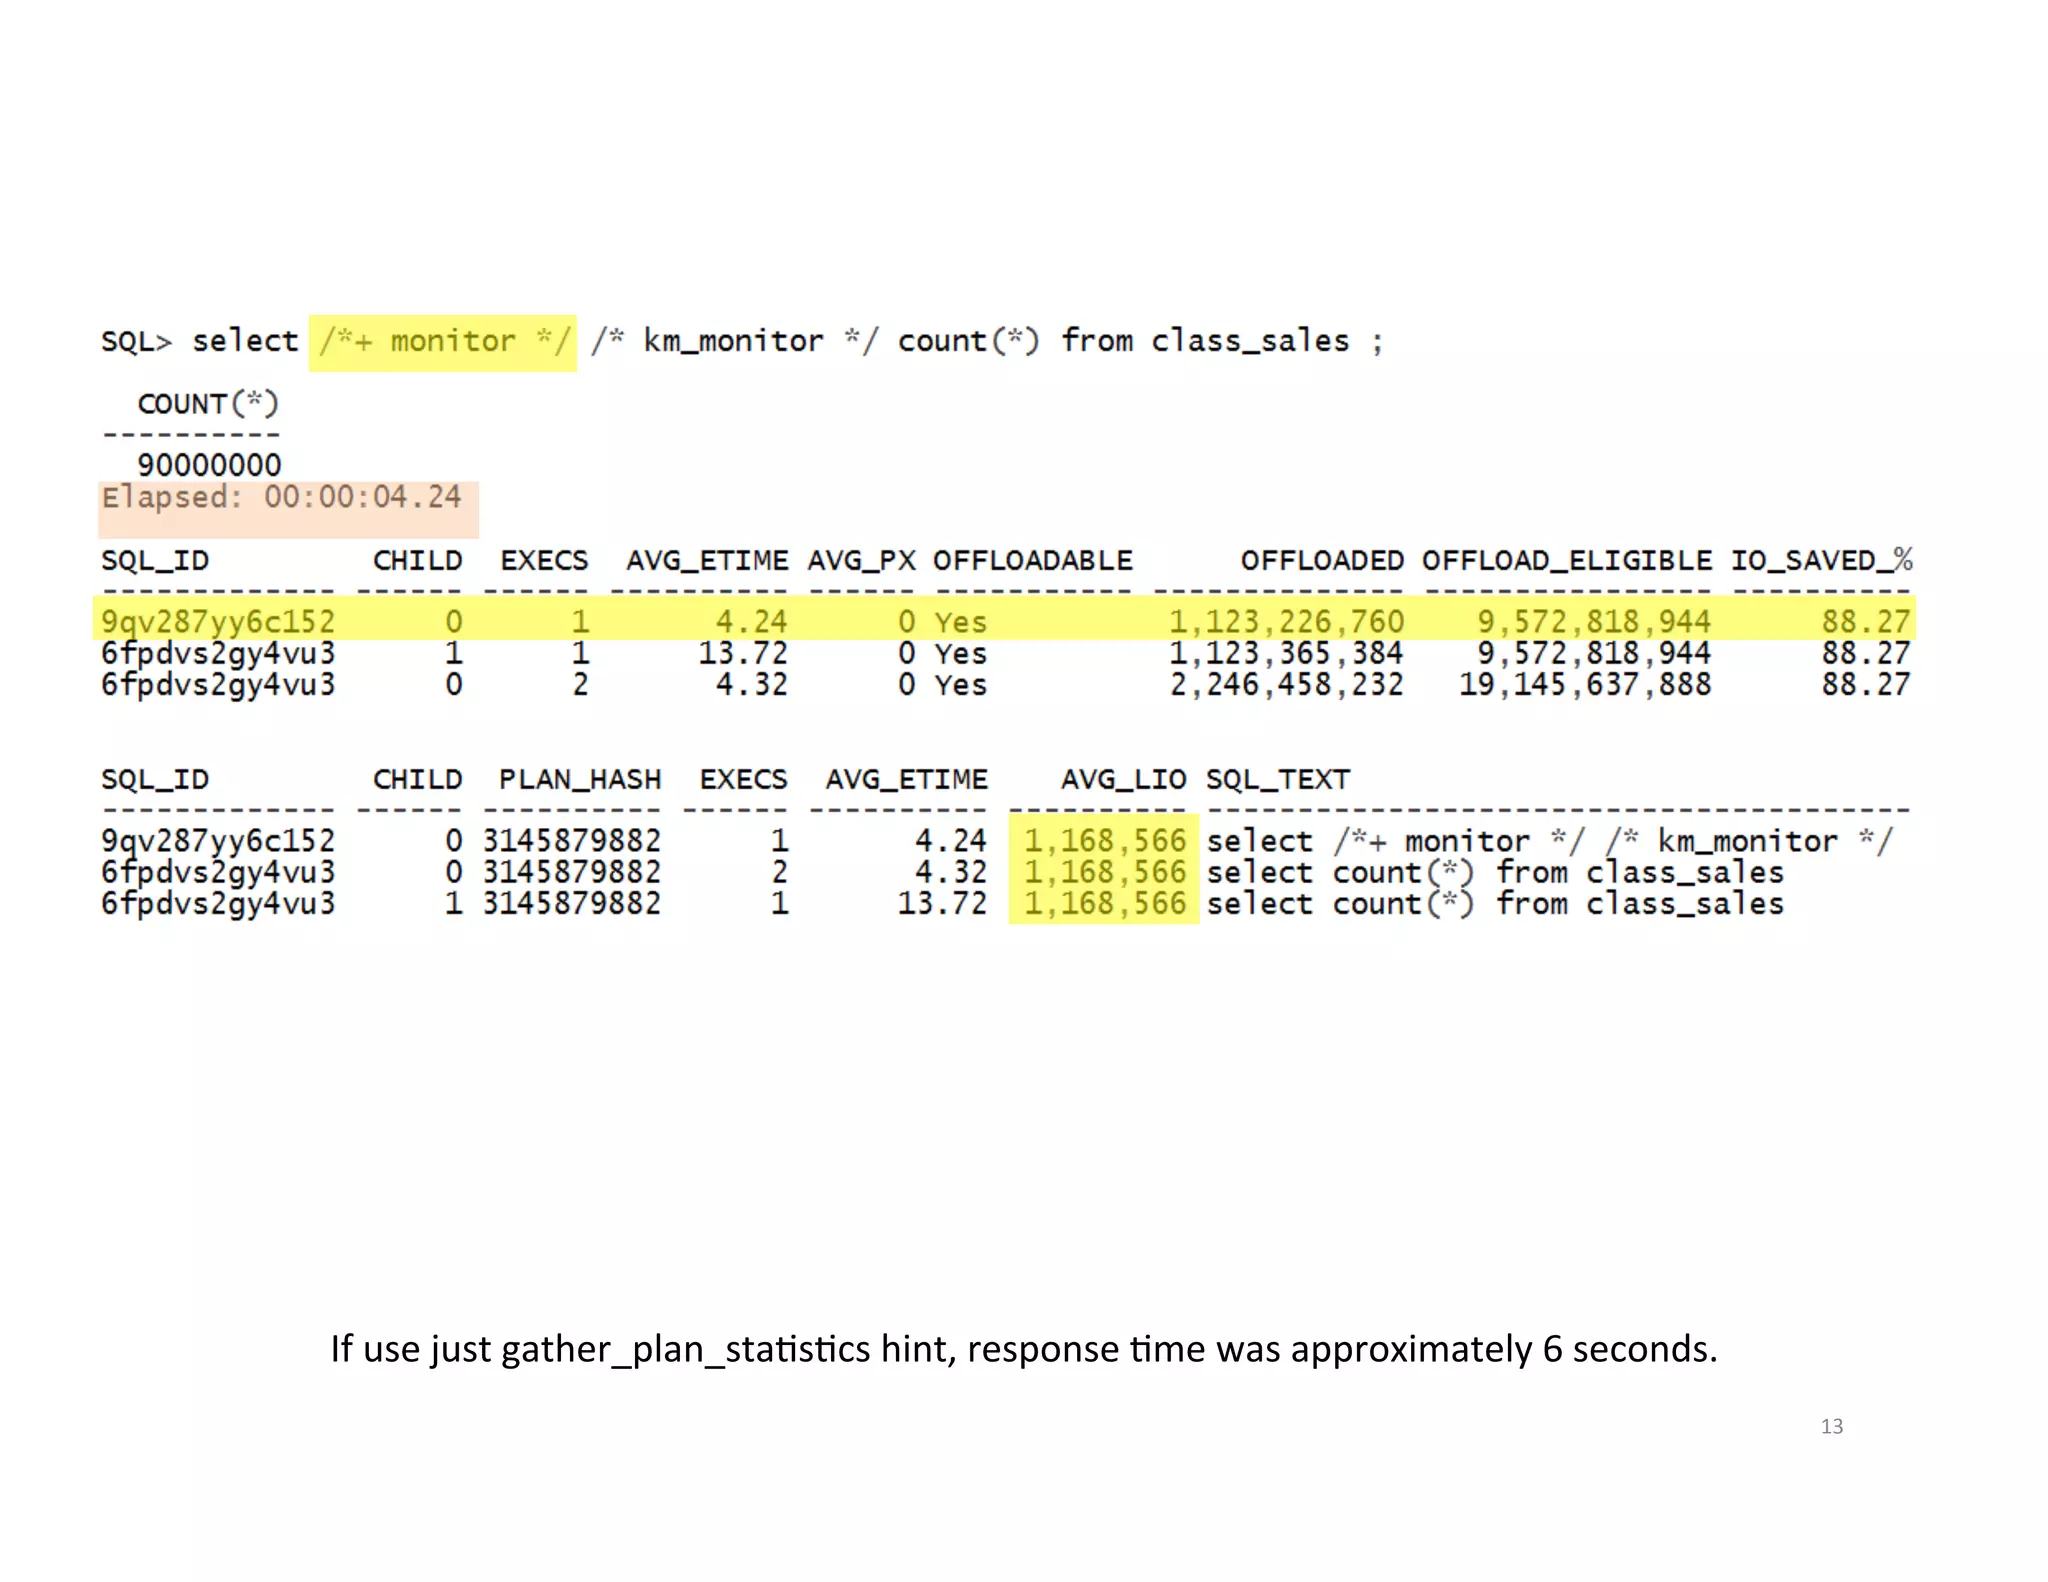
Gathering and displaying execution plan data for analysis using SQL hints.
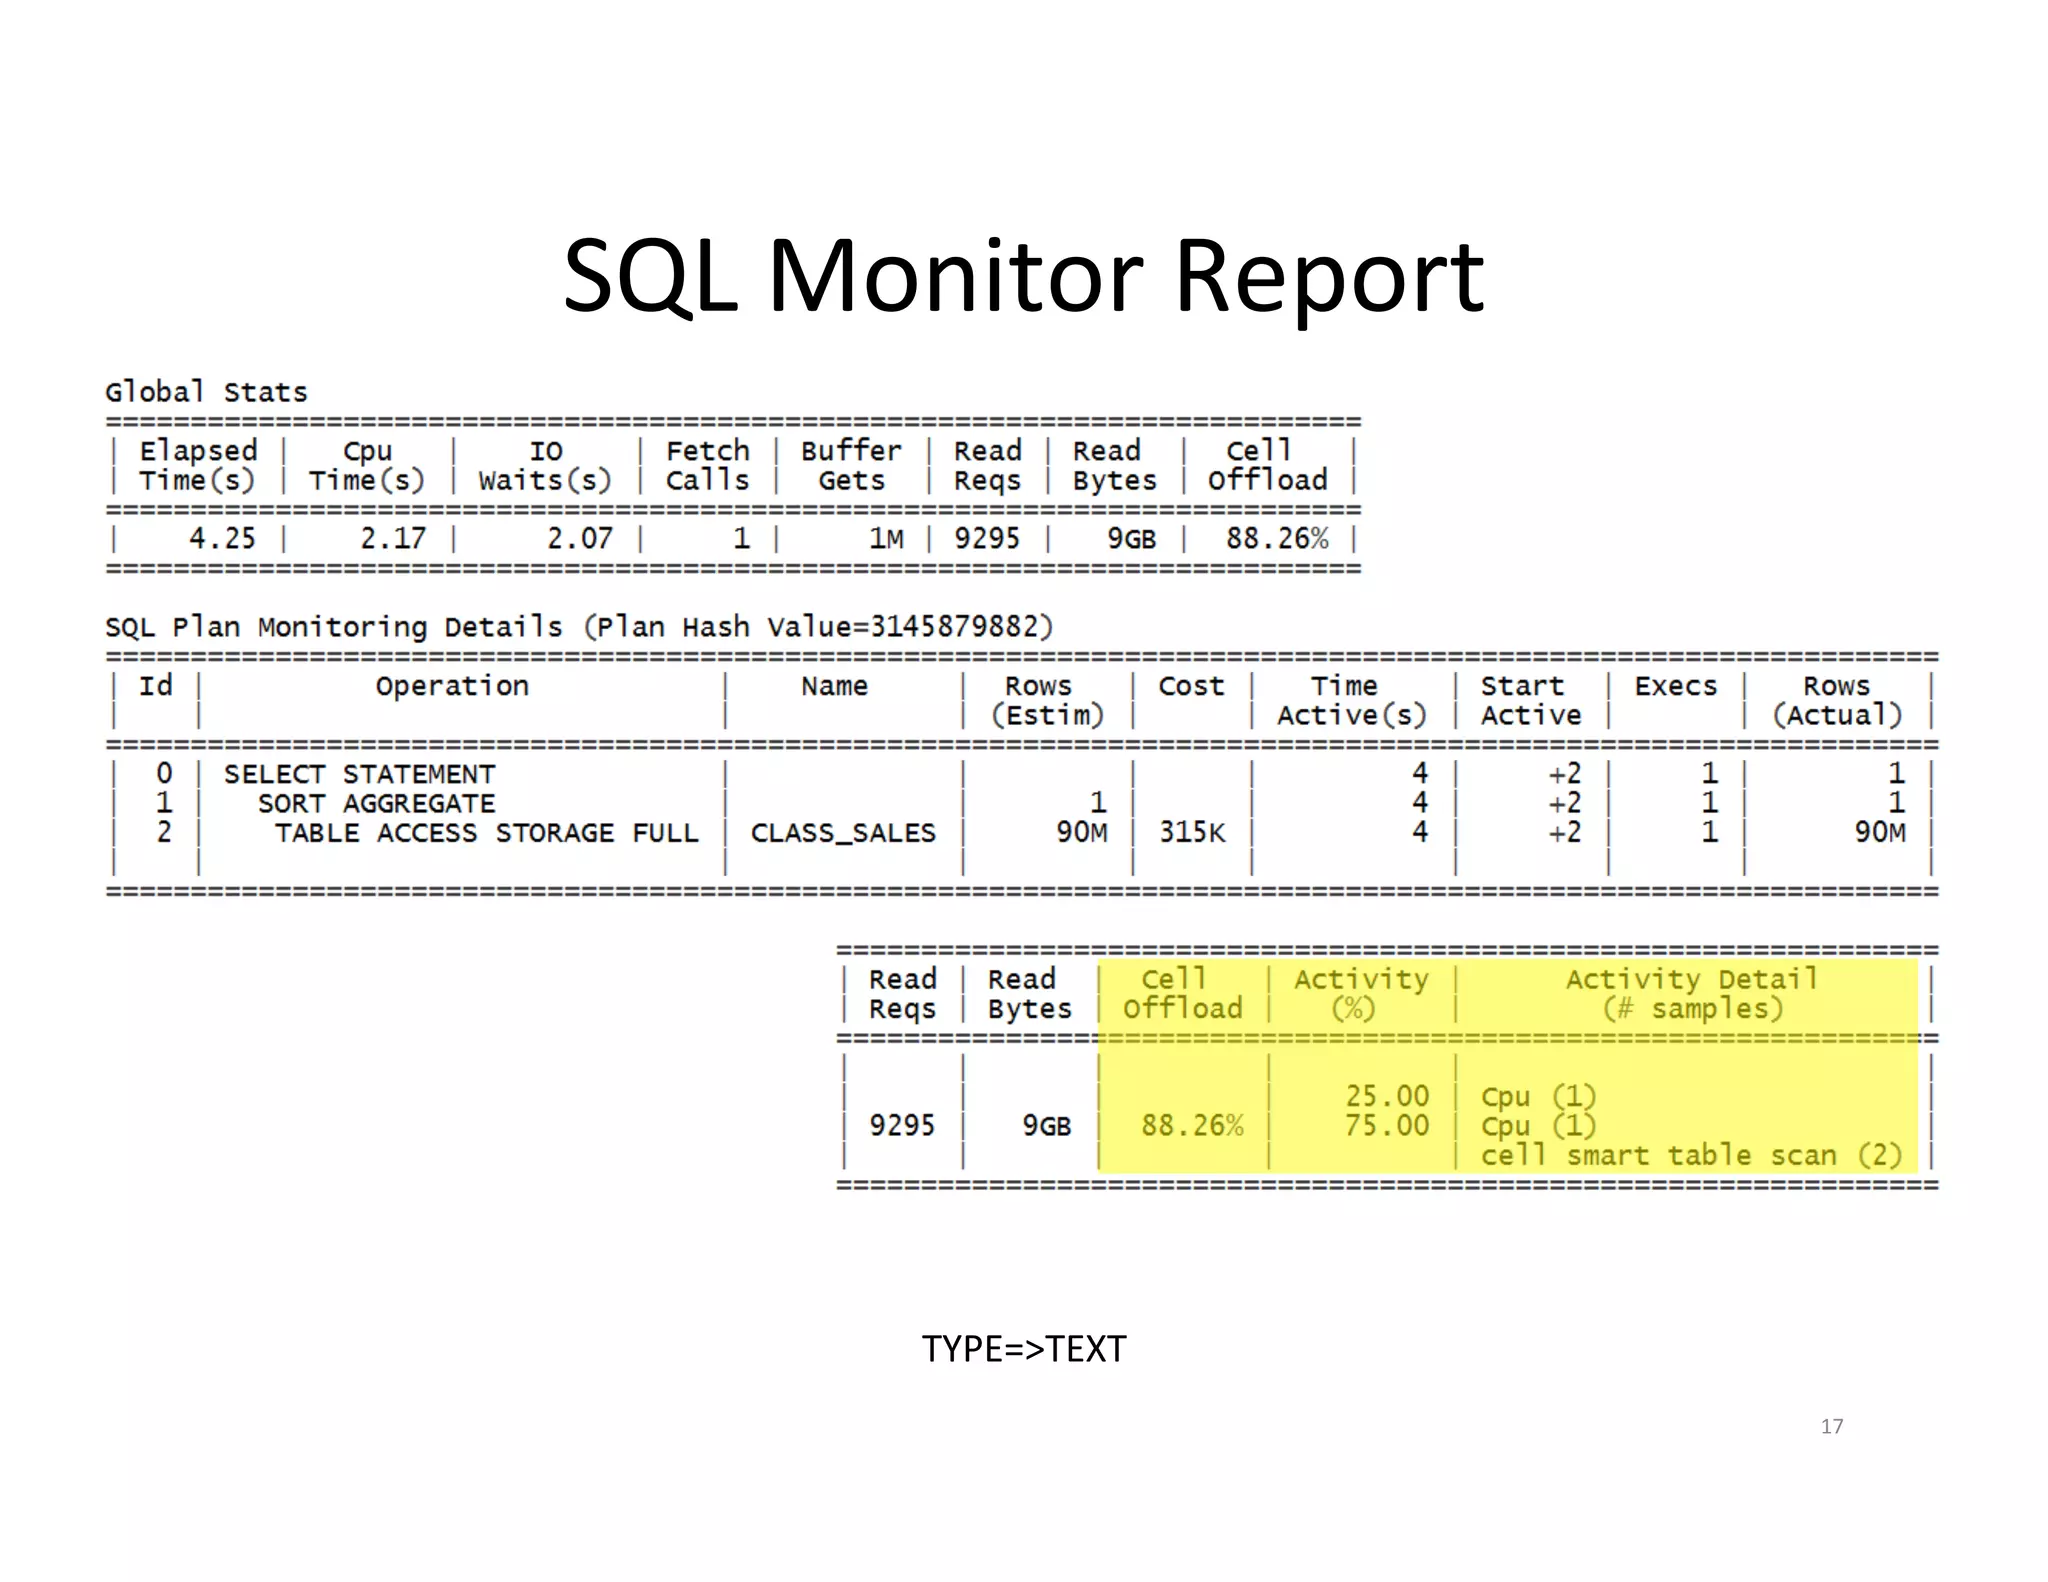
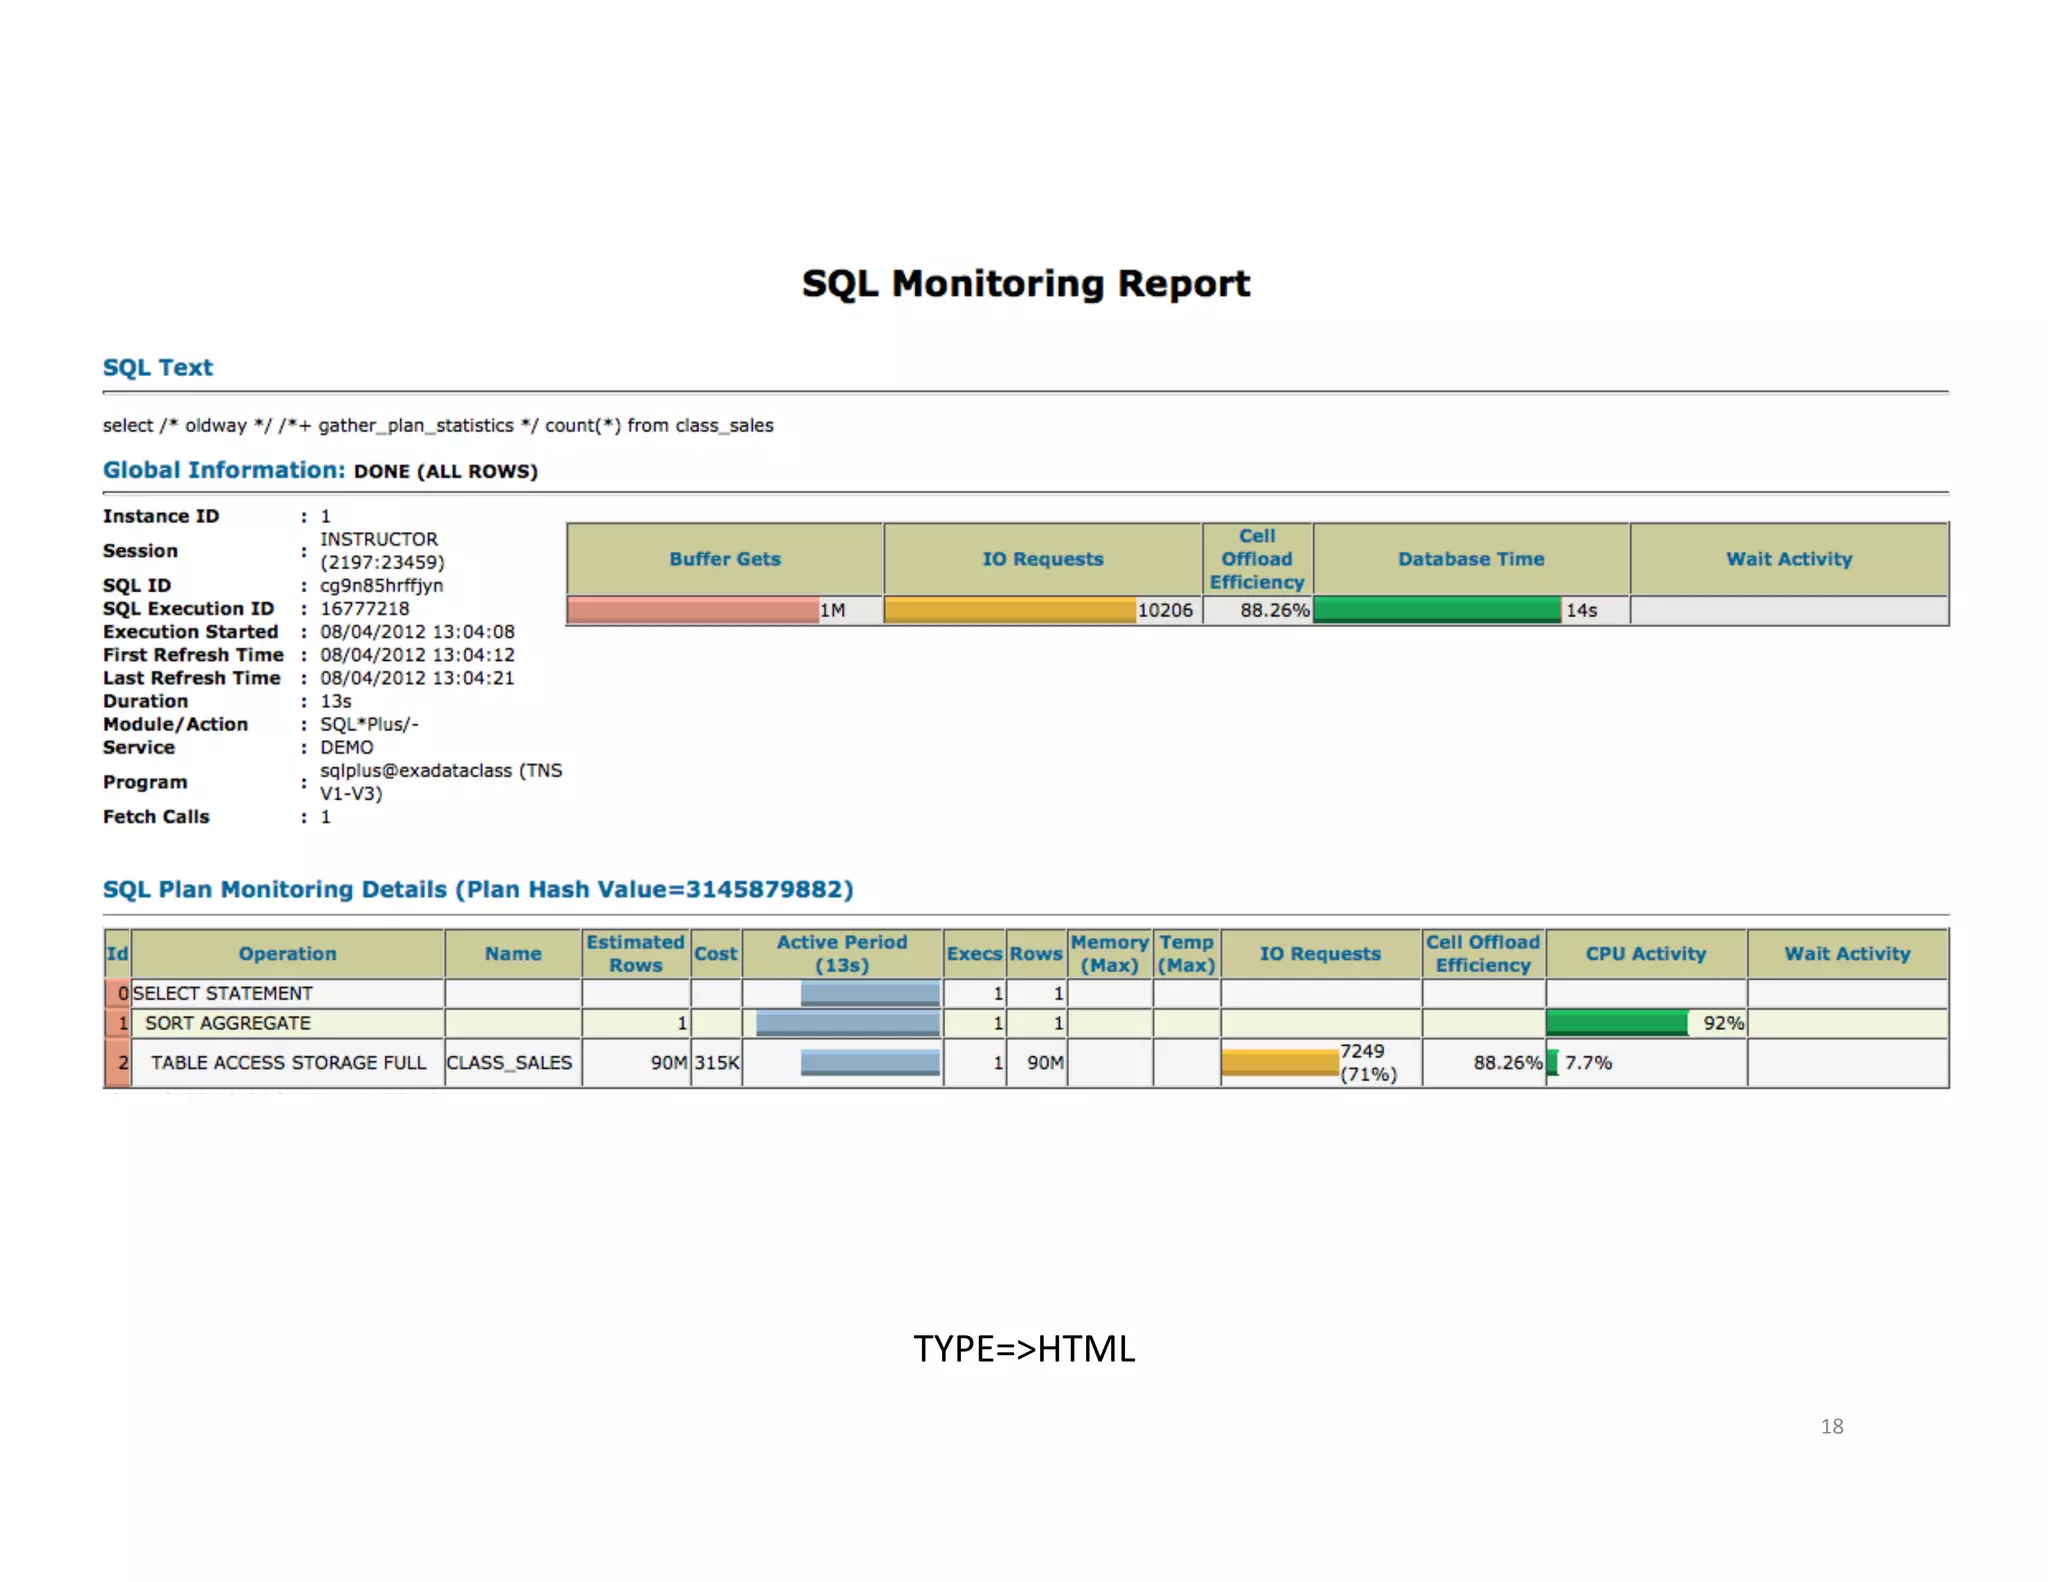
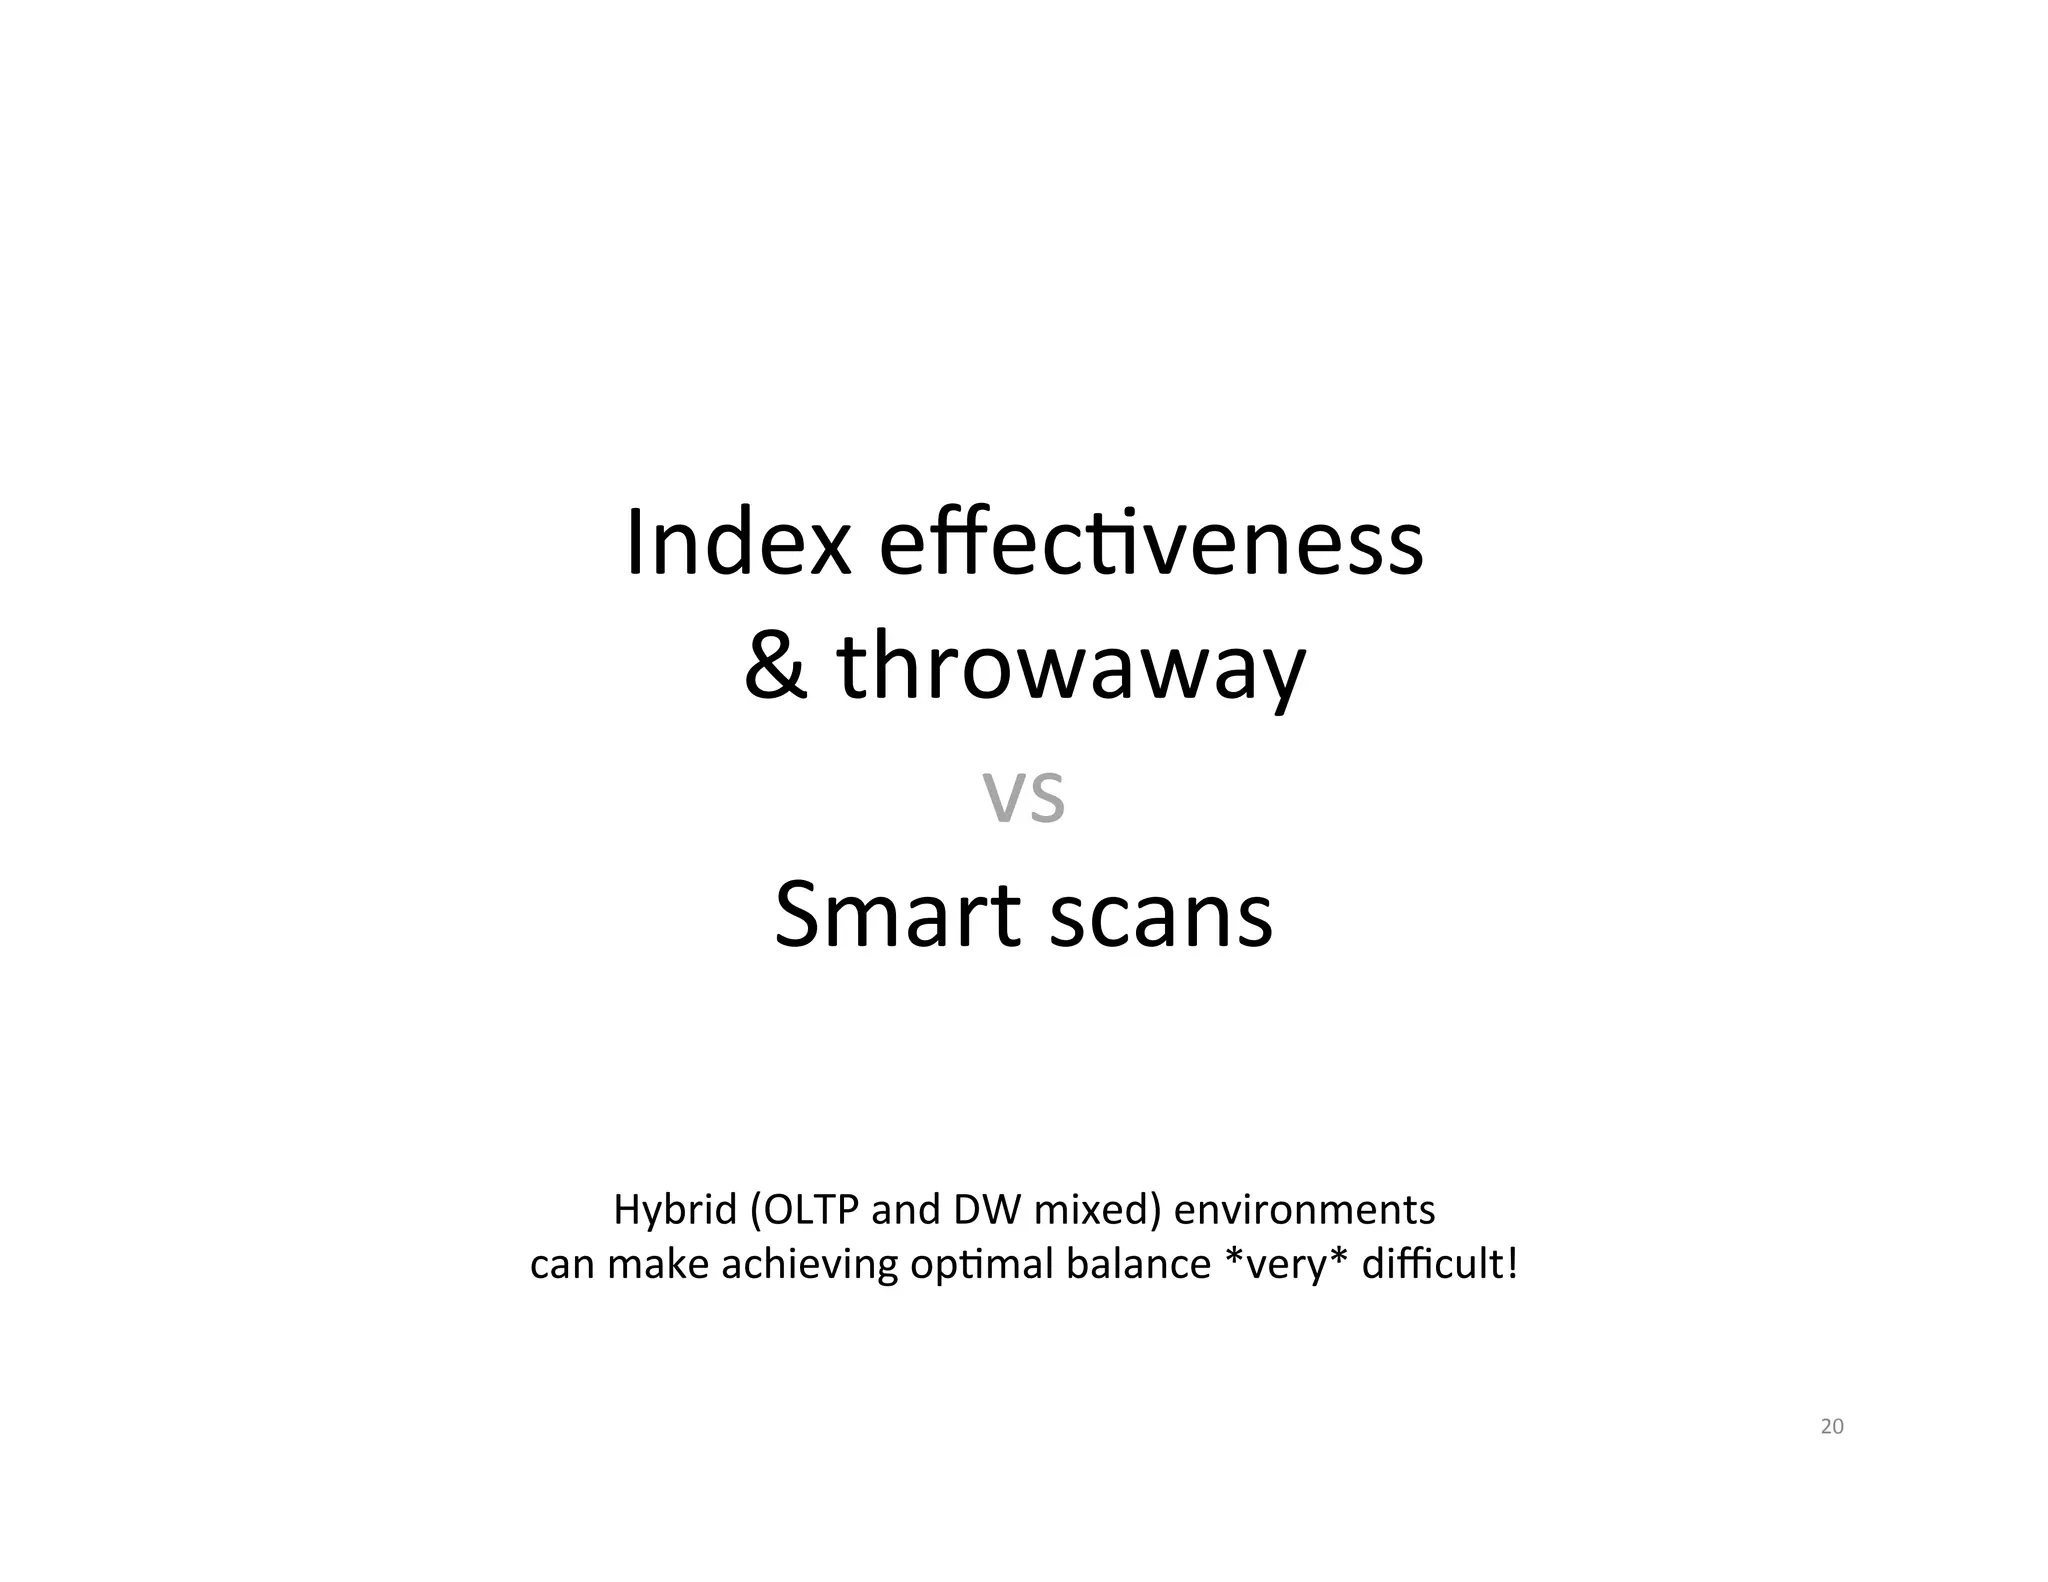
Different methods to generate SQL Monitor and execution reports for analyzing SQL performance.General strategies for optimizing SQL, focusing on index effectiveness and smart scans.
Explains functionality like storage indexes and Smart Flash Cache and their impact on performance.
Discusses the effects of parallelism and plan selection in improving SQL execution efficiency.
Examples of response time improvements through SQL tuning and execution plan optimizations.
Methods and best practices to promote smart scans, best practices for SQL profiling for problem-solving.
Recap of main points indicating the importance of fixing SQL for optimal performance on Exadata.
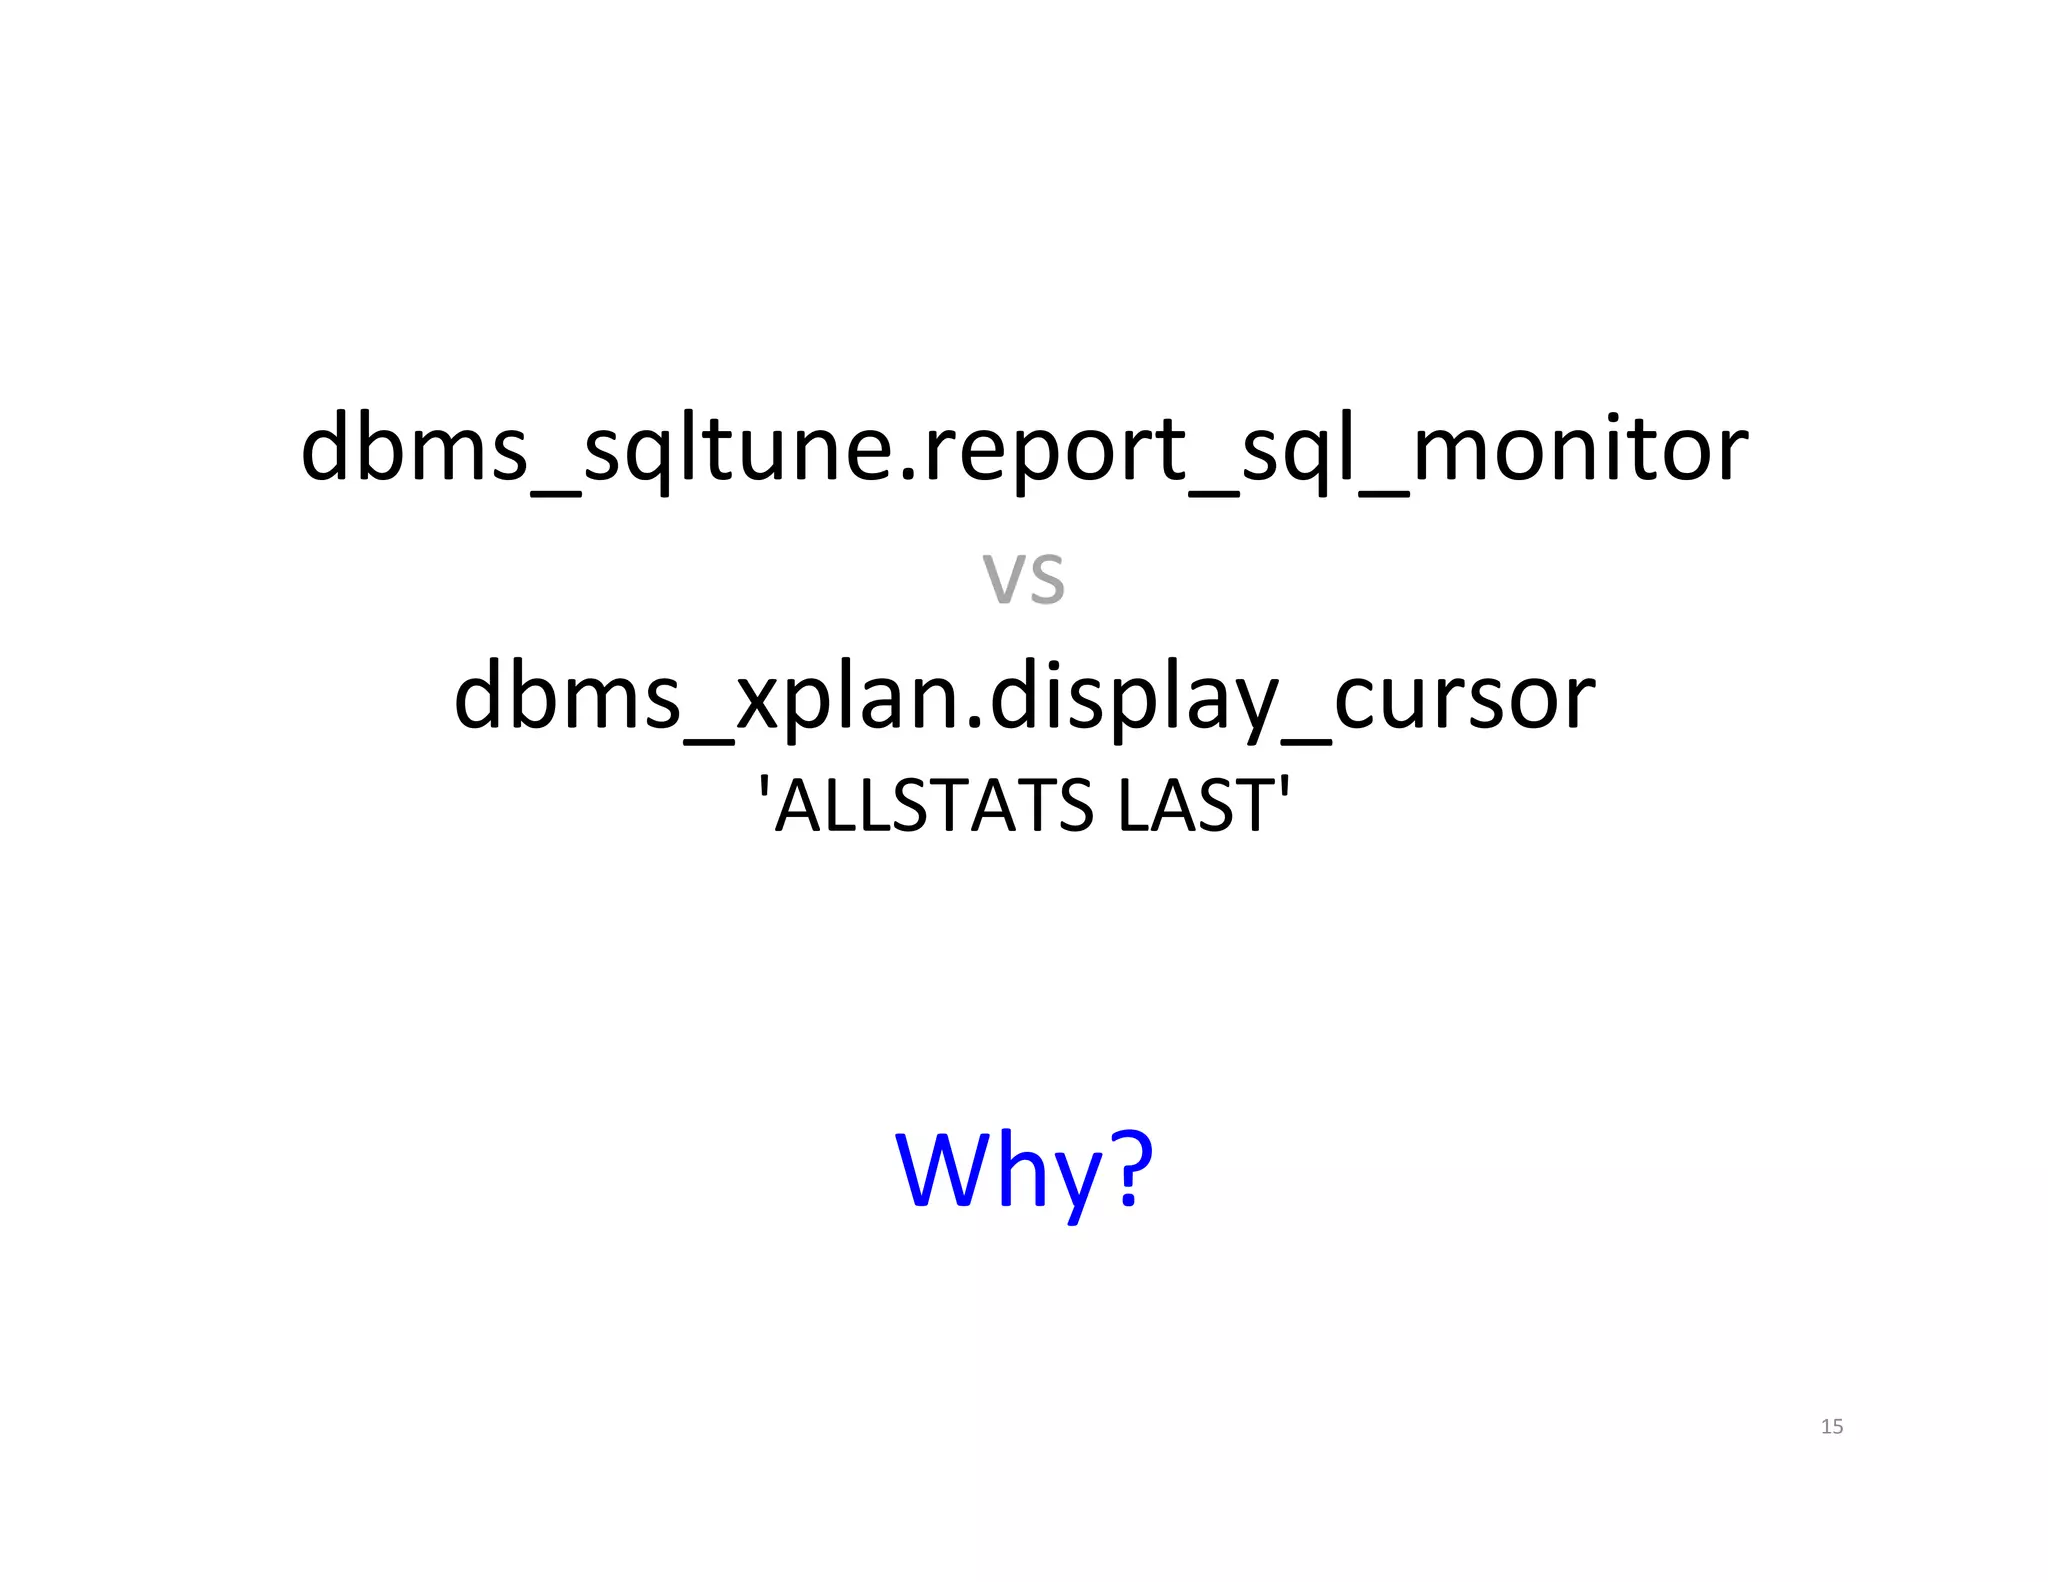
How to Generate select DBMS_SQLTUNE.REPORT_SQL_MONITOR( sql_id=>'&sql_id', session_id=>nvl('&sid',sys_context('userenv','sid')), type=>'&report_type', report_level=>'ALL') as report from dual; select * from table(DBMS_XPLAN.DISPLAY_CURSOR( '&sql_id','&child_no', nvl('&format','ALLSTATS LAST'))); Defaults to last statement executed in the current session 16
The Good • Smart scans • Storage indexes • ESFC • Parallelism • ParJJoning Features where you get the most bang for your SQL tuning buck. 23
24.
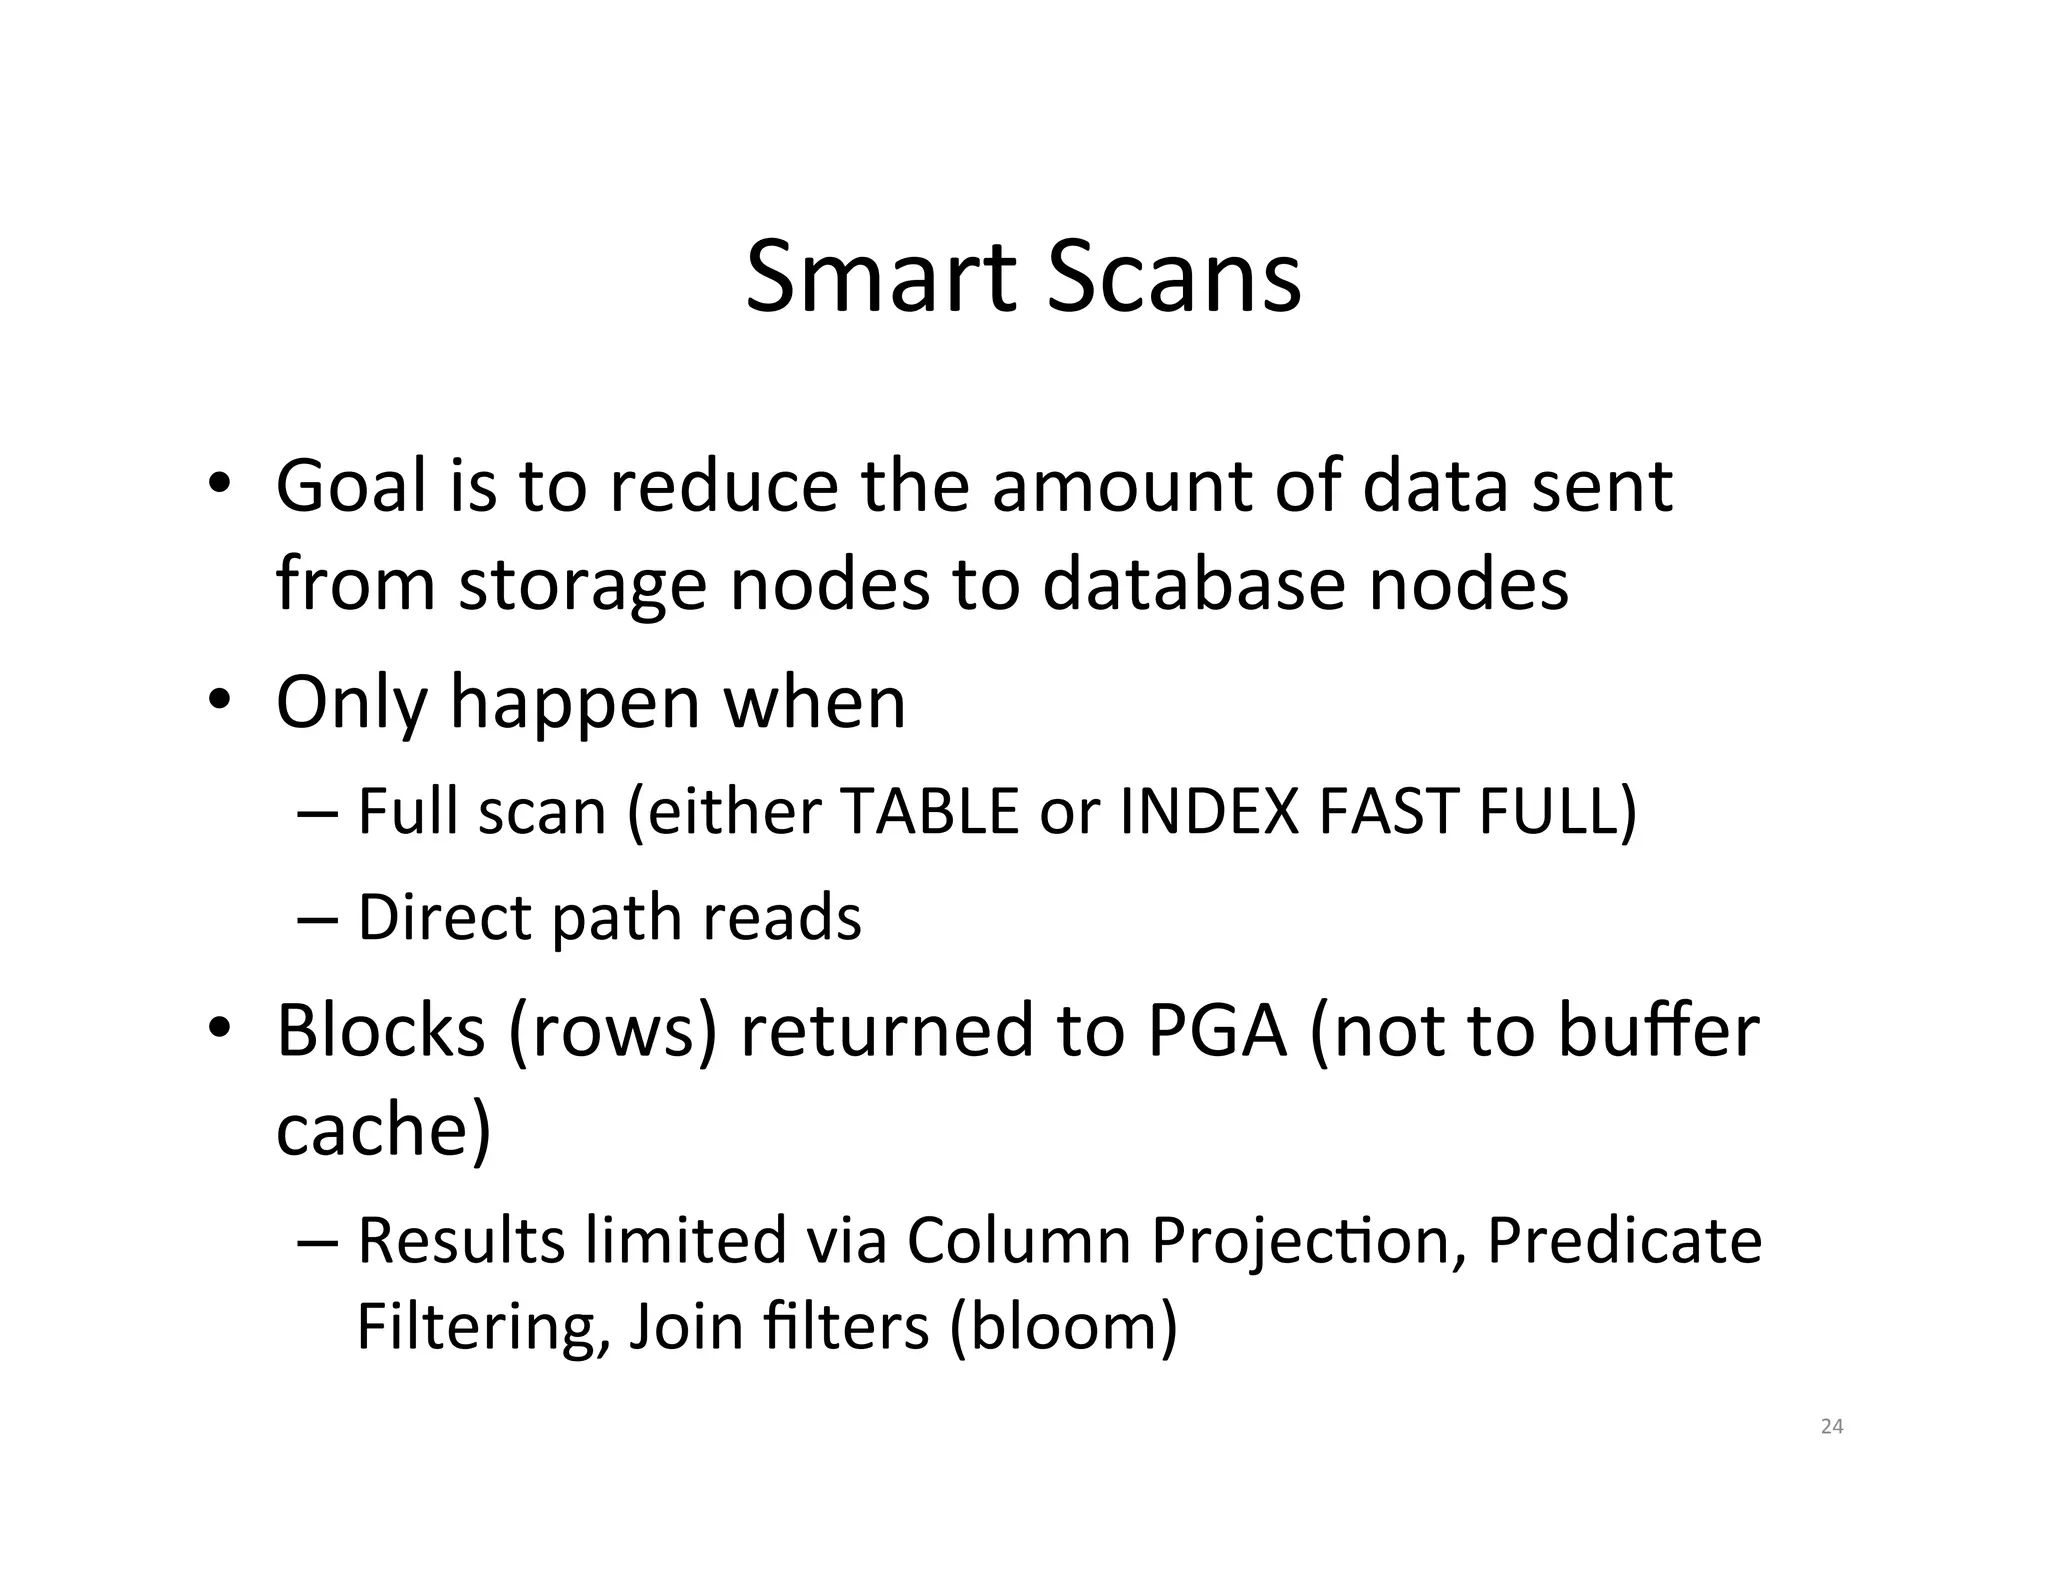
Smart Scans • Goal is to reduce the amount of data sent from storage nodes to database nodes • Only happen when – Full scan (either TABLE or INDEX FAST FULL) – Direct path reads • Blocks (rows) returned to PGA (not to buffer cache) – Results limited via Column ProjecJon, Predicate Filtering, Join filters (bloom) 24
25.
How do you know? • V$SQL family of views: – IO_CELL_OFFLOAD_RETURNED_BYTES – IO_CELL_OFFLOAD_ELIGIBLE_BYTES • Wait event (+) – cell smart table scan – cell smart index scan • Plan Does not necessarily – TABLE ACCESS STORAGE FULL mean a smart scan occurred but that it – Storage() predicate could! 25
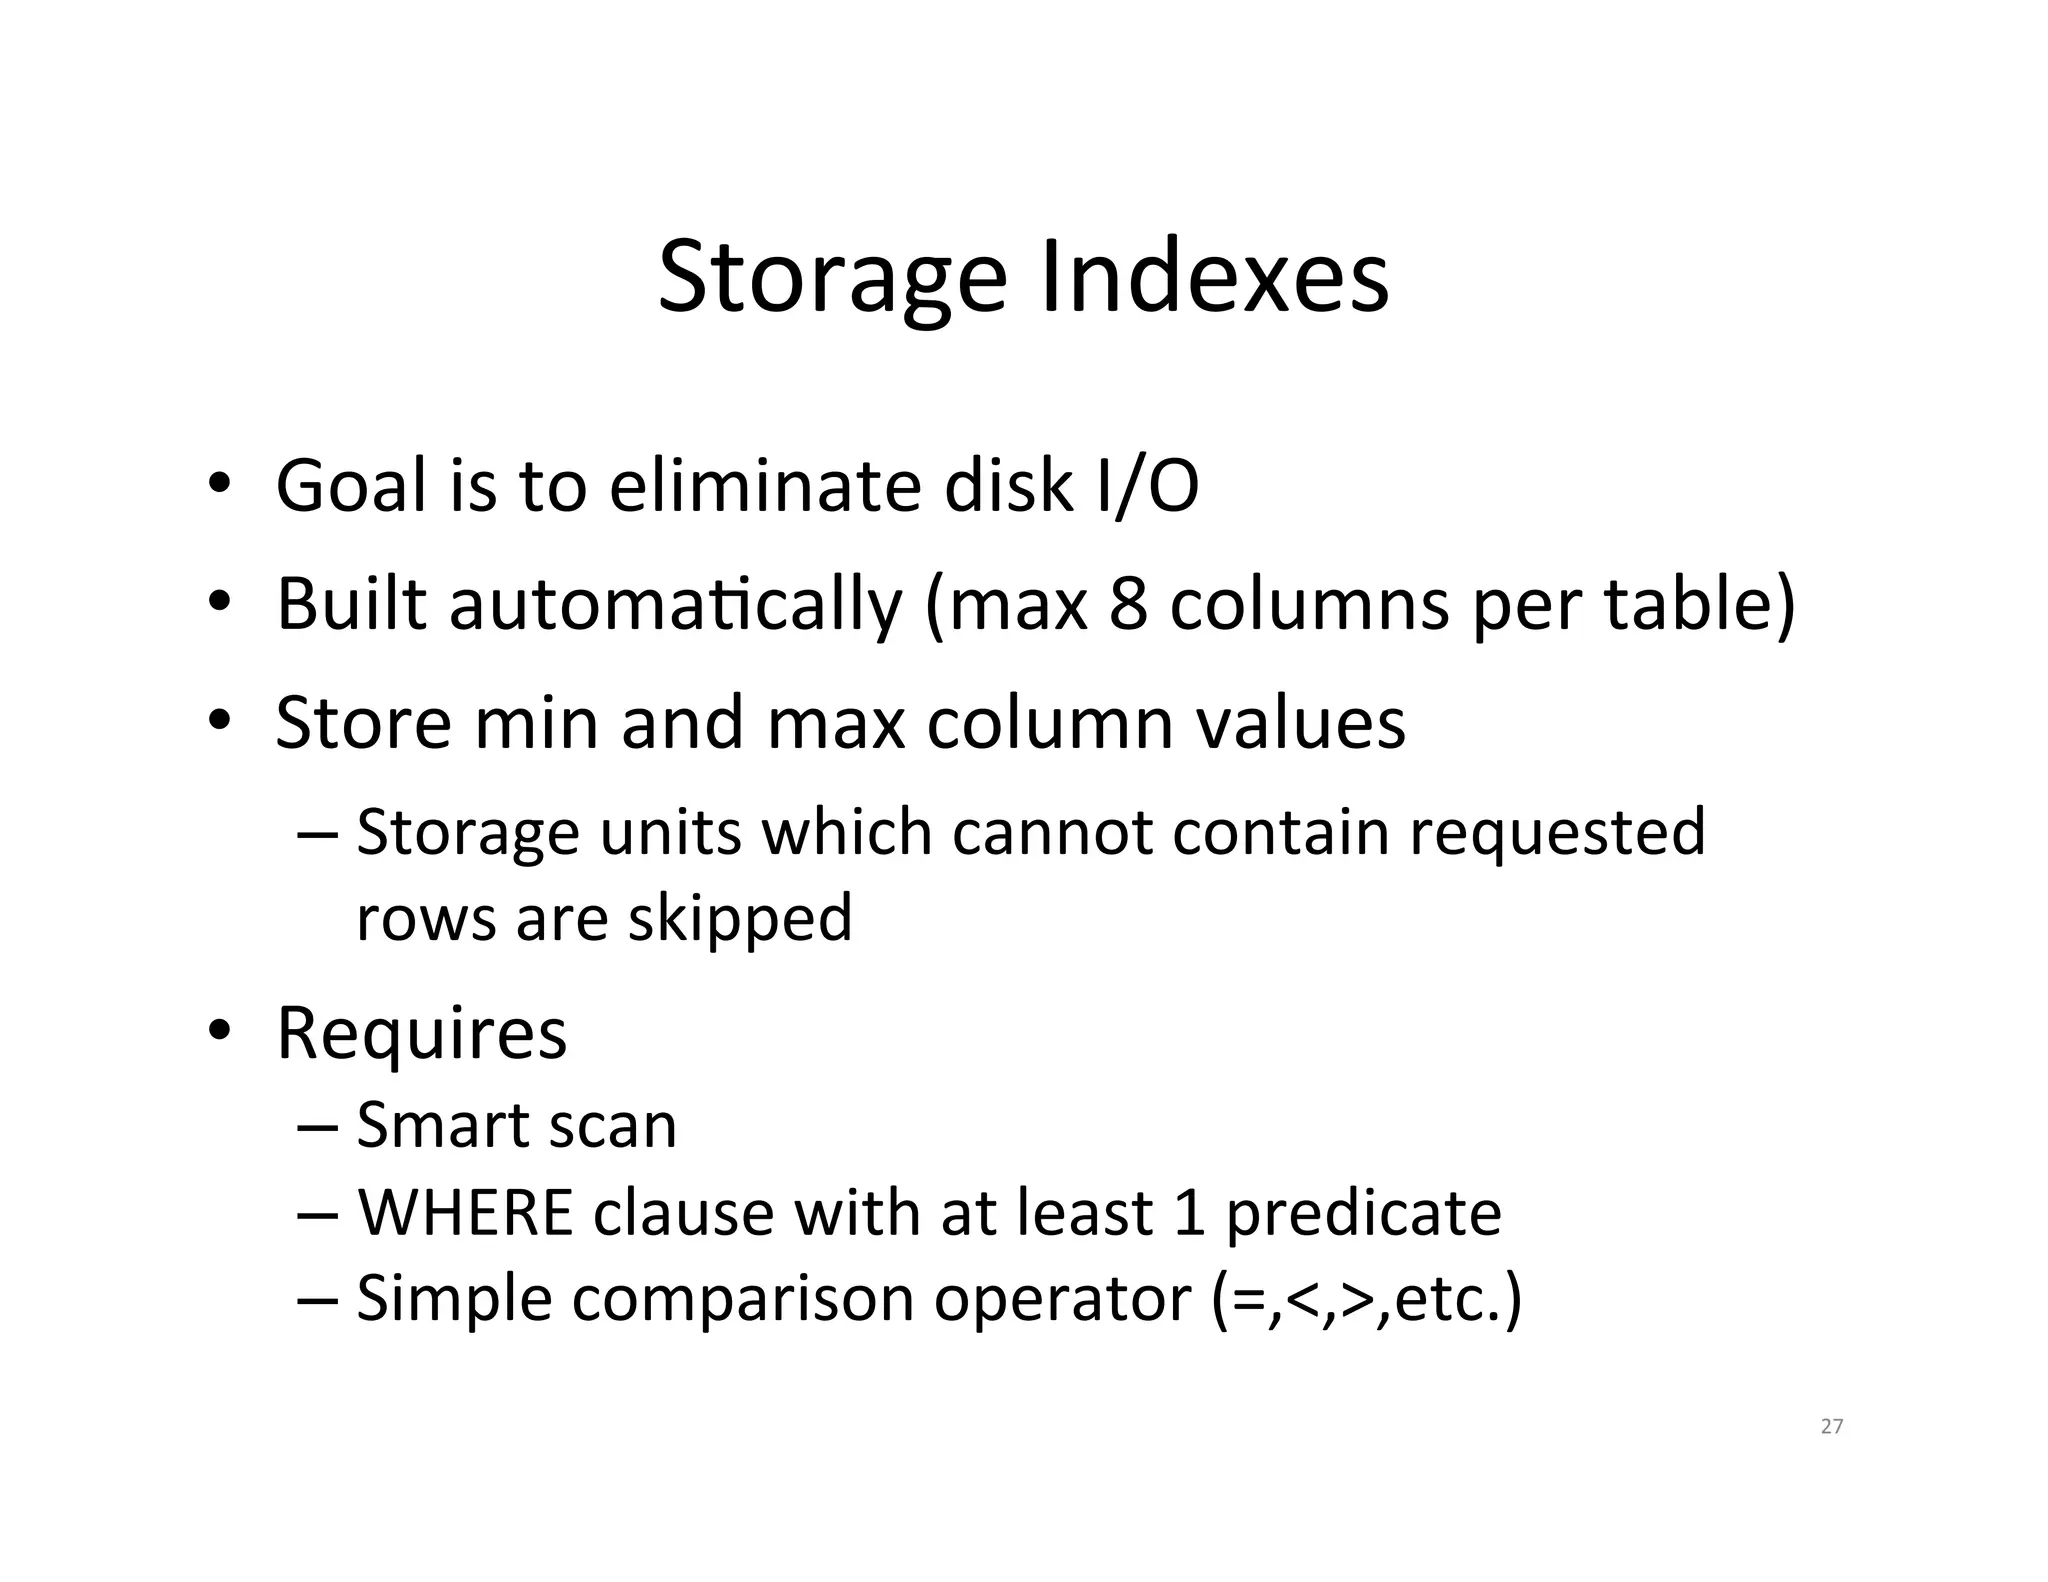
Storage Indexes • Goal is to eliminate disk I/O • Built automaJcally (max 8 columns per table) • Store min and max column values – Storage units which cannot contain requested rows are skipped • Requires – Smart scan – WHERE clause with at least 1 predicate – Simple comparison operator (=,<,>,etc.) 27
28.
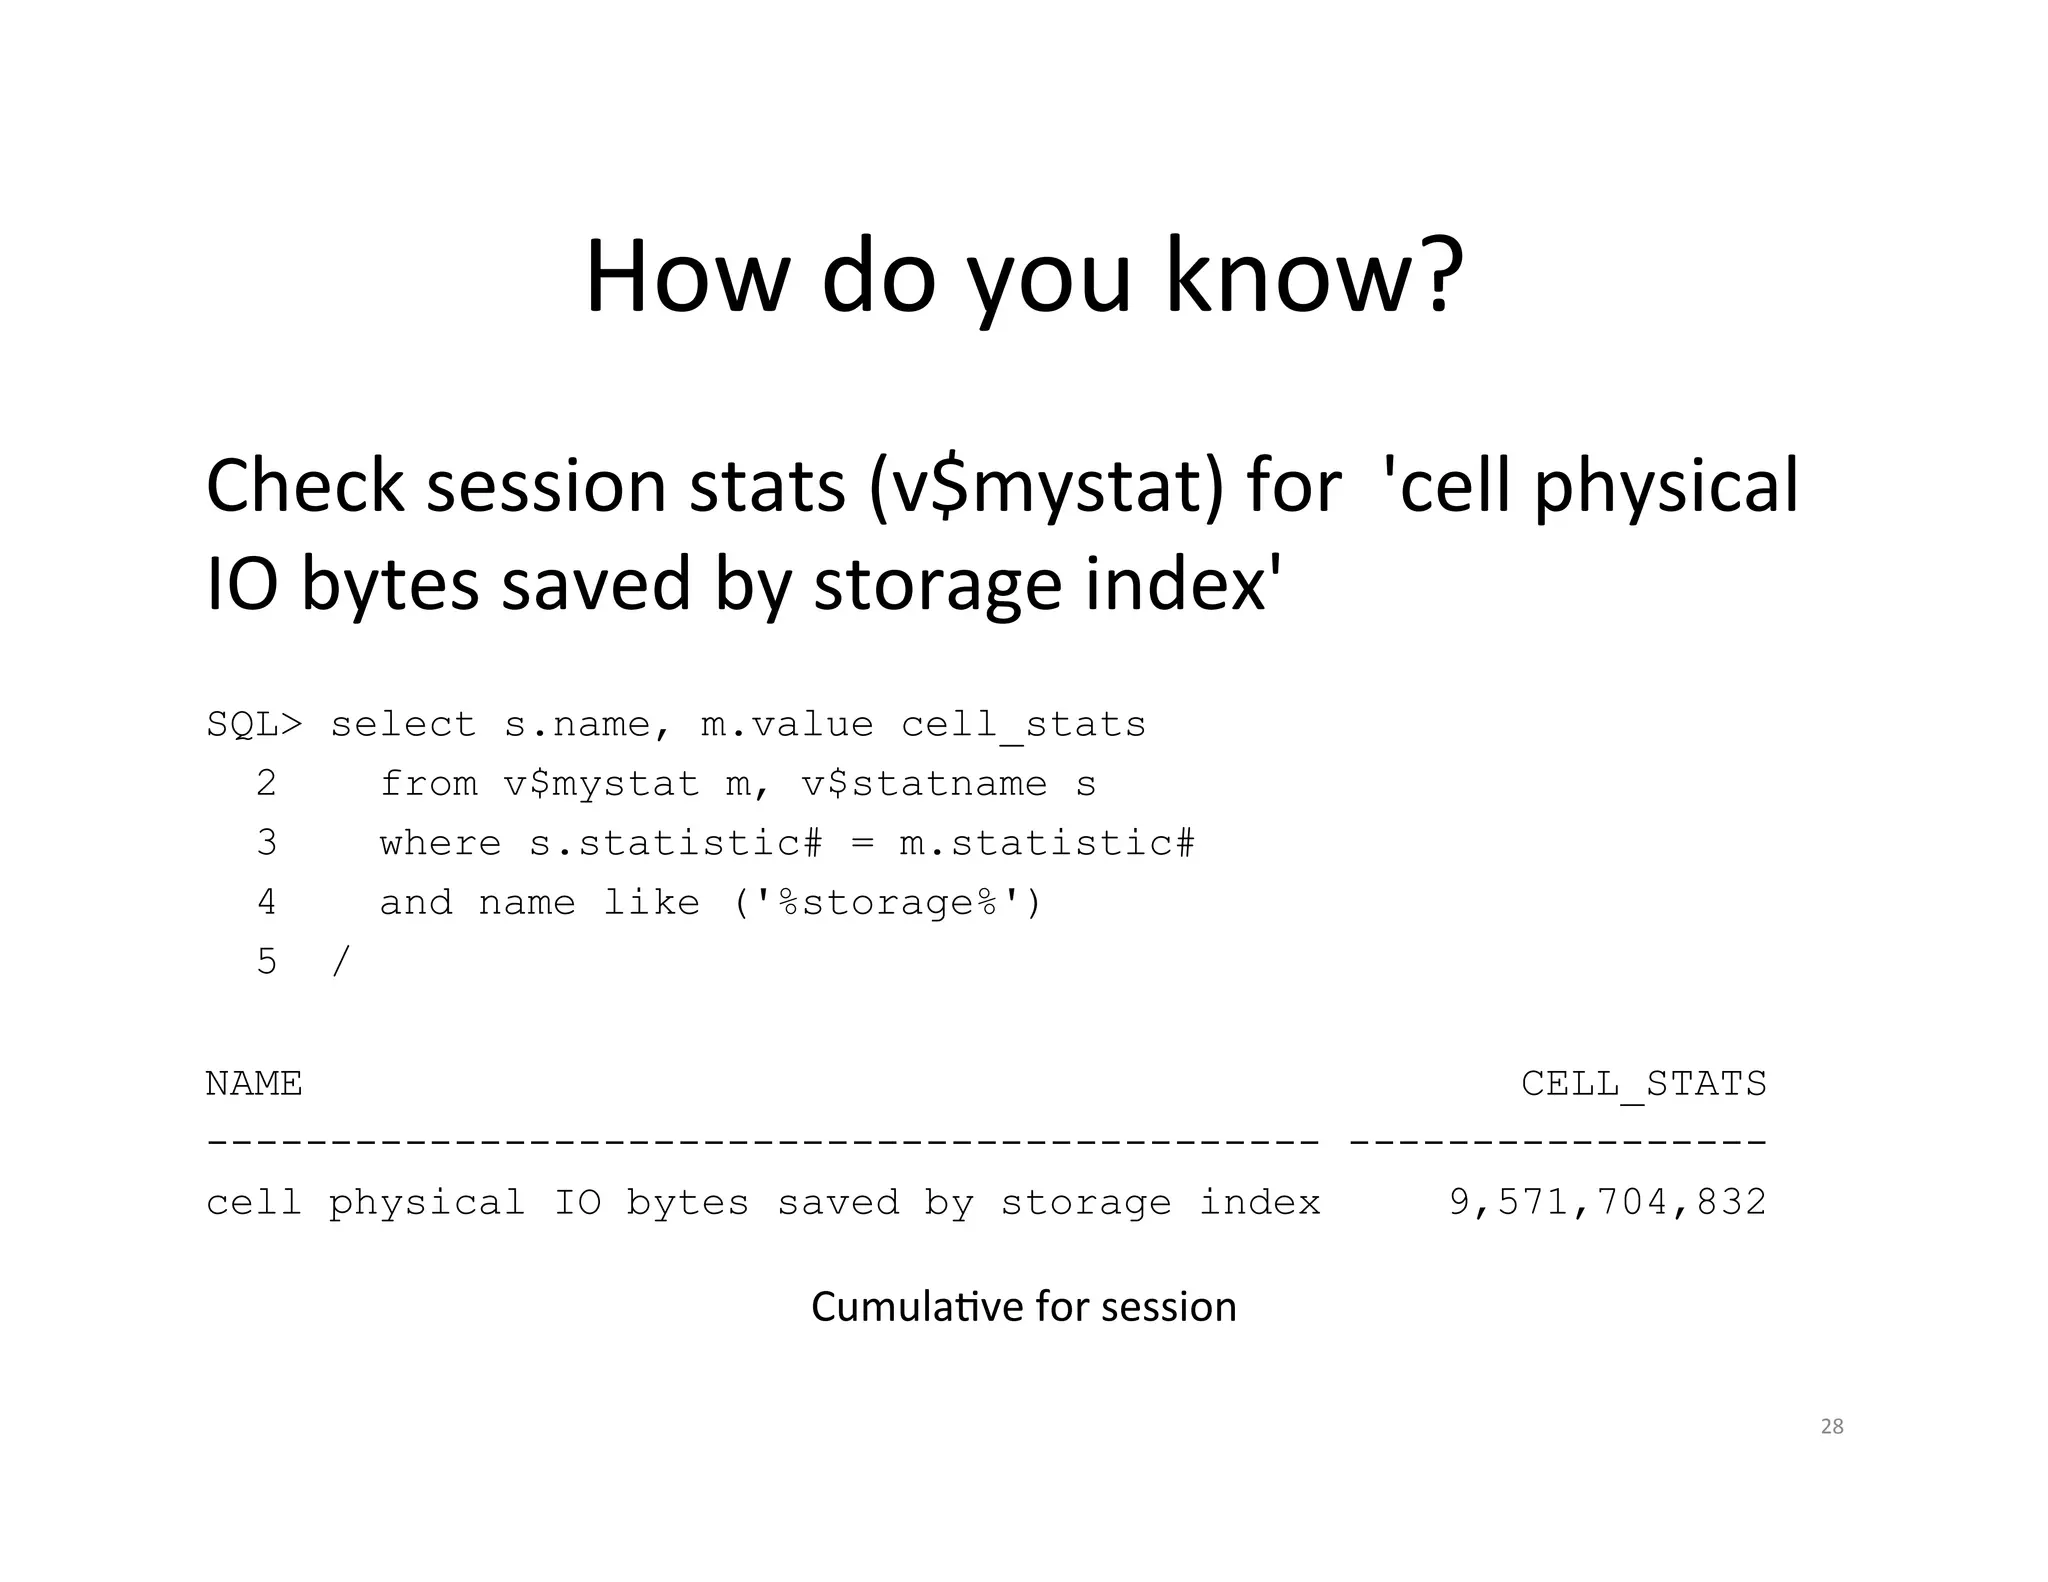
How do you know? Check session stats (v$mystat) for 'cell physical IO bytes saved by storage index' SQL> select s.name, m.value cell_stats 2 from v$mystat m, v$statname s 3 where s.statistic# = m.statistic# 4 and name like ('%storage%') 5 / NAME CELL_STATS --------------------------------------------- ----------------- cell physical IO bytes saved by storage index 9,571,704,832 CumulaJve for session 28
29.
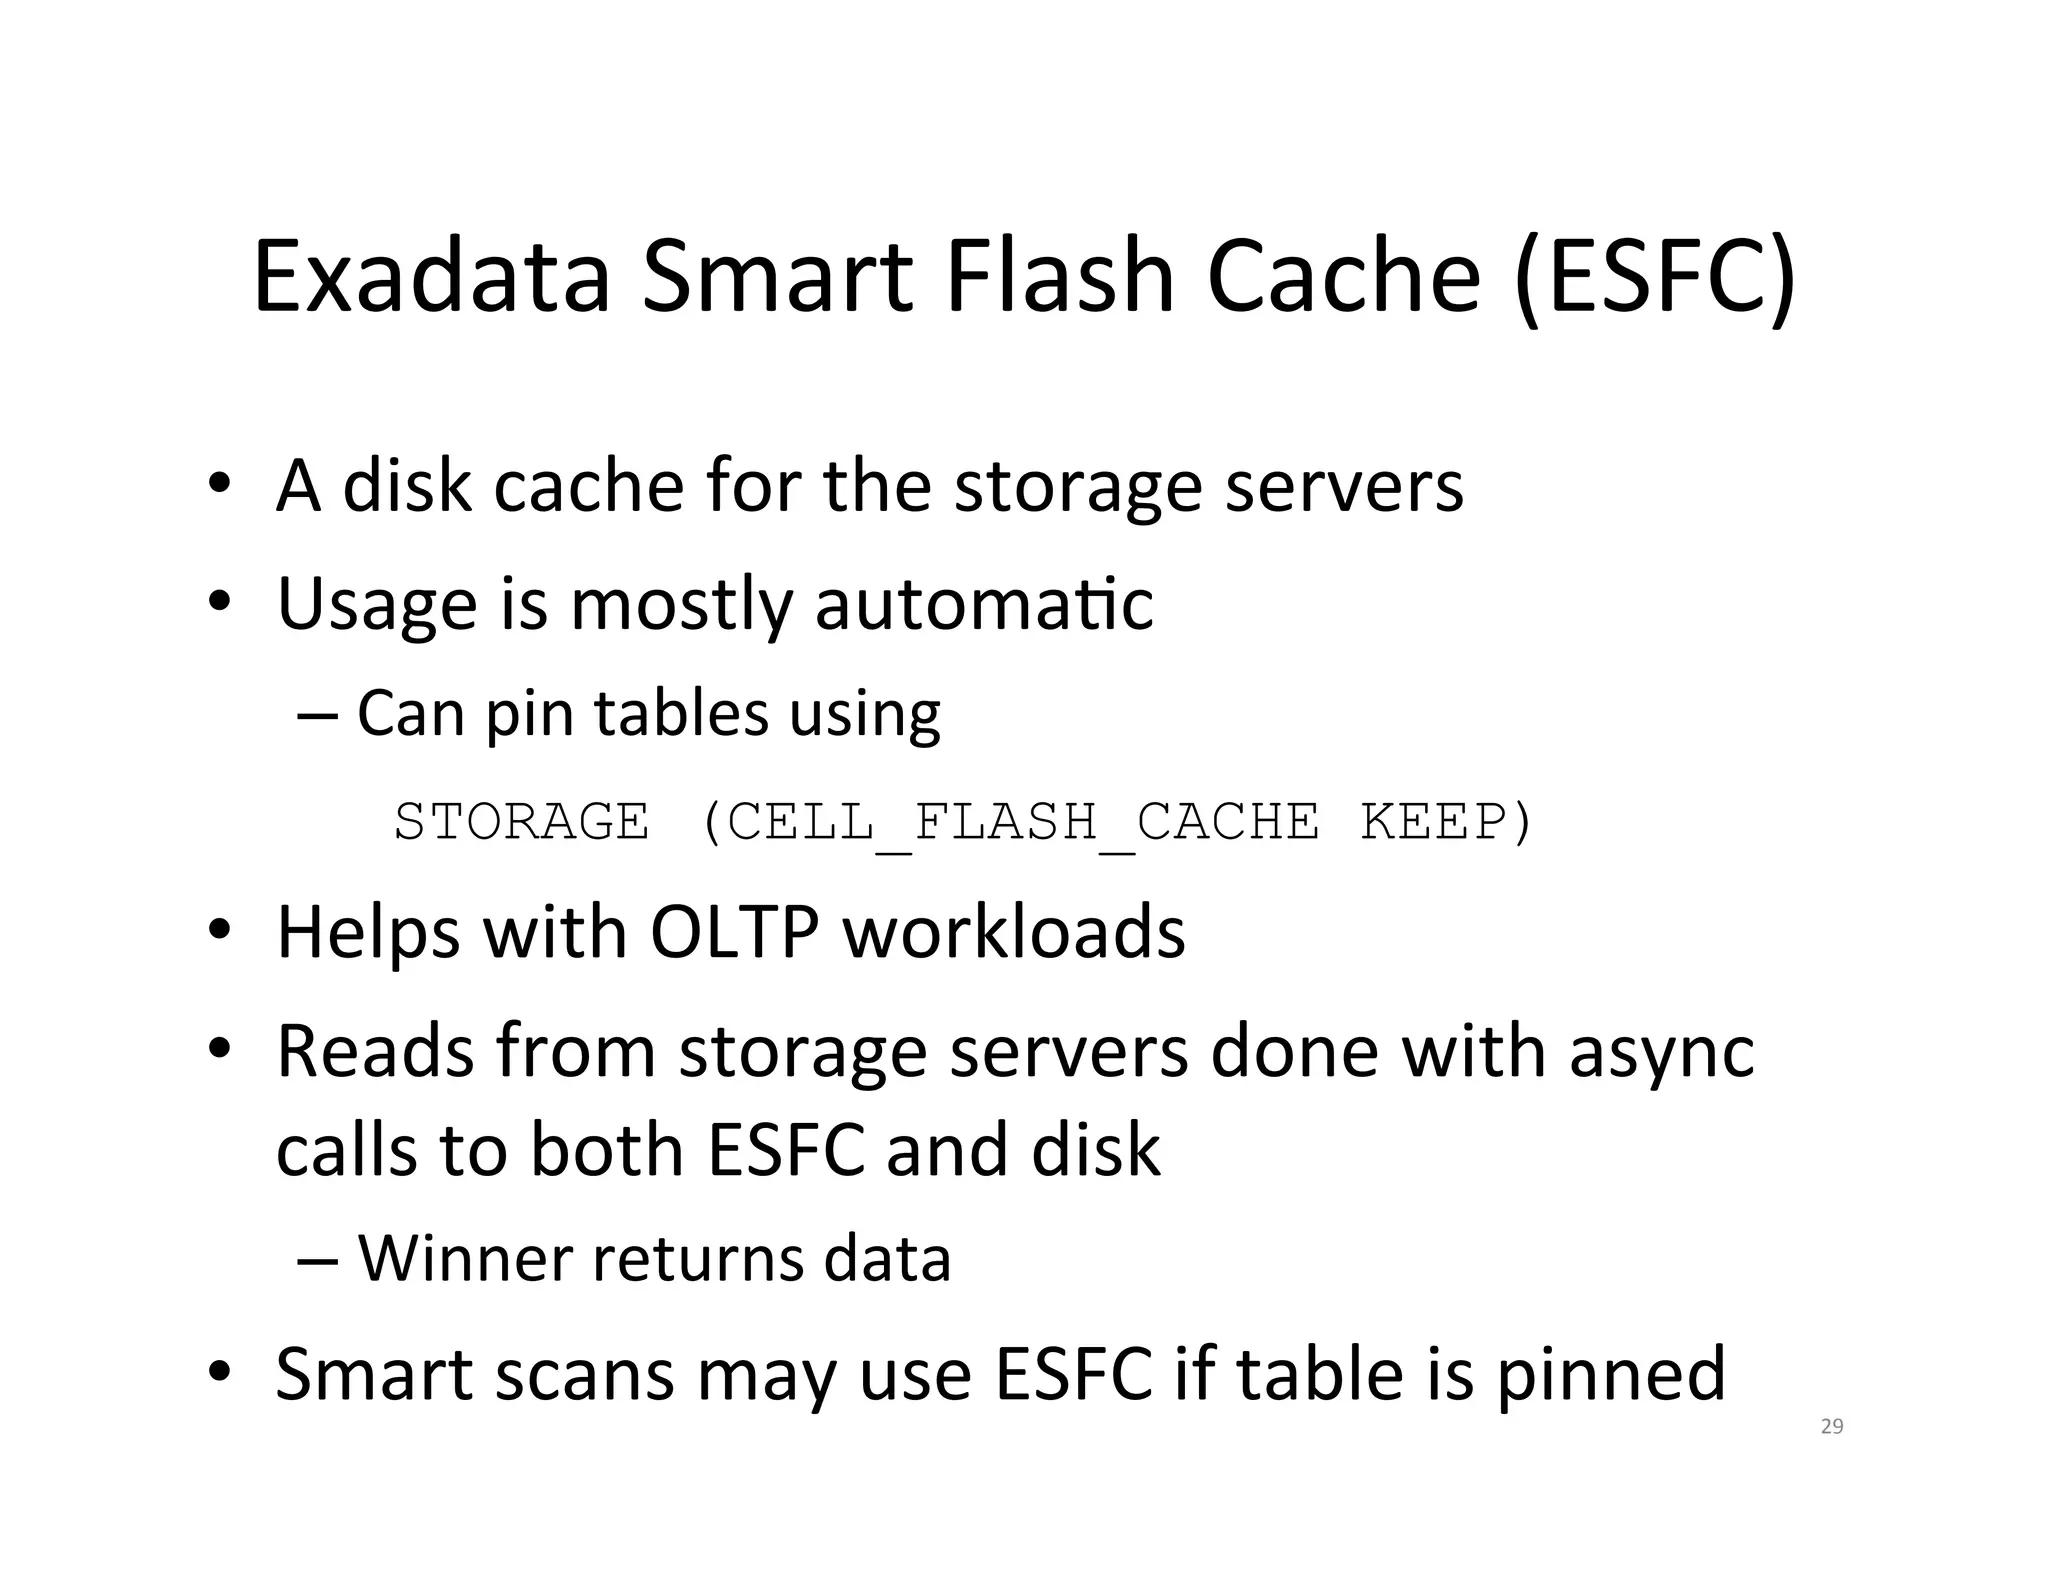
Exadata Smart Flash Cache (ESFC) • A disk cache for the storage servers • Usage is mostly automaJc – Can pin tables using STORAGE (CELL_FLASH_CACHE KEEP) • Helps with OLTP workloads • Reads from storage servers done with async calls to both ESFC and disk – Winner returns data • Smart scans may use ESFC if table is pinned 29
30.
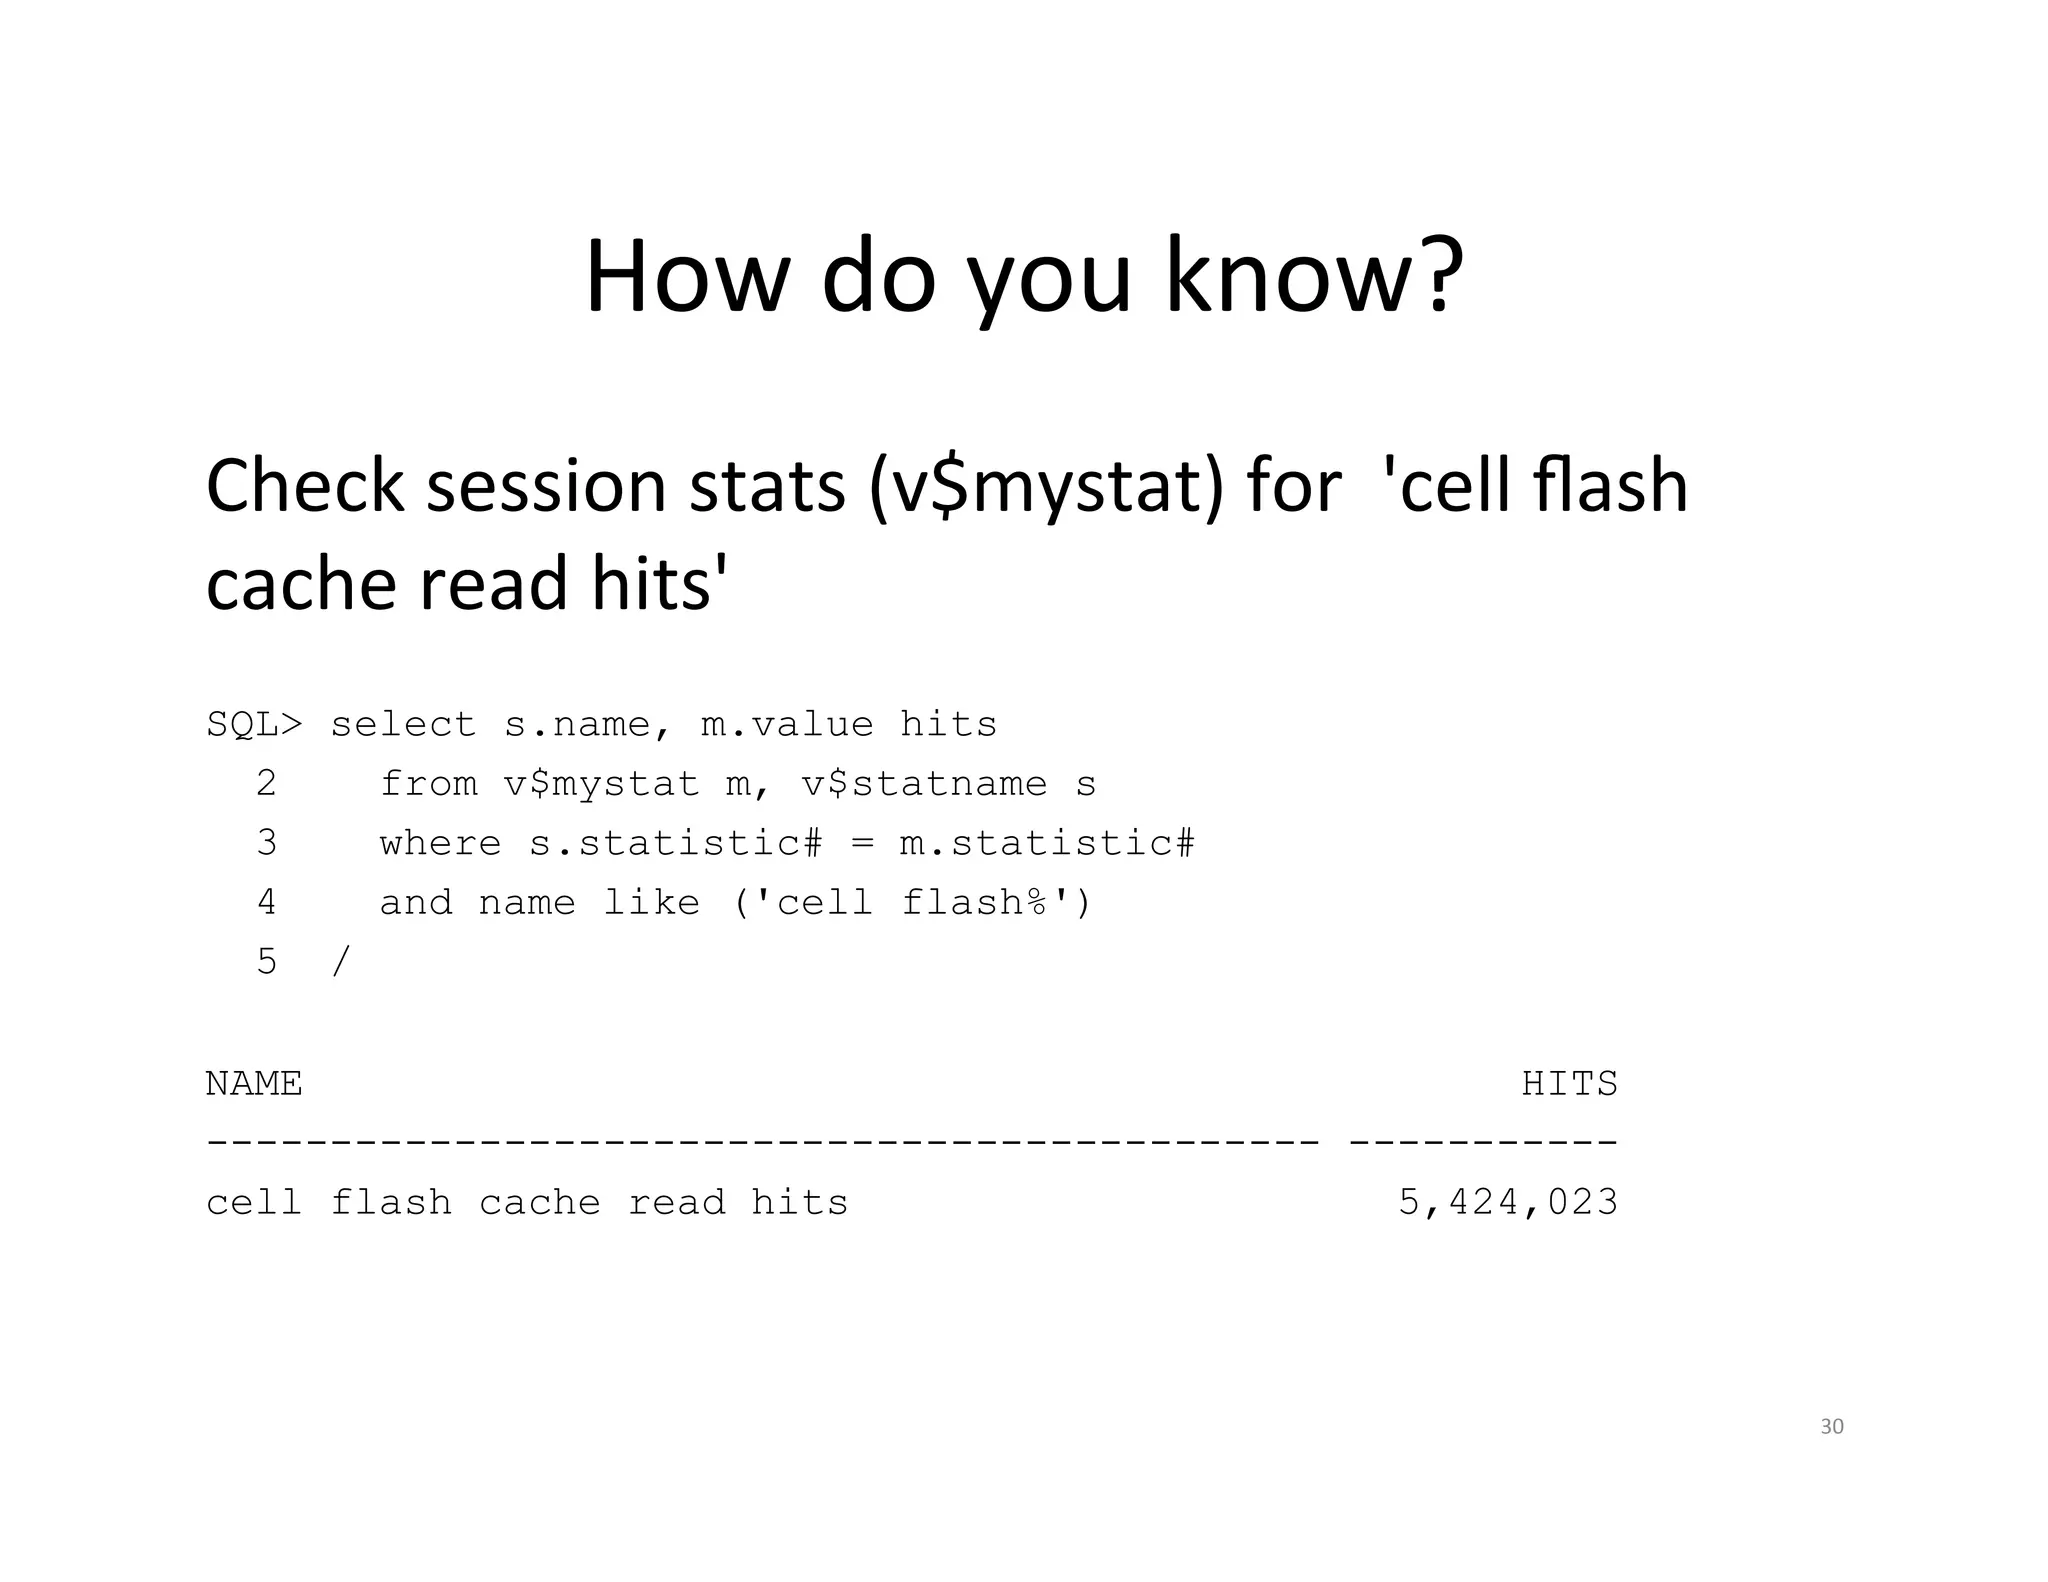
How do you know? Check session stats (v$mystat) for 'cell flash cache read hits' SQL> select s.name, m.value hits 2 from v$mystat m, v$statname s 3 where s.statistic# = m.statistic# 4 and name like ('cell flash%') 5 / NAME HITS --------------------------------------------- ----------- cell flash cache read hits 5,424,023 30
31.
Of course, there are also big wins to be gained with parallelism and parJJoning. 31
32.
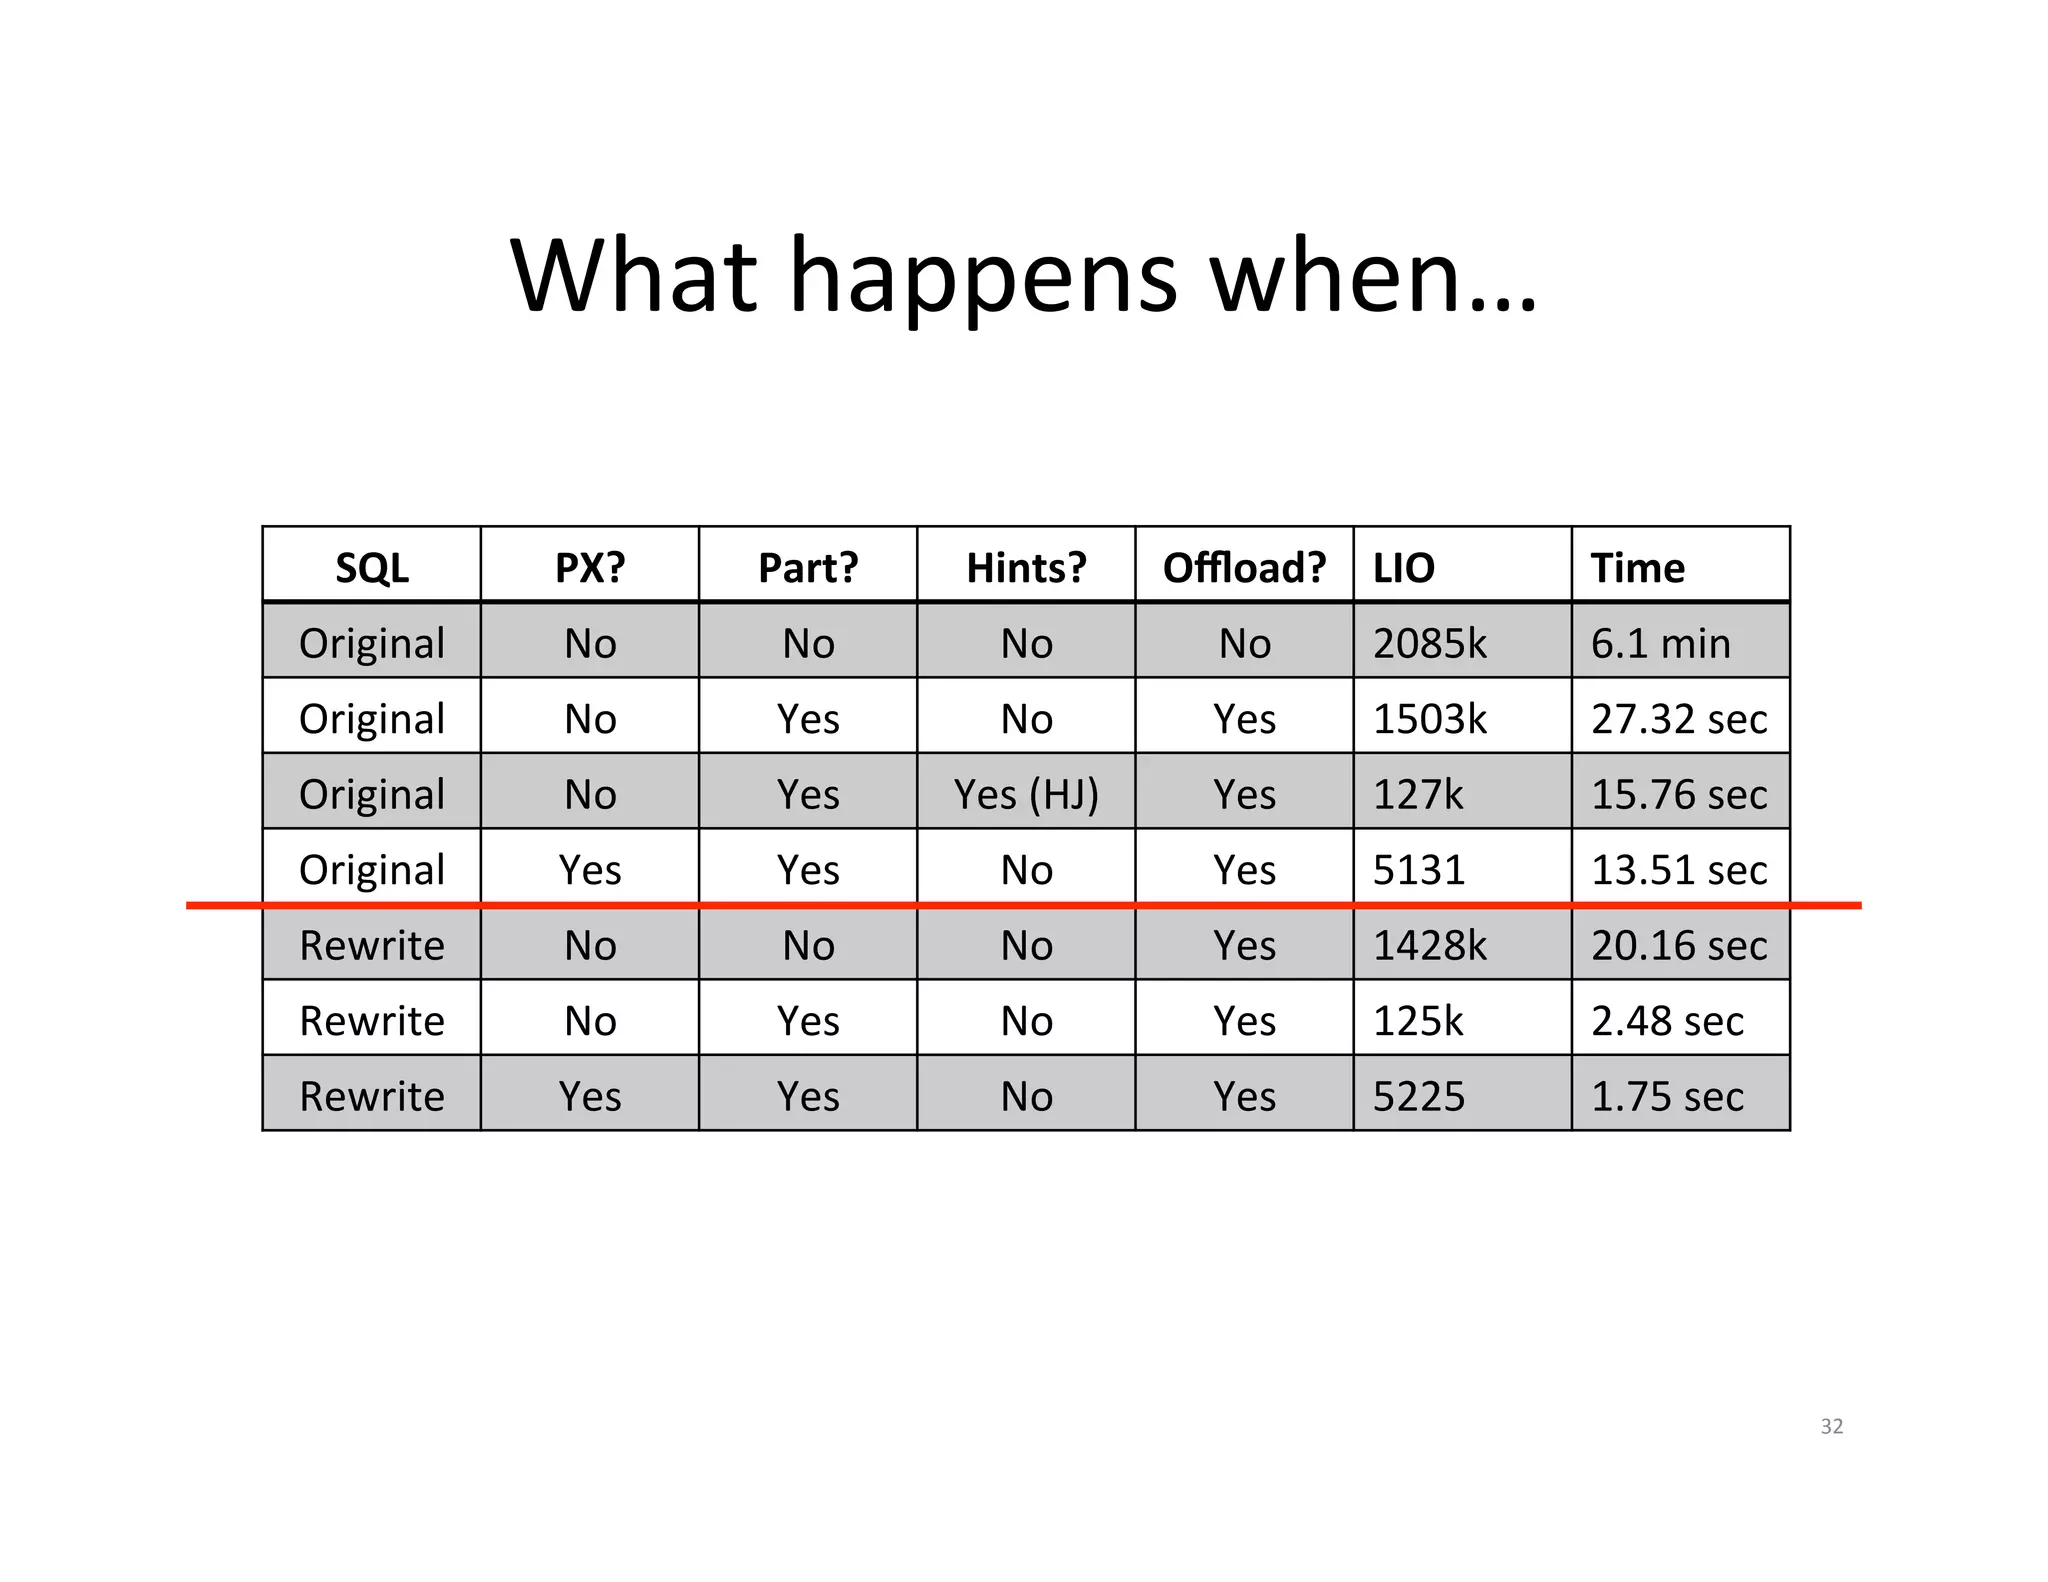
What happens when… SQL PX? Part? Hints? Offload? LIO Time Original No No No No 2085k 6.1 min Original No Yes No Yes 1503k 27.32 sec Original No Yes Yes (HJ) Yes 127k 15.76 sec Original Yes Yes No Yes 5131 13.51 sec Rewrite No No No Yes 1428k 20.16 sec Rewrite No Yes No Yes 125k 2.48 sec Rewrite Yes Yes No Yes 5225 1.75 sec 32
33.
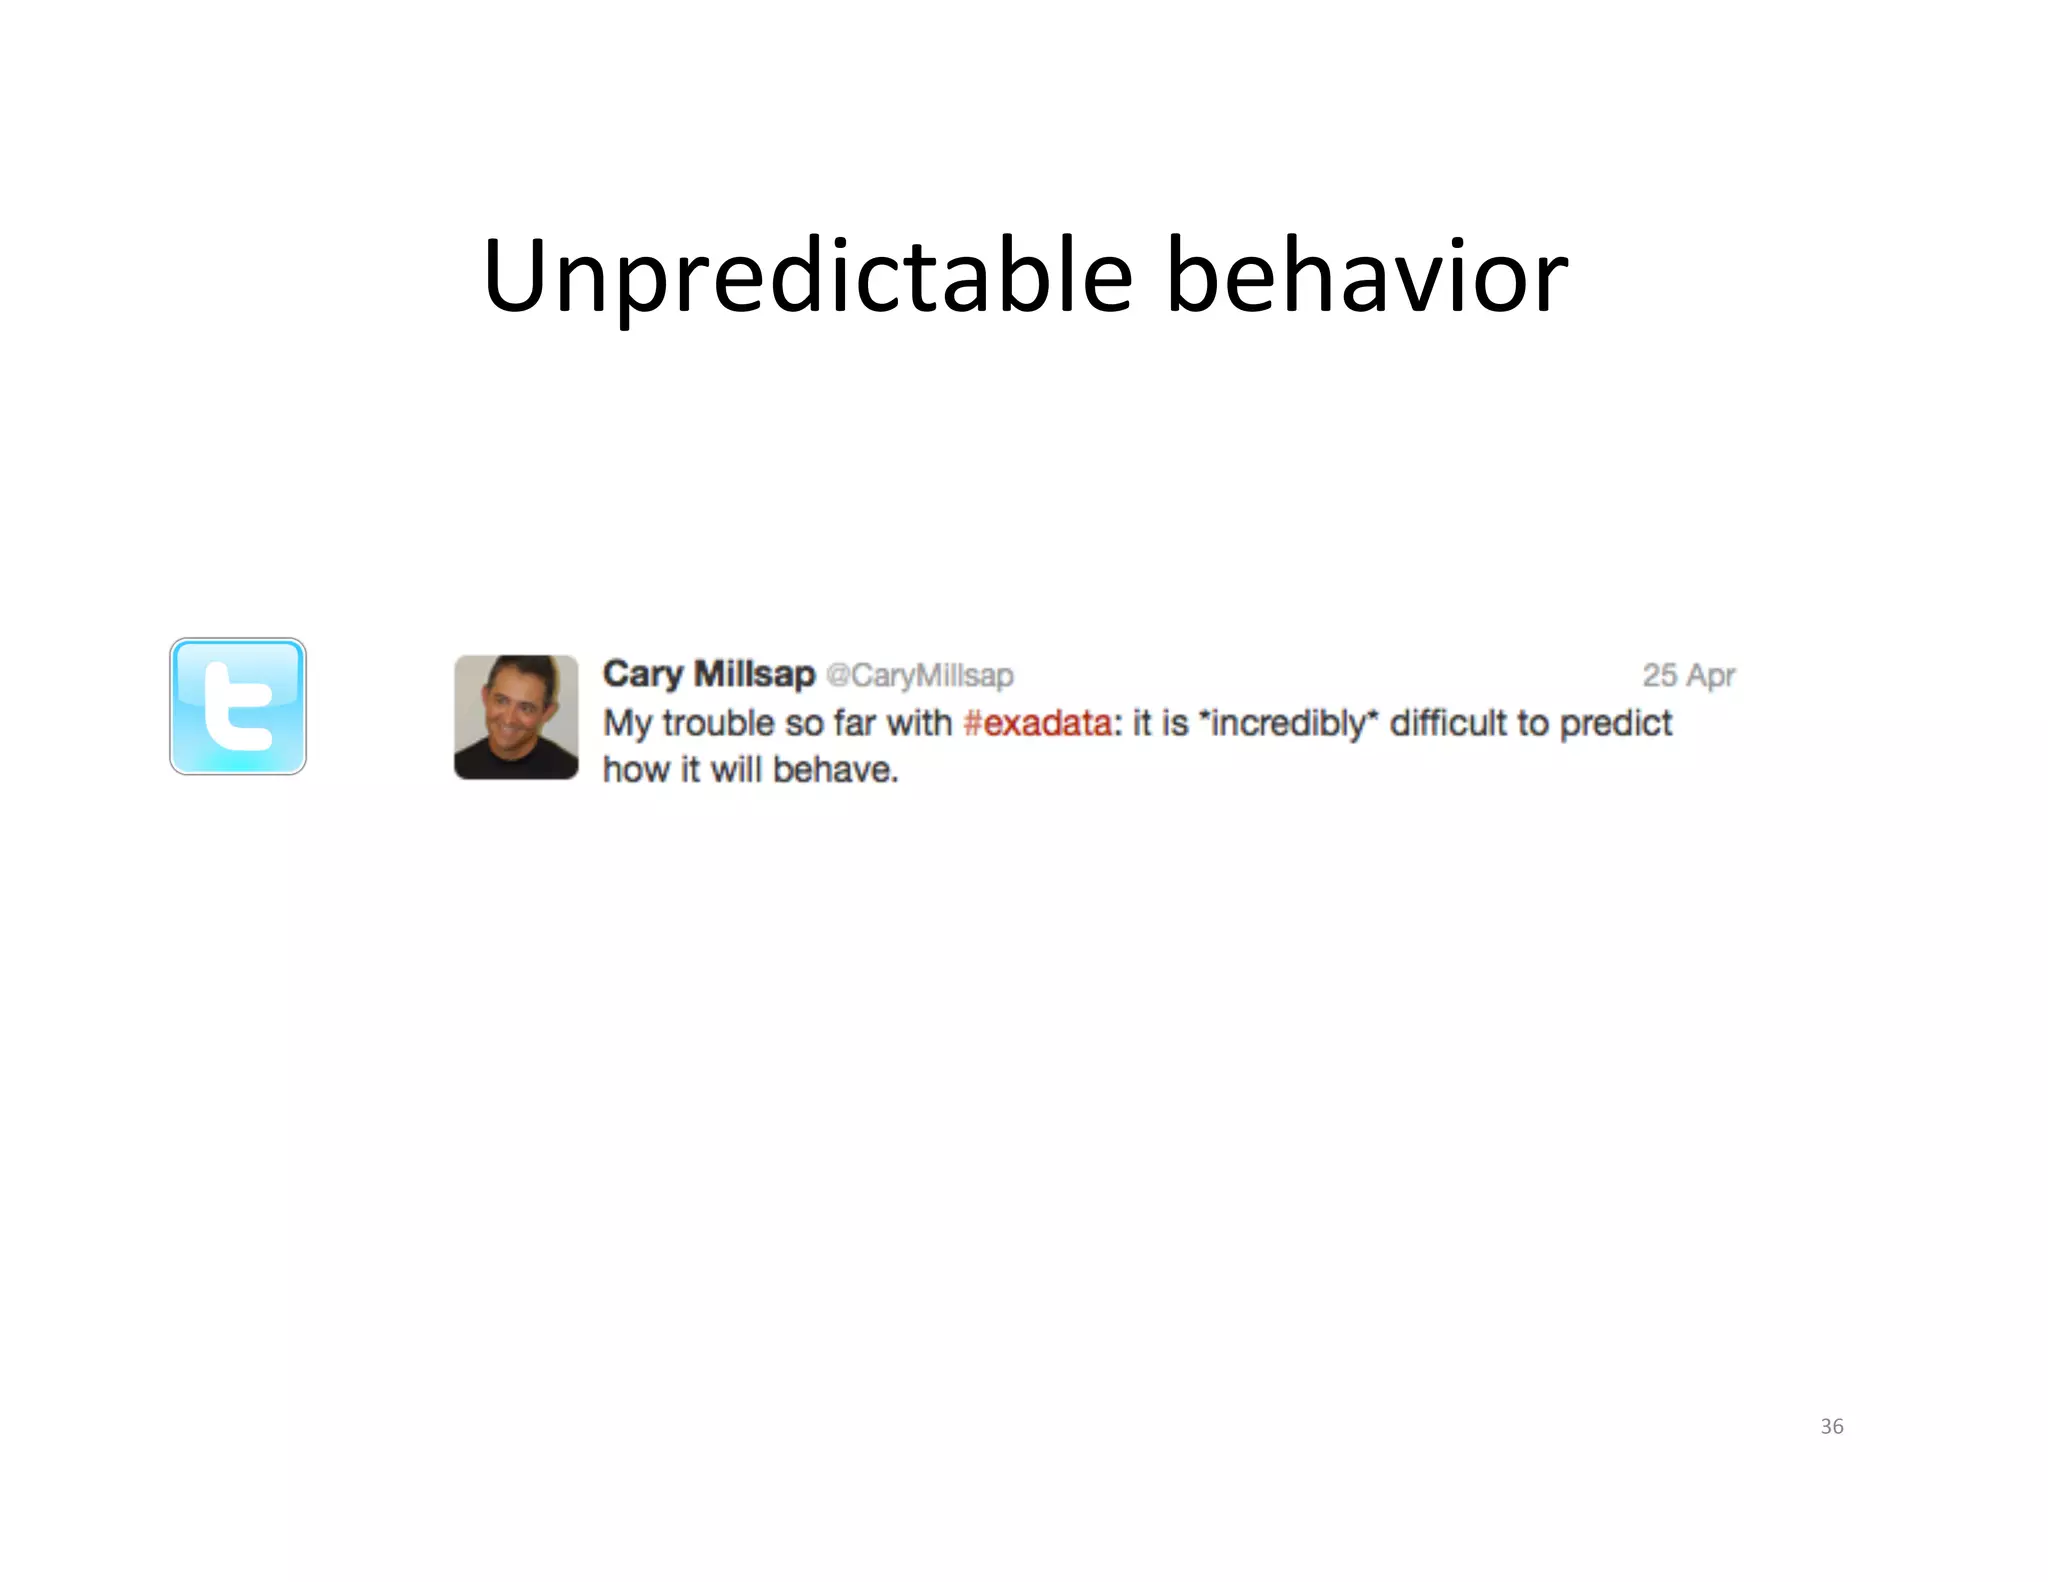
These features are great, but how do you ensure they kick in? …you can't guarantee they will 33
34.
Impacts of RewriJng SQL Descrip?on Before ACer % Savings BI Report 1 hour 65 sec 98.33% Job P -‐ SELECT 2 hours 15 sec 99.79% Job P -‐ INSERT 5 hours 60 sec 99.67% Job P -‐ DELETE 1.5 hours 30 sec 99.17% Savings achieved from rewrites not from Exadata. 34
Did I menJon… the opJmizer doesn't know about Exadata features. 37
38.
Even when smart scans are possible, they may not happen. Read consistency, delayed block cleanout, chained rows can interrupt smart scans. 38
39.
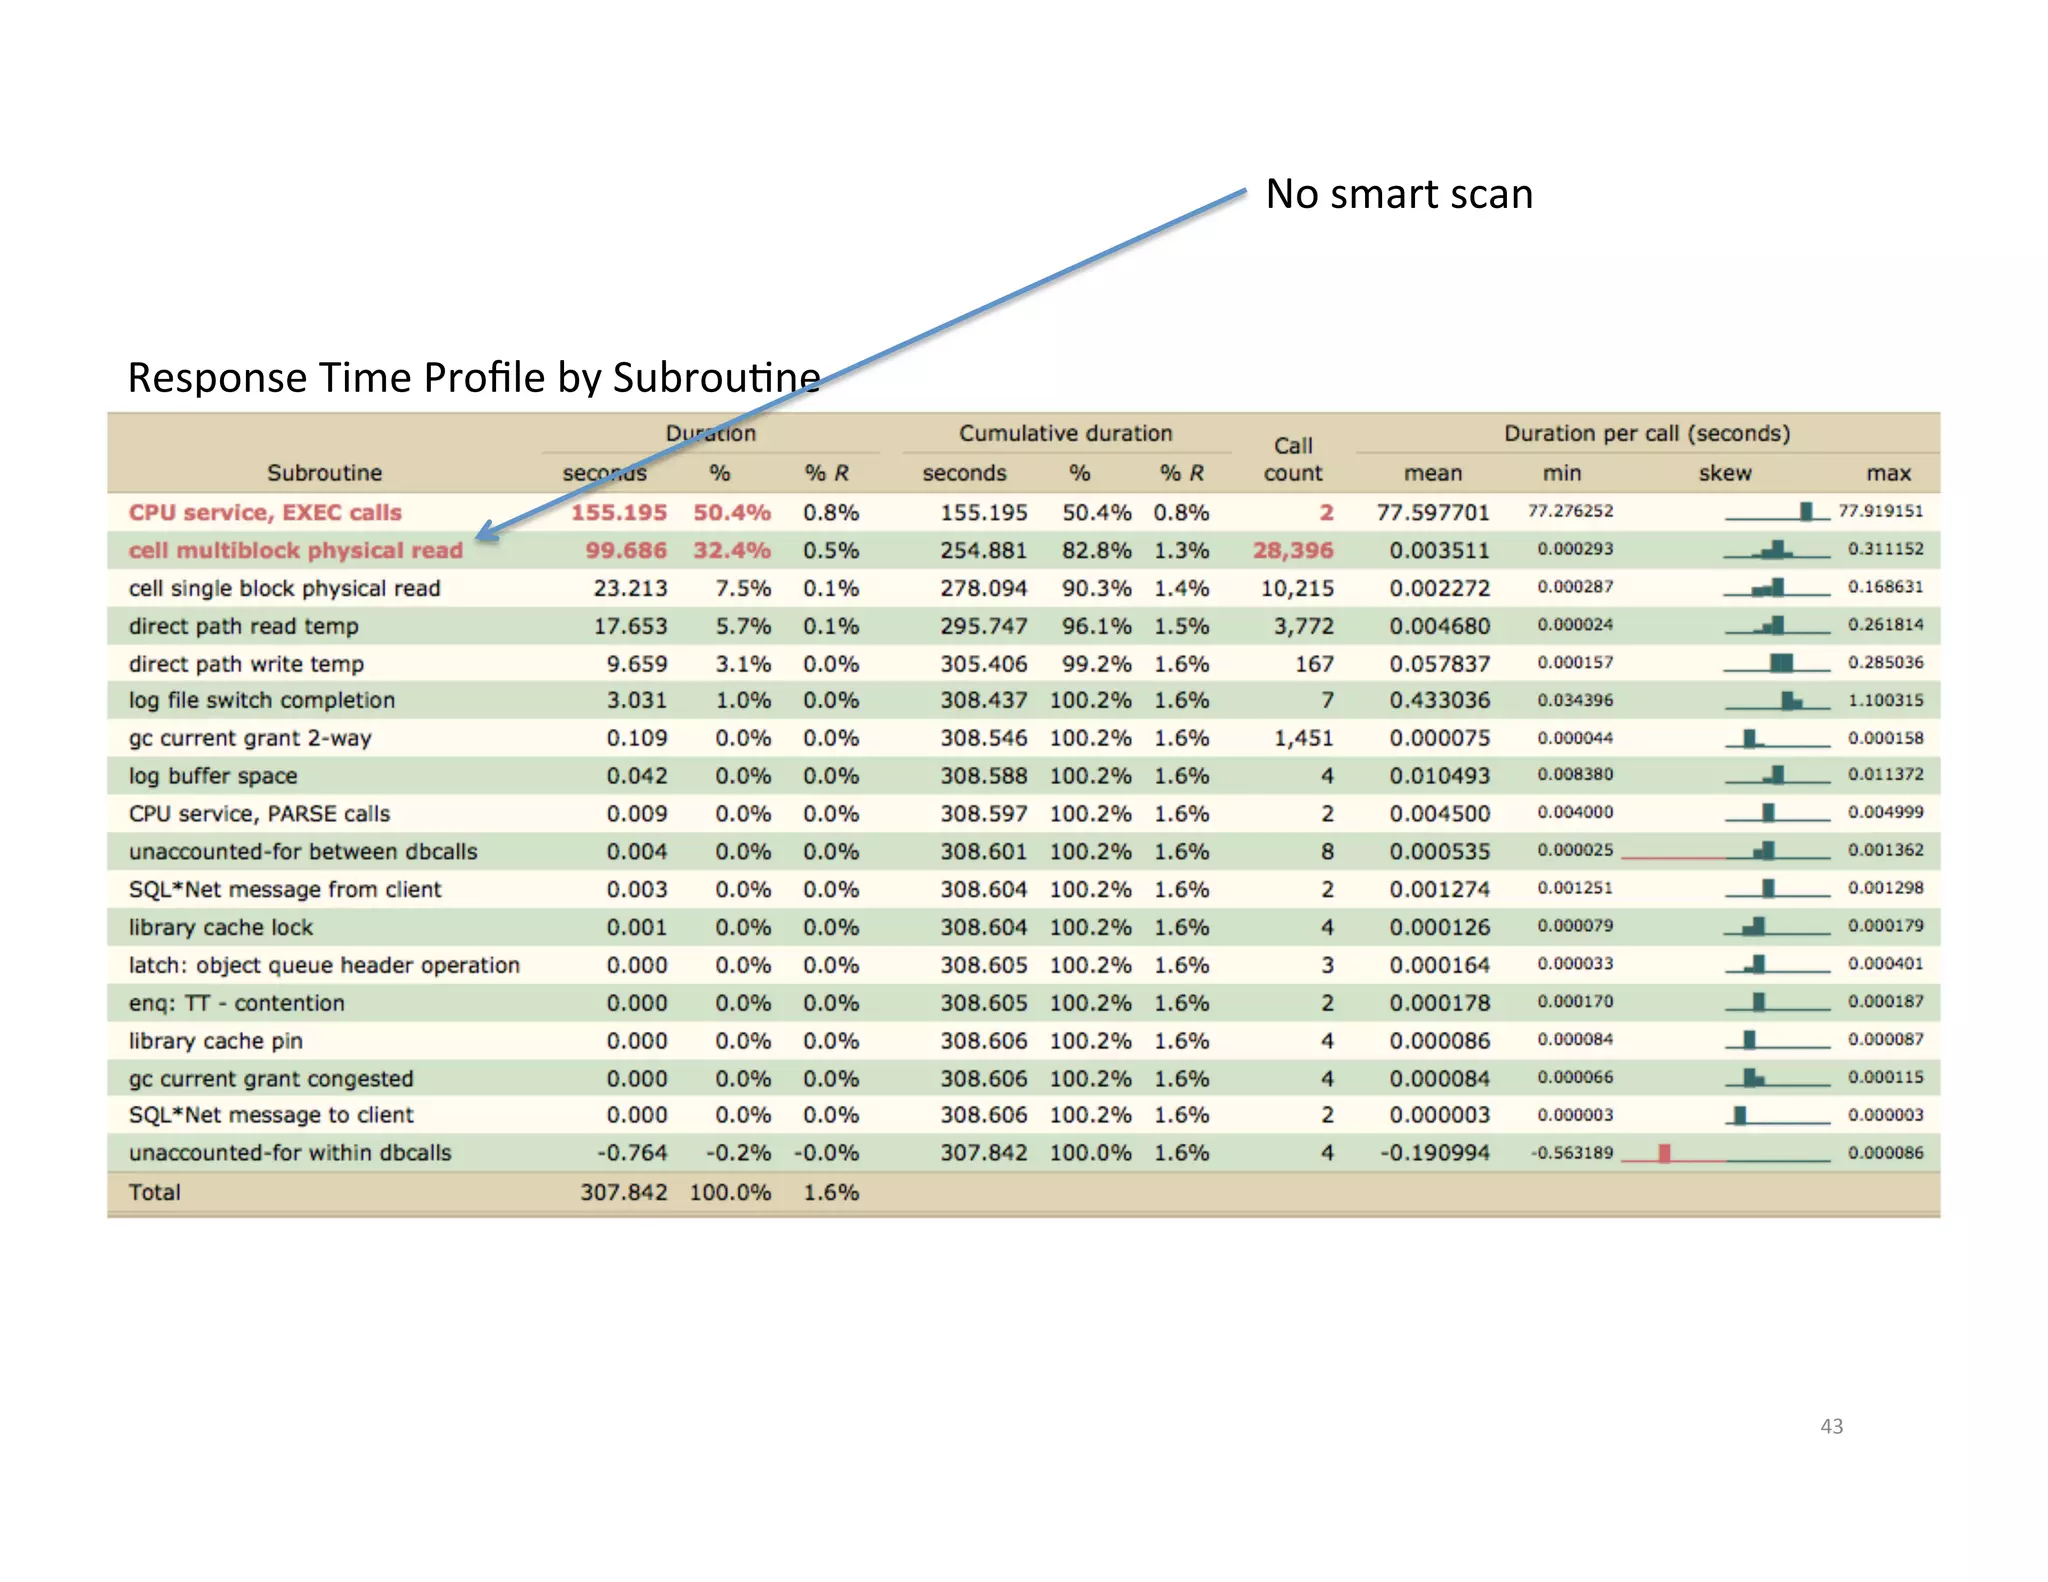
In mixed workload environments, the opJmizer tends to pick index-‐ oriented plans over scan-‐based plans. Even though scan-‐based plans are o6en much faster. 39
40.
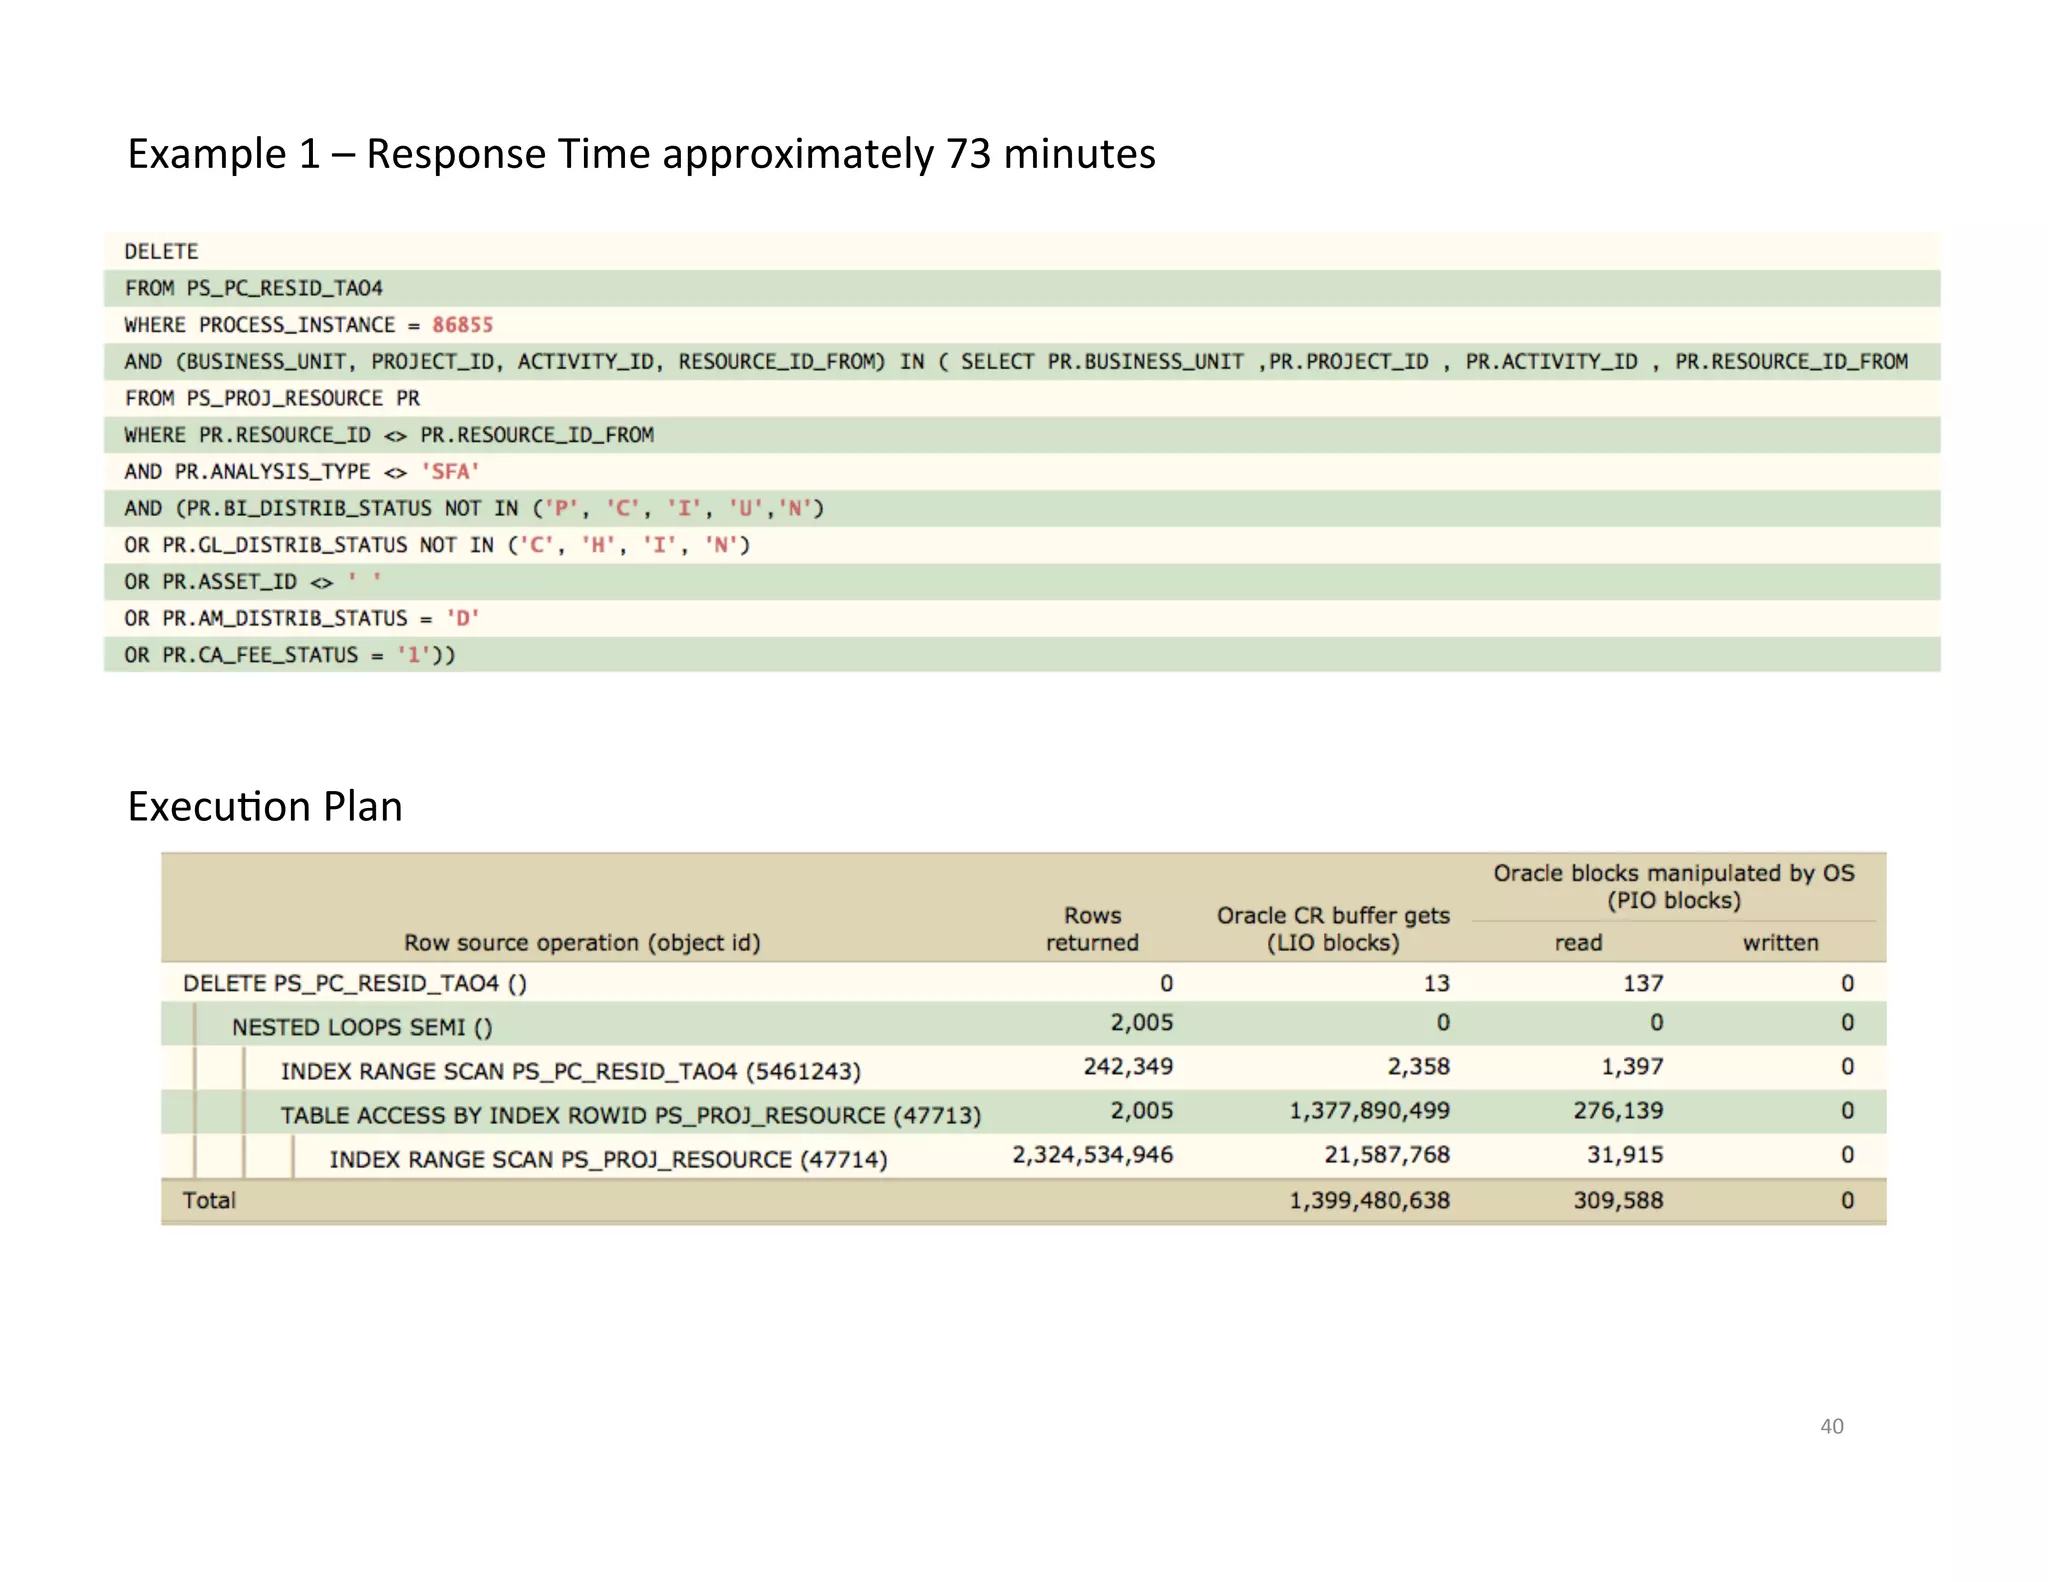
Example 1 – Response Time approximately 73 minutes ExecuJon Plan 40
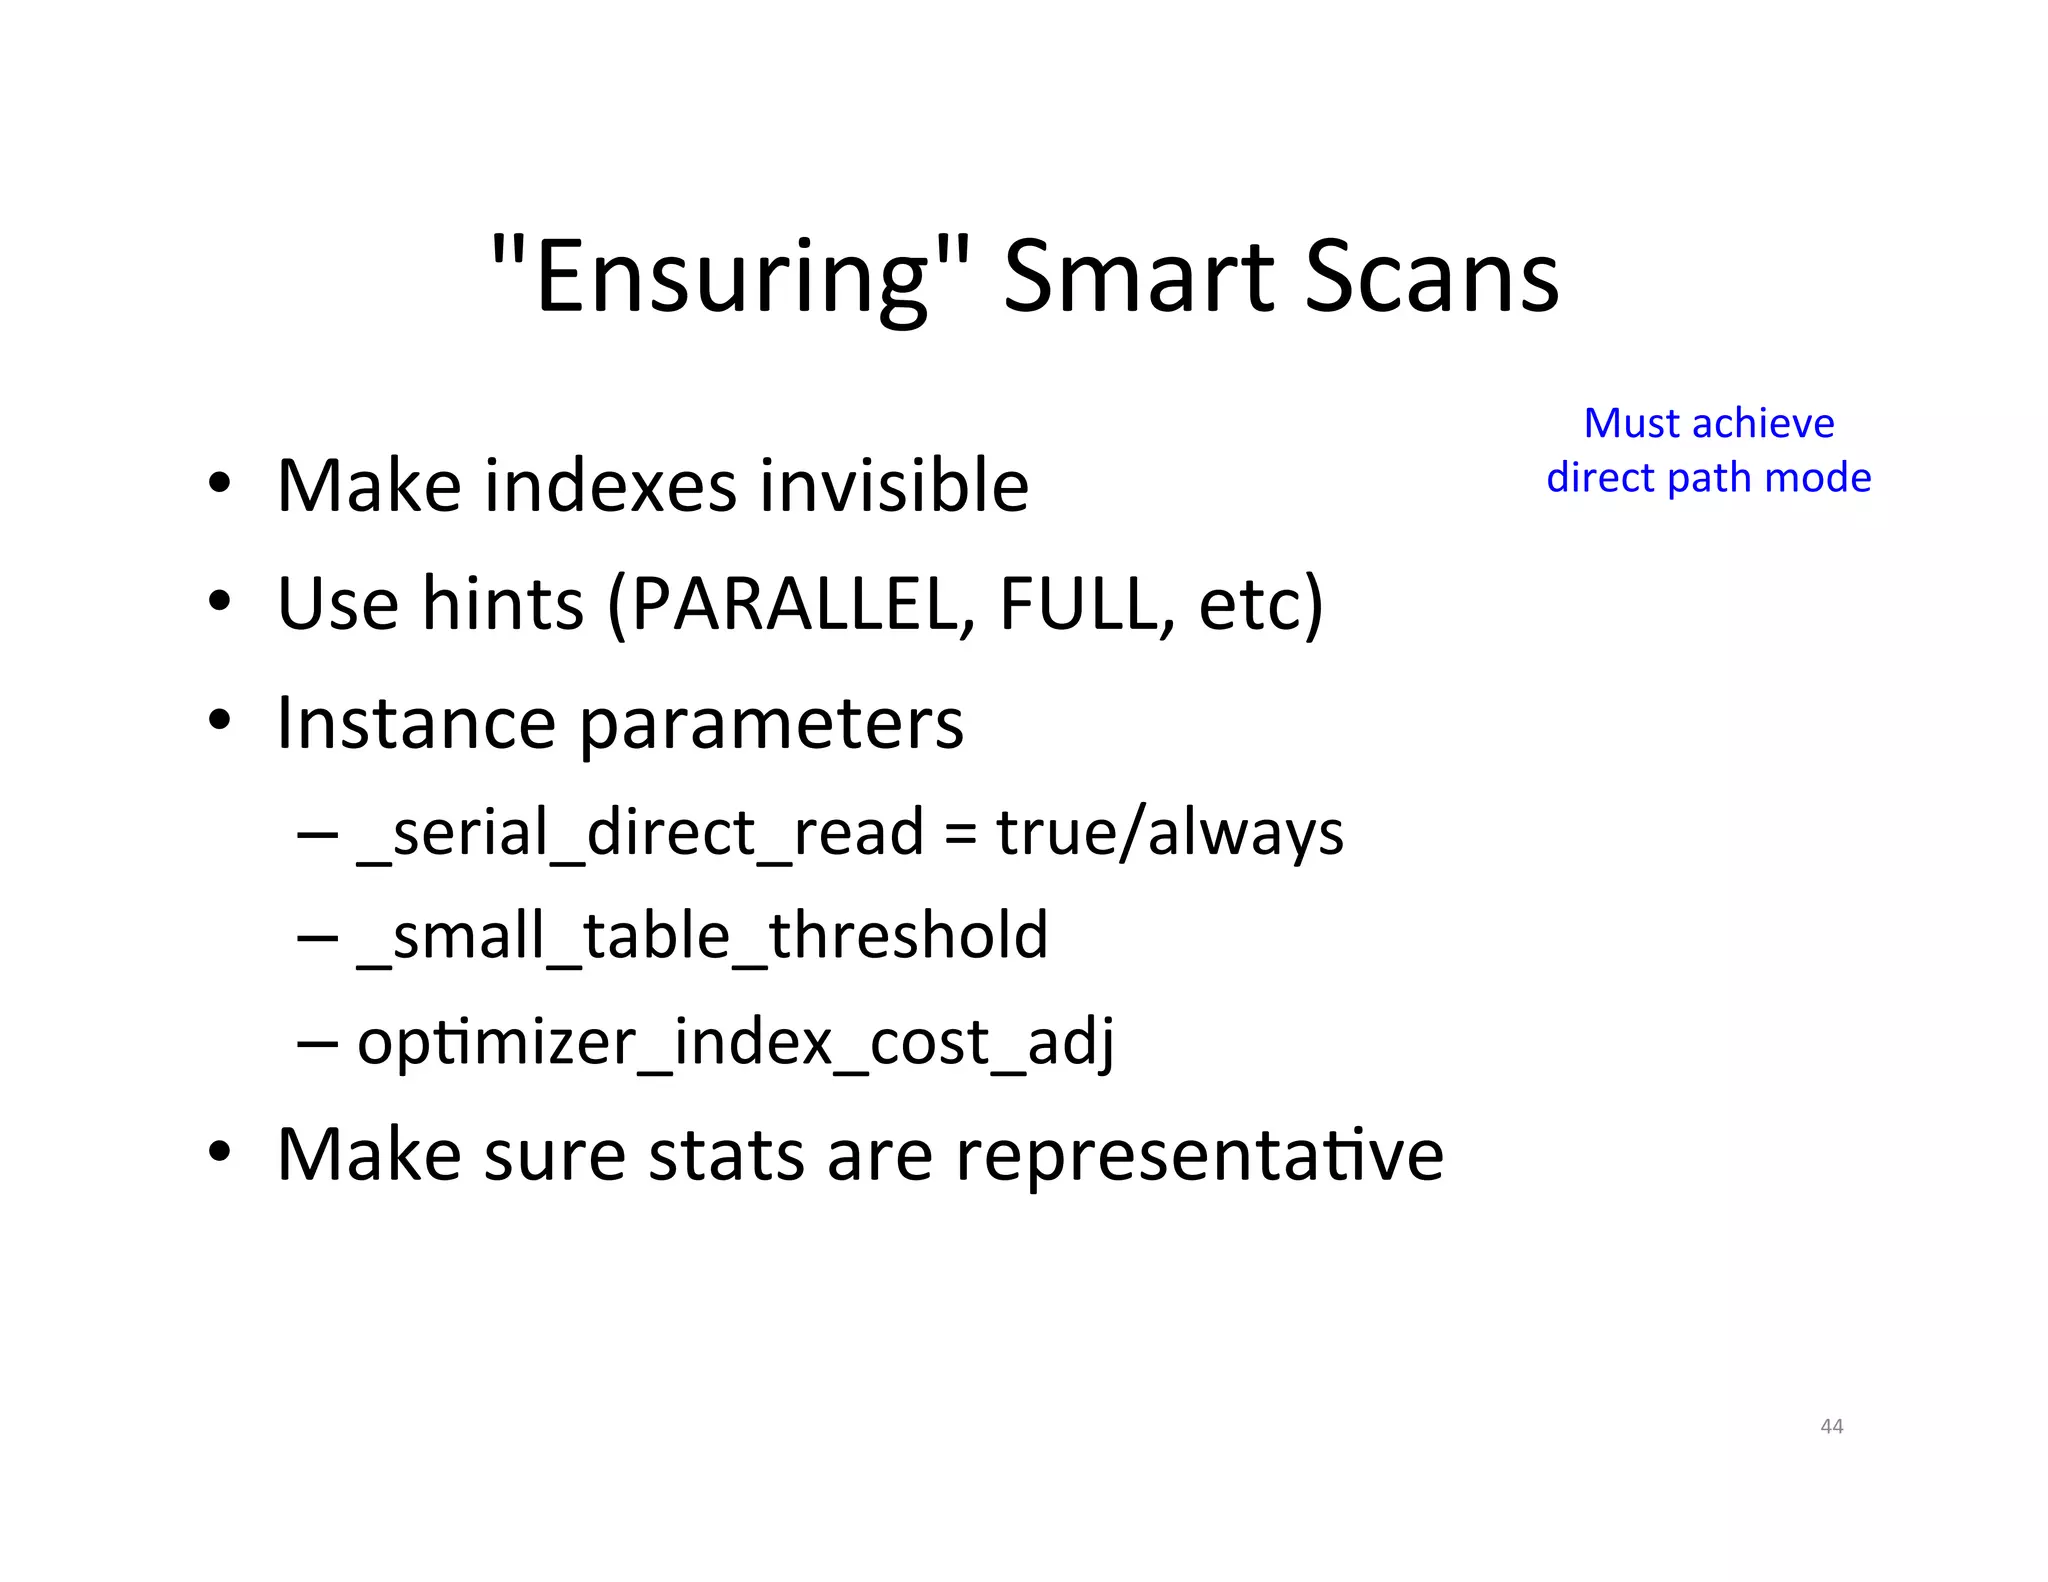
"Ensuring" Smart Scans Must achieve • Make indexes invisible direct path mode • Use hints (PARALLEL, FULL, etc) • Instance parameters – _serial_direct_read = true/always – _small_table_threshold – opJmizer_index_cost_adj • Make sure stats are representaJve 44
45.
SomeJmes the problem is due to a long-‐standing, but undetected, issue. StaJsJcs collecJon using esJmate_percent=>30 StaJsJcs collecJon using esJmate_percent=>dbms_stats.auto_sample_size 45
46.
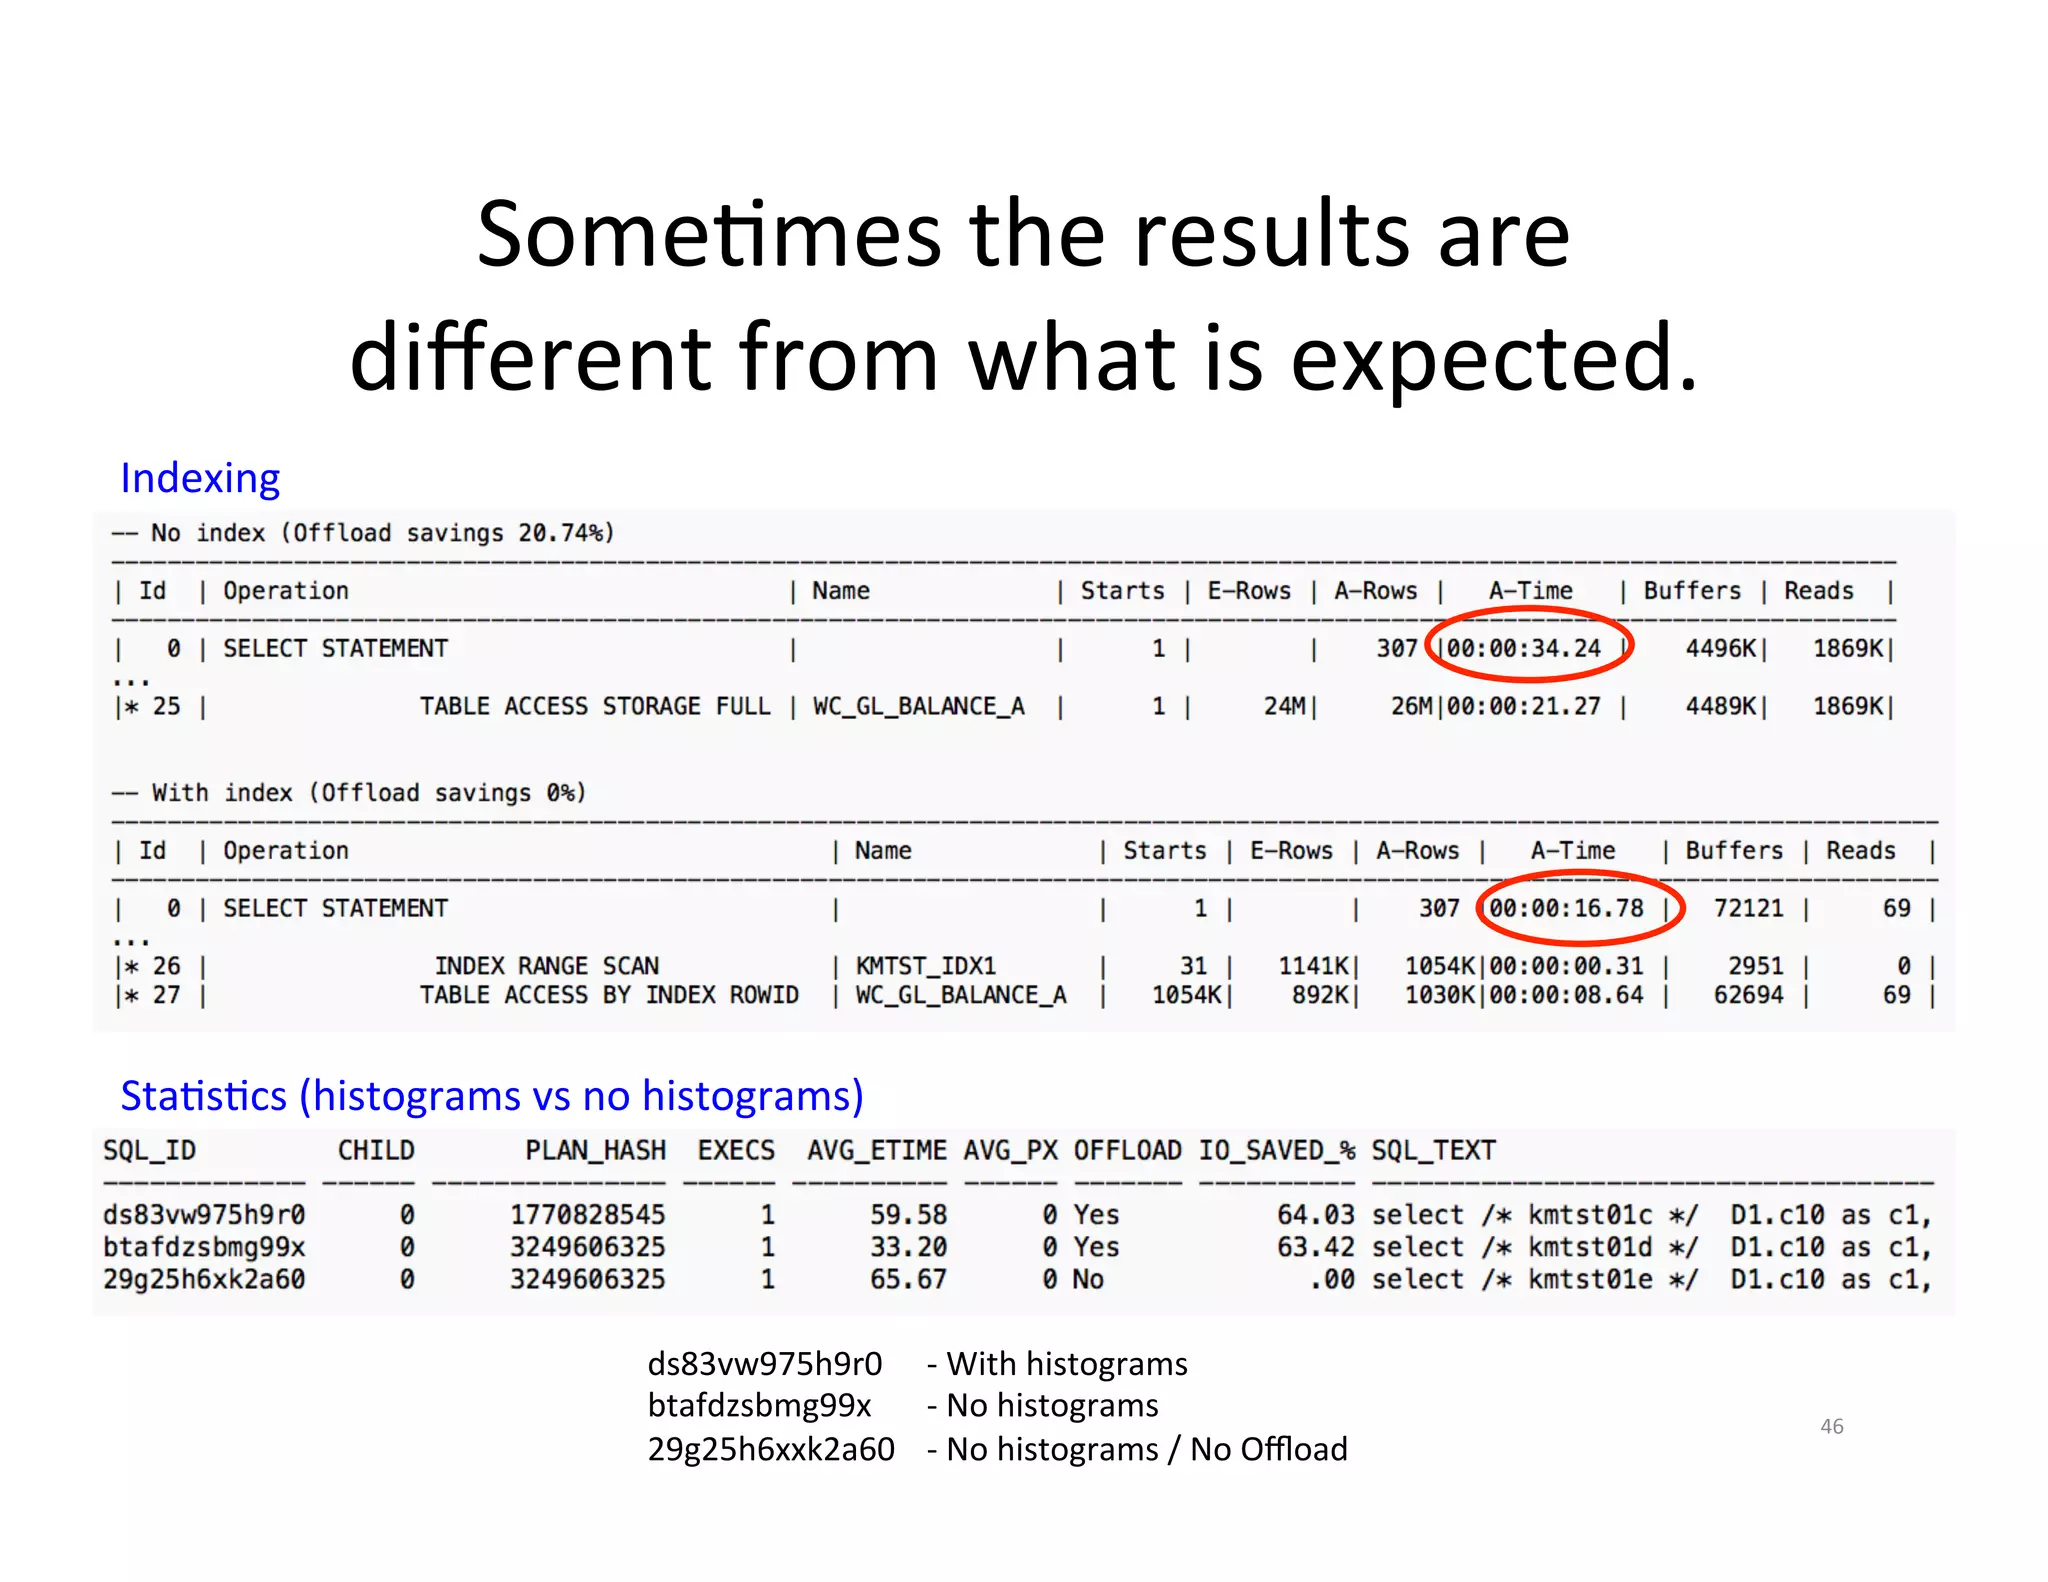
SomeJmes the results are different from what is expected. Indexing StaJsJcs (histograms vs no histograms) ds83vw975h9r0 -‐ With histograms btafdzsbmg99x -‐ No histograms 46 29g25h6xxk2a60 -‐ No histograms / No Offload
47.
SomeJmes segregaJng users helps. • Create separate "group users" • Create LOGON trigger for each group • Apply different parameter se}ngs per group • Examples: – _b_tree_bitmap_plans = TRUE/FALSE – _opJmizer_use_feedback = TRUE/FALSE – opJmizer_index_cost_adj = > 100 47
Row by row processing (is always a bad idea!) 30 us 100 ms Exadata can't fix this!
50.
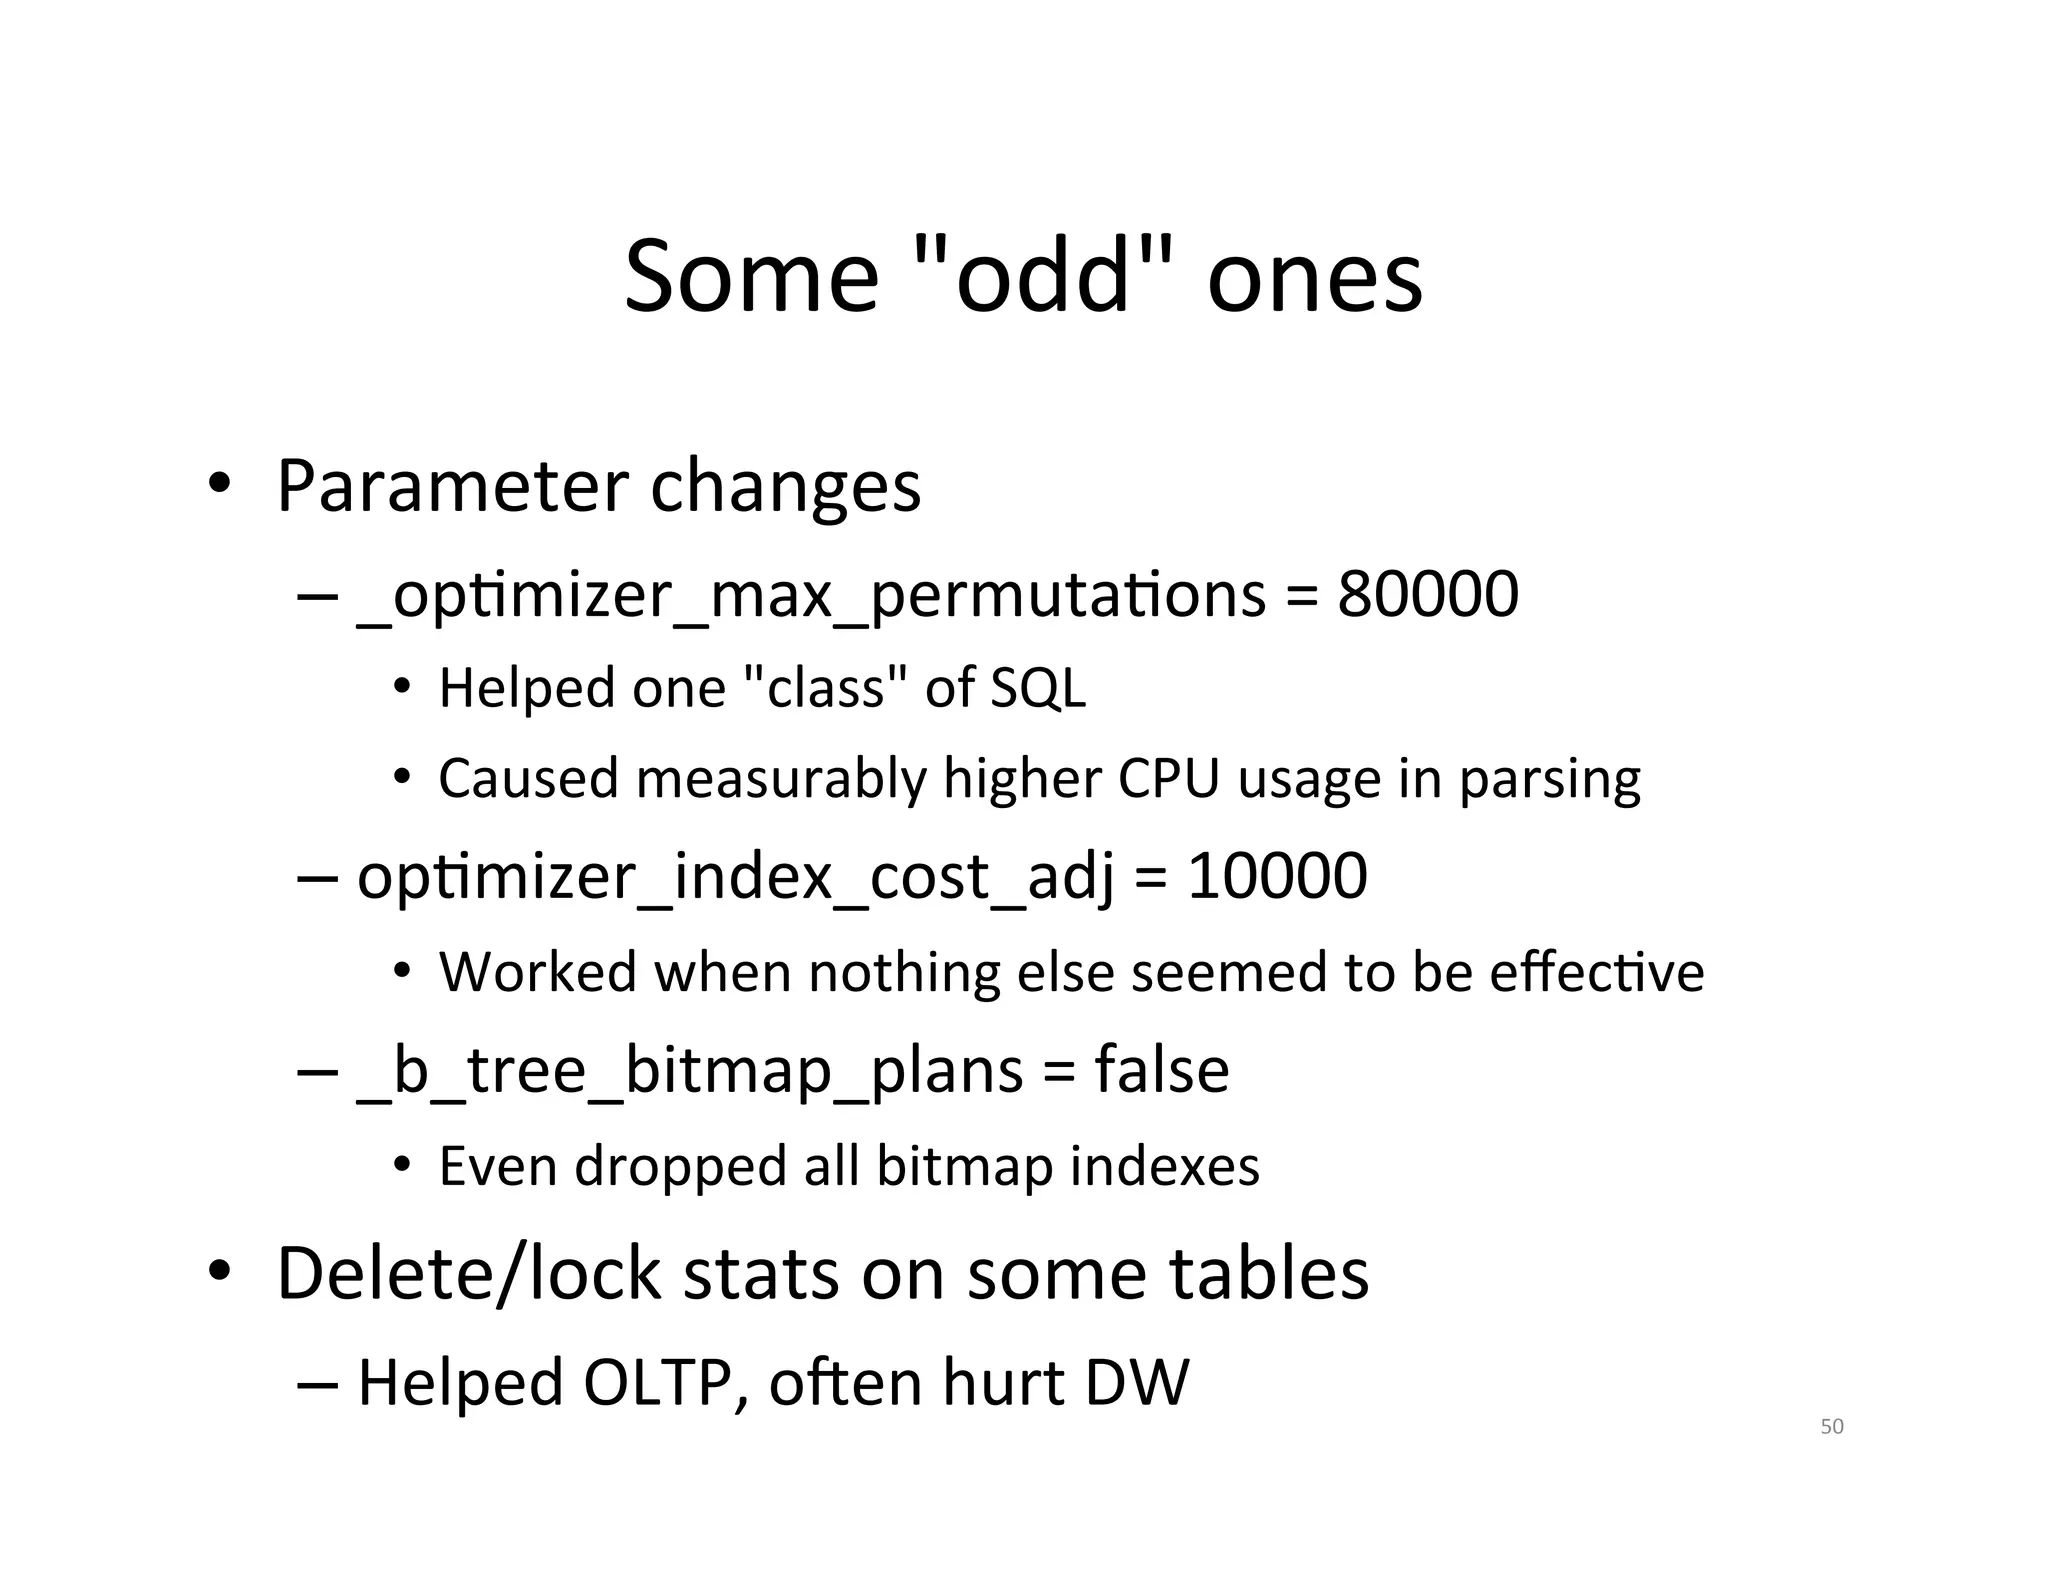
Some "odd" ones • Parameter changes – _opJmizer_max_permutaJons = 80000 • Helped one "class" of SQL • Caused measurably higher CPU usage in parsing – opJmizer_index_cost_adj = 10000 • Worked when nothing else seemed to be effecJve – _b_tree_bitmap_plans = false • Even dropped all bitmap indexes • Delete/lock stats on some tables – Helped OLTP, o~en hurt DW 50
51.
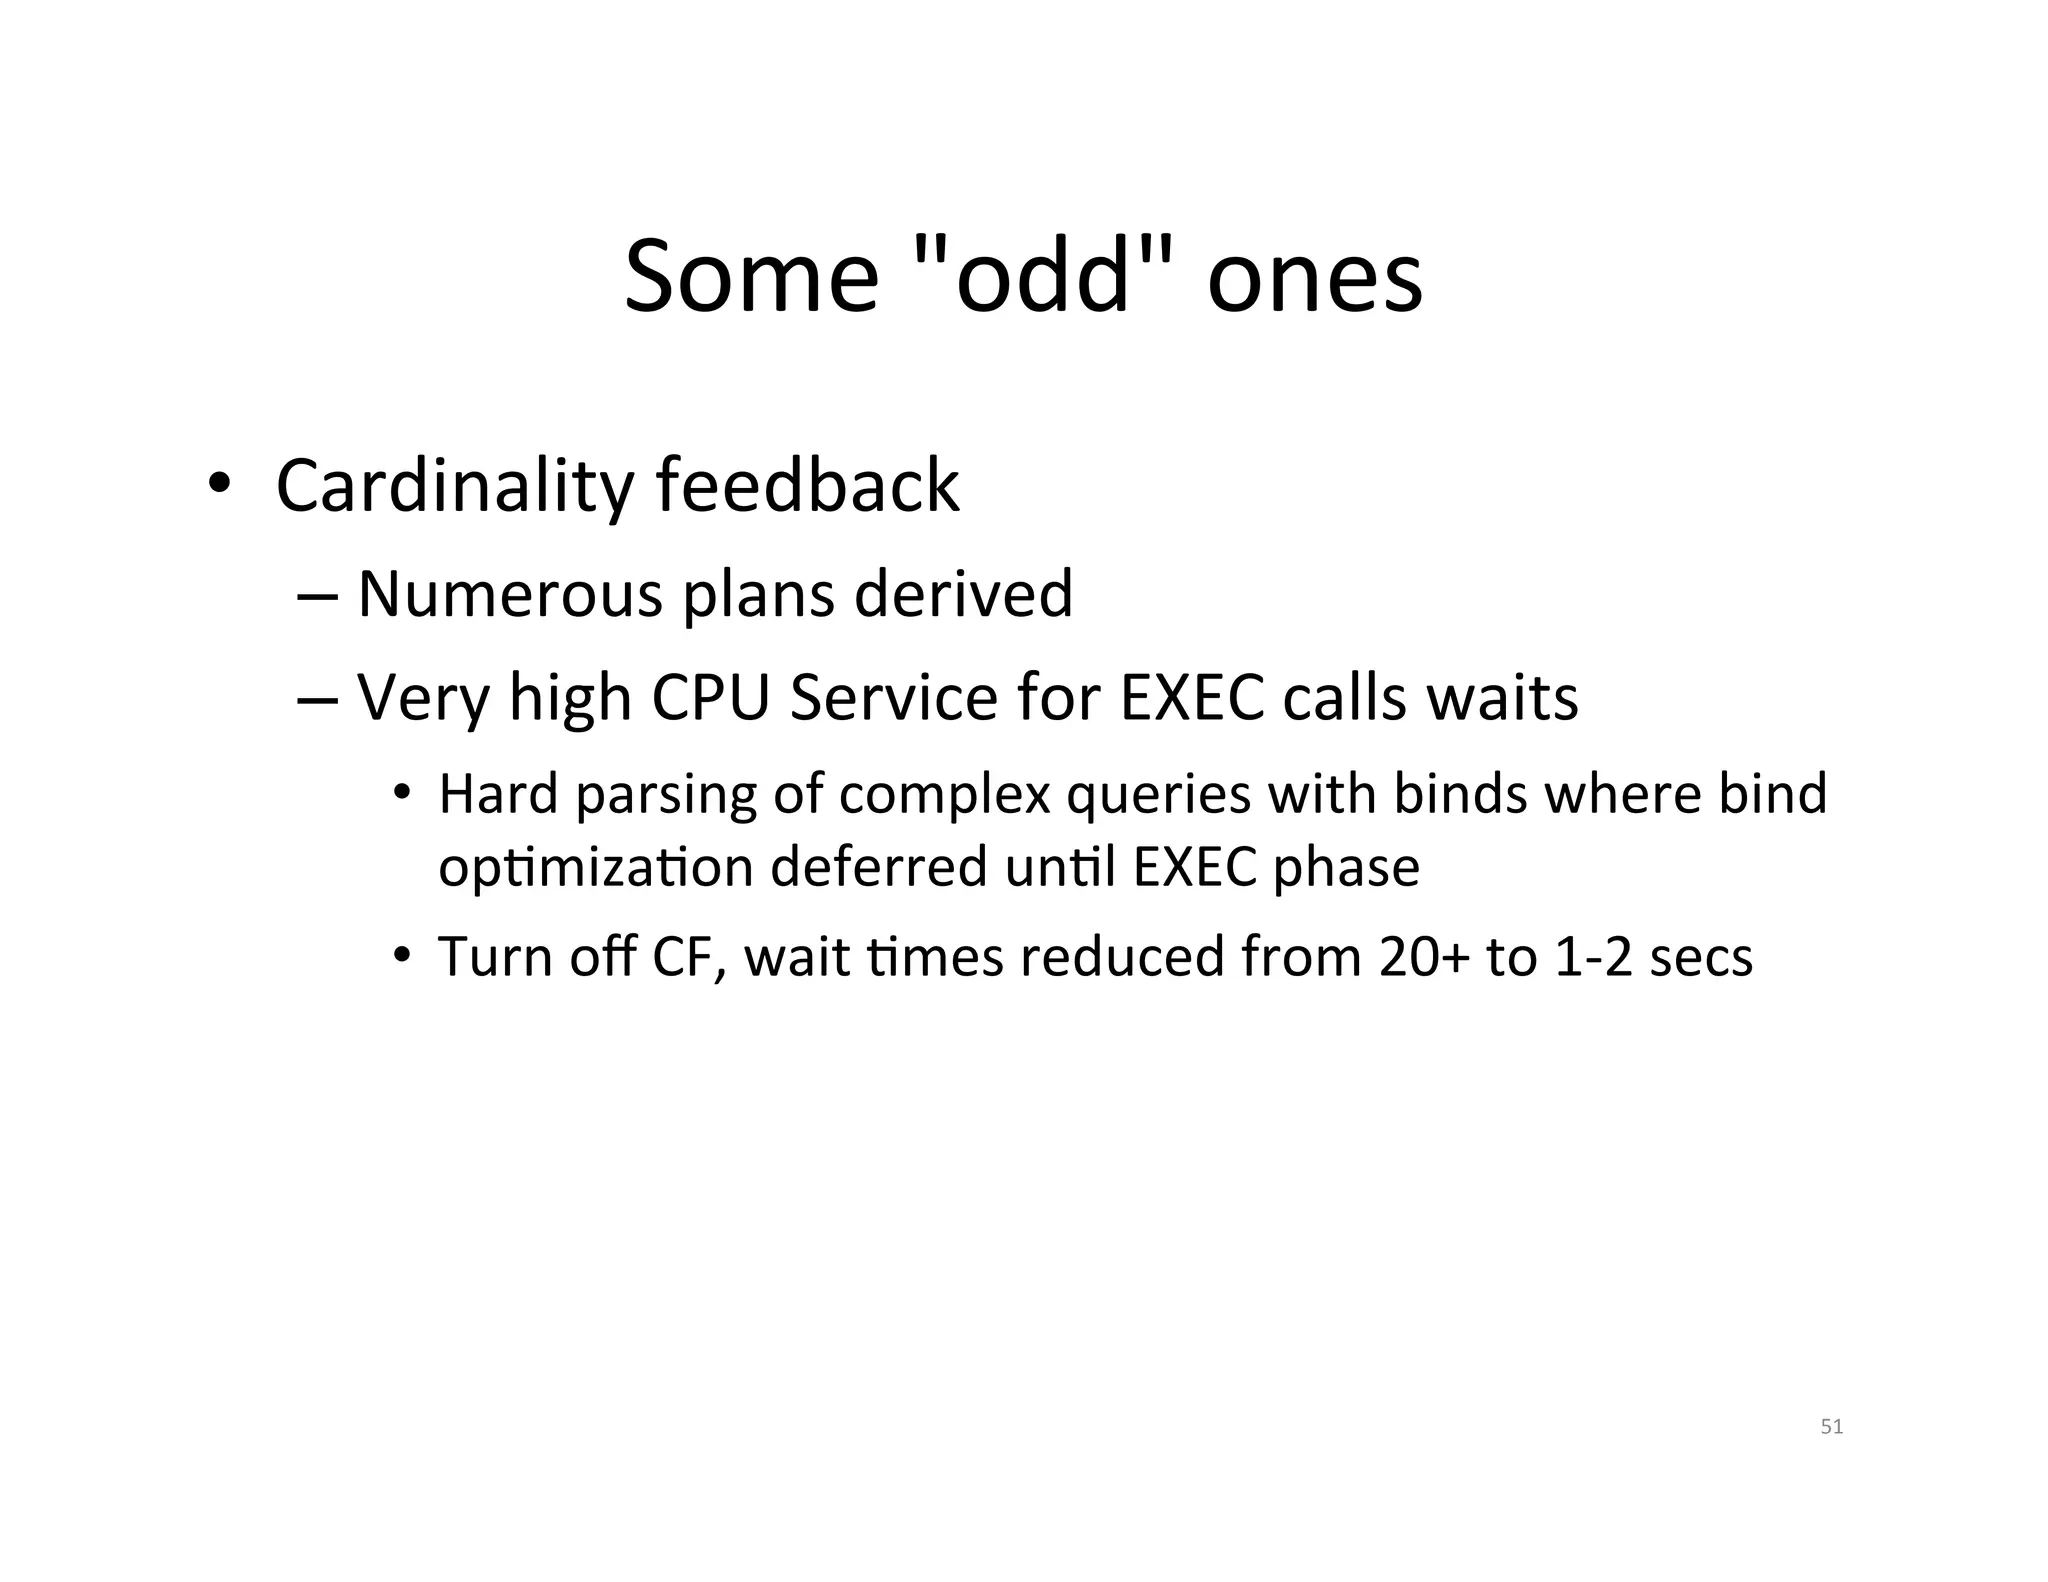
Some "odd" ones • Cardinality feedback – Numerous plans derived – Very high CPU Service for EXEC calls waits • Hard parsing of complex queries with binds where bind opJmizaJon deferred unJl EXEC phase • Turn off CF, wait Jmes reduced from 20+ to 1-‐2 secs 51
52.
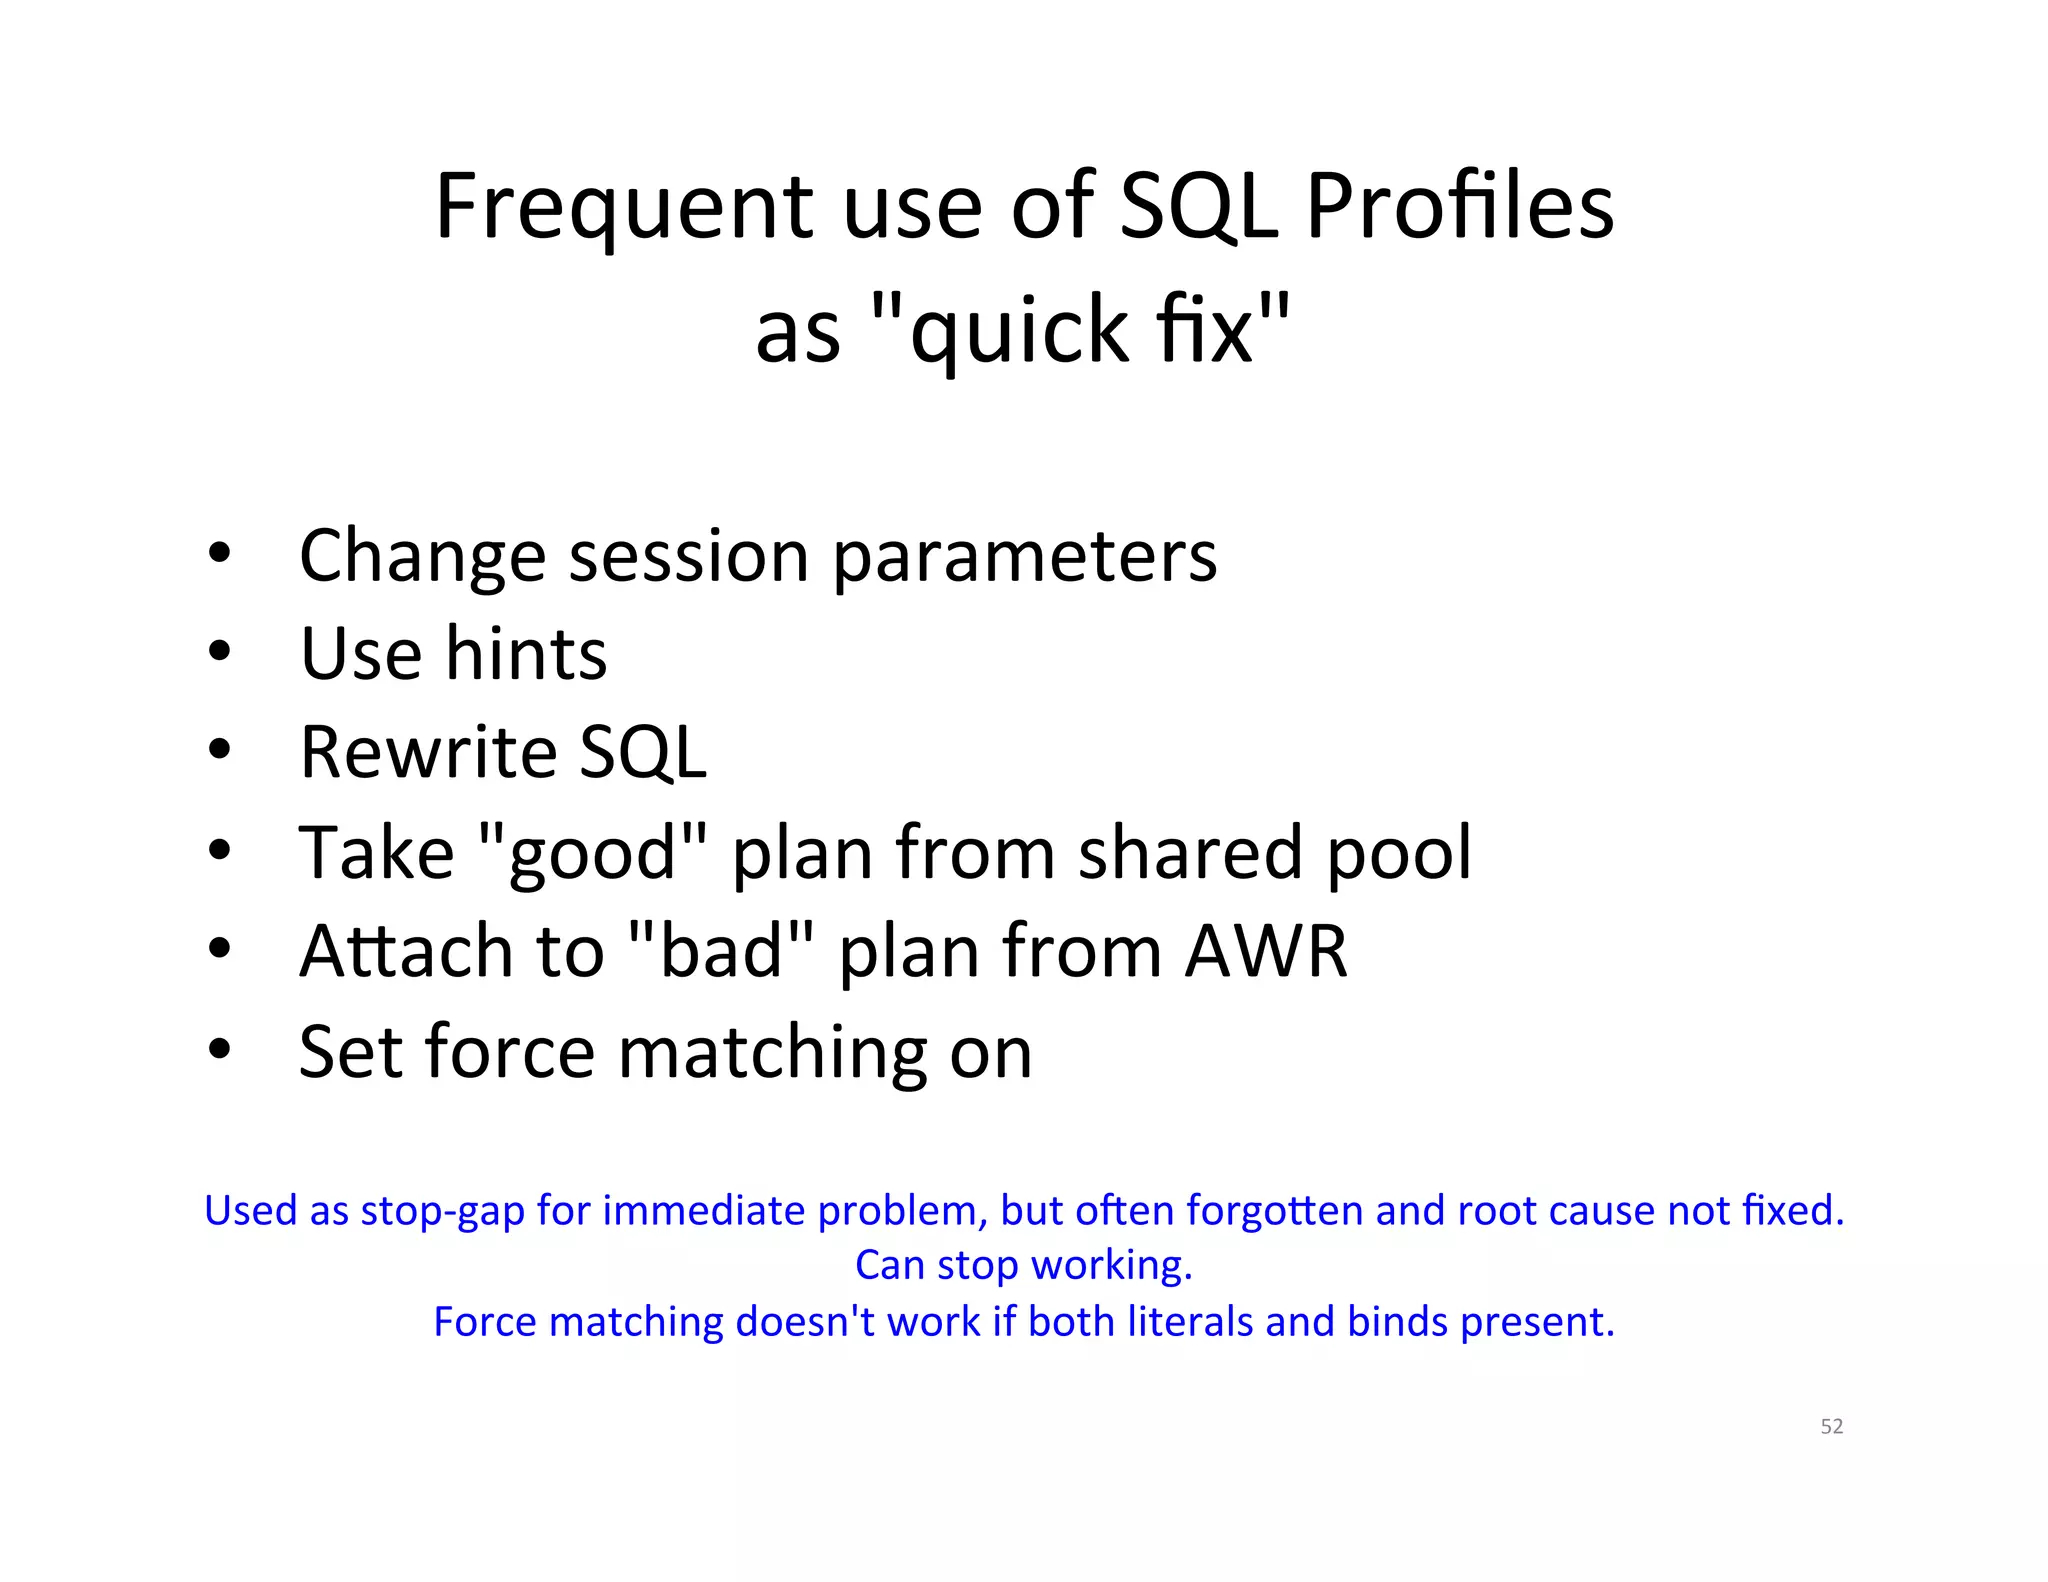
Frequent use of SQL Profiles as "quick fix" • Change session parameters • Use hints • Rewrite SQL • Take "good" plan from shared pool • A•ach to "bad" plan from AWR • Set force matching on Used as stop-‐gap for immediate problem, but o~en forgo•en and root cause not fixed. Can stop working. Force matching doesn't work if both literals and binds present. 52
Recap • There's a great deal of good to be achieved • Behavior is frequently unpredicatable • Mixed environments can be nightmarish • Forcing desired behavior can force "bad" pracJces to be used • Locking down plans (SQL Profiles) isn't necessarily a permanent fix (or shouldn't be) • Hope for more help from the opJmizer in the future! 54
55.
Remember… Exadata is NOT a magic cure for bad SQL! 55