Downloaded 14 times


![BANNER INFOGRAPHICInsert Your Subtitle Here Total broker Partitions 04 05 06 Simply knowing how many partitions a broker is managing can help you avoid errors and know when it’s time to scale out. The goal should be to keep the count balanced across brokers. Kafka.server: type=ReplicaManager, name=PartitionCount – Number of partitions on the brokers. Important Metrics to Focus on Log Flush Latency Consumer Message Rate Kafka Stores data by appending to existing log files .Cache based writes are flushed to physical storage. Your monitoring strategy should include combination of data replication and latency in the asynchronous disk log flush time. Kafka.log: type=LogFlushStats, name=LogFlushRateAndTimeMs Set baselines for expected consumer message throughput and measure fluctuations in the rate to detect latency and the need to scale the number of consumers up and down accordingly. Kafka.consumer type=ConsumerTopicMetrics, name=MessagePerSec, clientId=([-.w]+) Messages consumed per sec.](https://image.slidesharecdn.com/knoldus-kafka-webinar-neelam-191218051825/75/Removing-performance-bottlenecks-with-Kafka-Monitoring-and-topic-configuration-7-2048.jpg)
![BANNER INFOGRAPHICInsert Your Subtitle Here Consumer Max Lag 07 08 Even with consumers fetching messages at a high rate, producers can still outspace them. This metrics works at the level of consumer and partition , means each partition in each topic has its own lag for a given consumer. Kafka.consumer: type=ConsumerFetcherManager, name=MaxLag, clientId=([-.w]+) Number of messages by which consumer lags behind the producer. Important Metrics to Focus on Fetcher Lag This metrics indicates the lag in the number of messages per follower replica, indicating that replication has potentially stopped or has been interrupted. Monitoring the replica.lag.time.max.ms configuration parameter you can measure the time for which the replica has not attempted to fetch new data from the leader. Kafka.server: type=FetcherLagMetrics, name=ConsumerLag, clientId=([-.w]+), partition=([0-9]+)](https://image.slidesharecdn.com/knoldus-kafka-webinar-neelam-191218051825/75/Removing-performance-bottlenecks-with-Kafka-Monitoring-and-topic-configuration-8-2048.jpg)
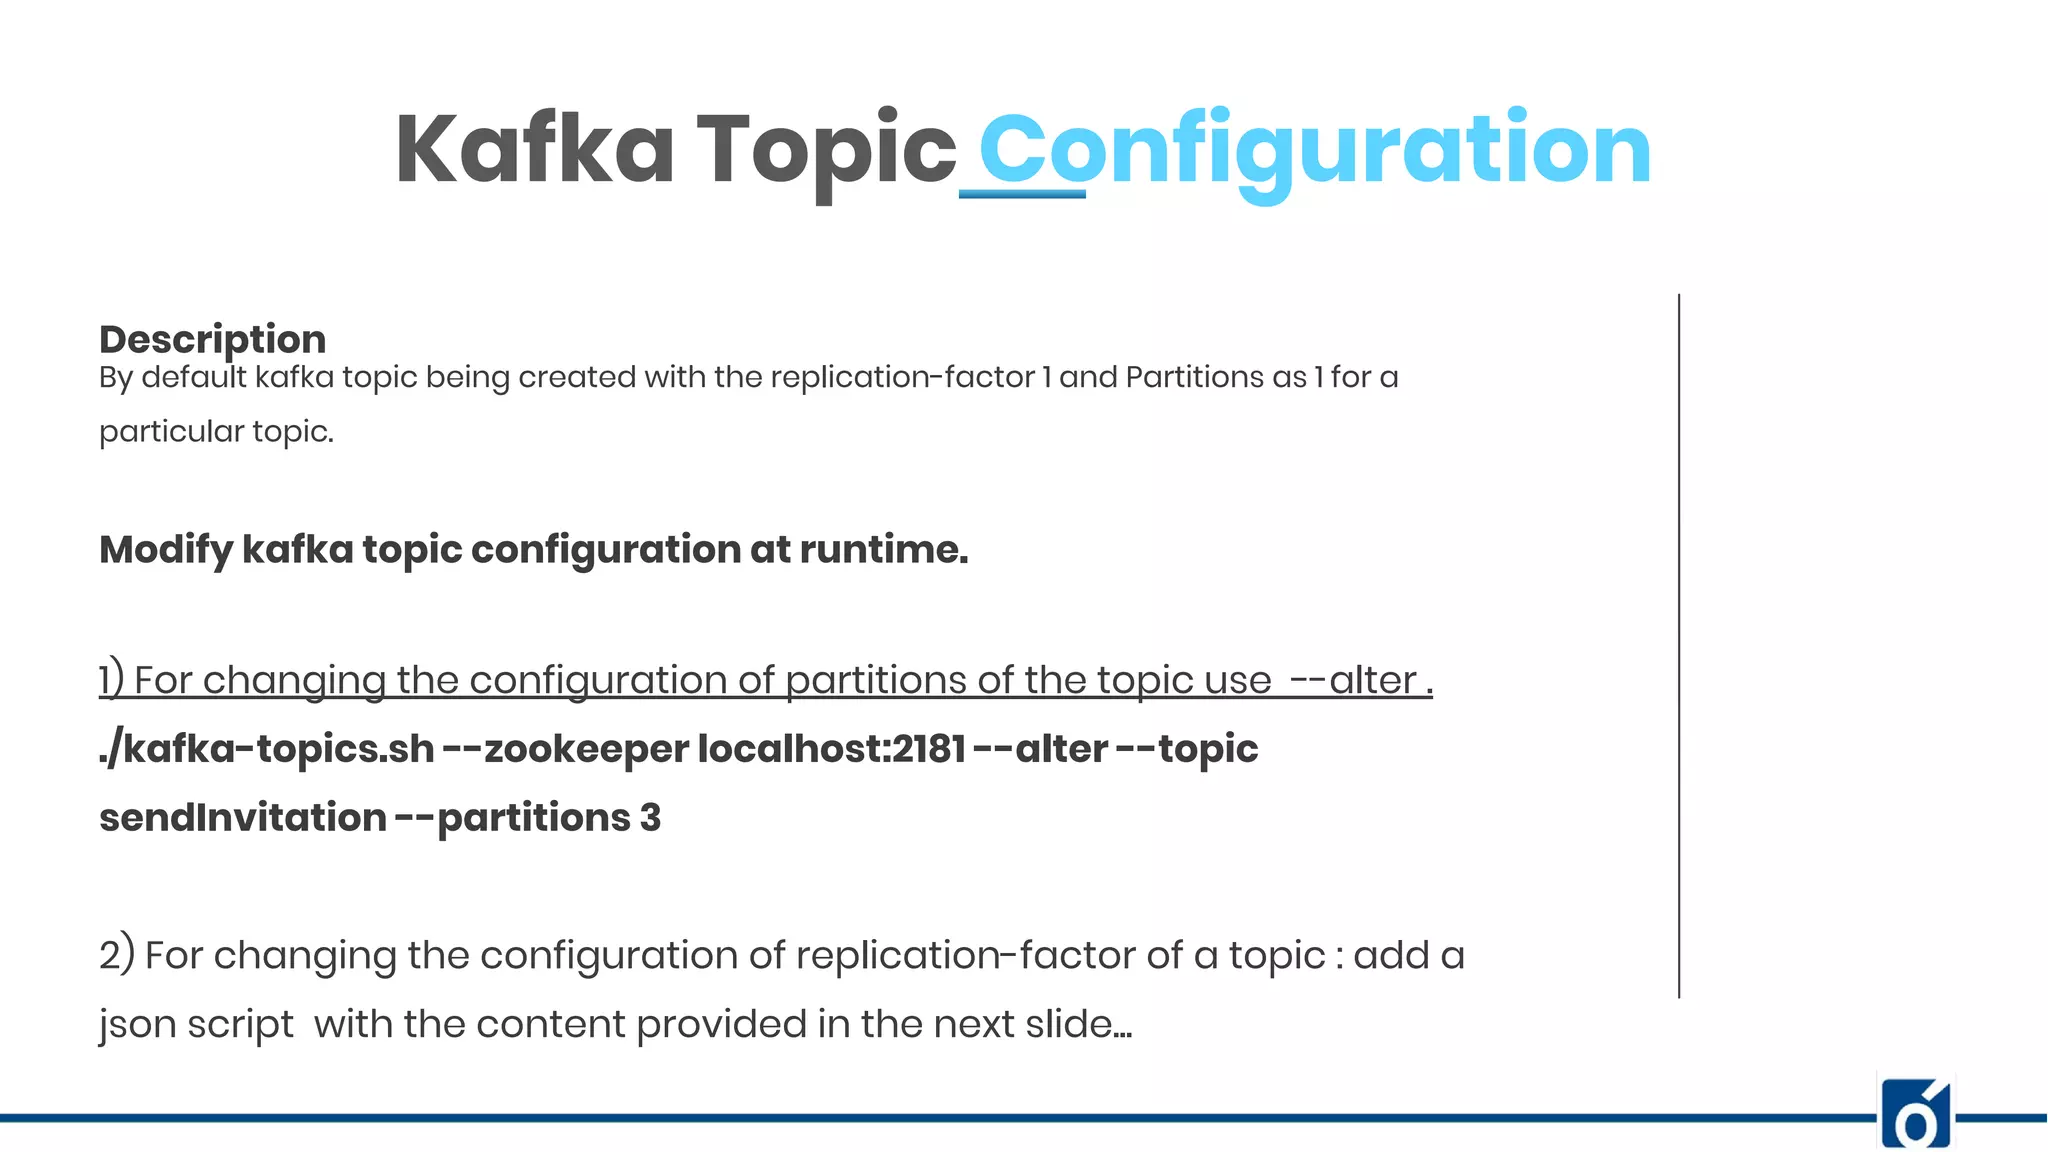
![ABOUT COMPANY Kafka Topic Configuration 2) For changing the configuration of replication-factor of a topic : add a json script with the content provided below: Assume the script name is increase-replication-factor.json. {"version":1, "partitions":[ {"topic":"sendInvitation","partition":0,"replicas":[0,1,2]}, {"topic":"sendInvitation","partition":1,"replicas":[0,1,2]}, {"topic":"sendInvitation","partition":2,"replicas":[0,1,2]}, {"topic":"xyz","partition":0,"replicas":[0,1,2]}, {"topic":"xyz","partition":1,"replicas":[0,1,2]}, ]} Than execute the following command to run and apply this script: ./kafka-reassign-partitions --zookeeper localhost:2181 --reassignment-json-file increase-replication-factor.json --execute Modify kafka topic configuration at runtime.](https://image.slidesharecdn.com/knoldus-kafka-webinar-neelam-191218051825/75/Removing-performance-bottlenecks-with-Kafka-Monitoring-and-topic-configuration-13-2048.jpg)


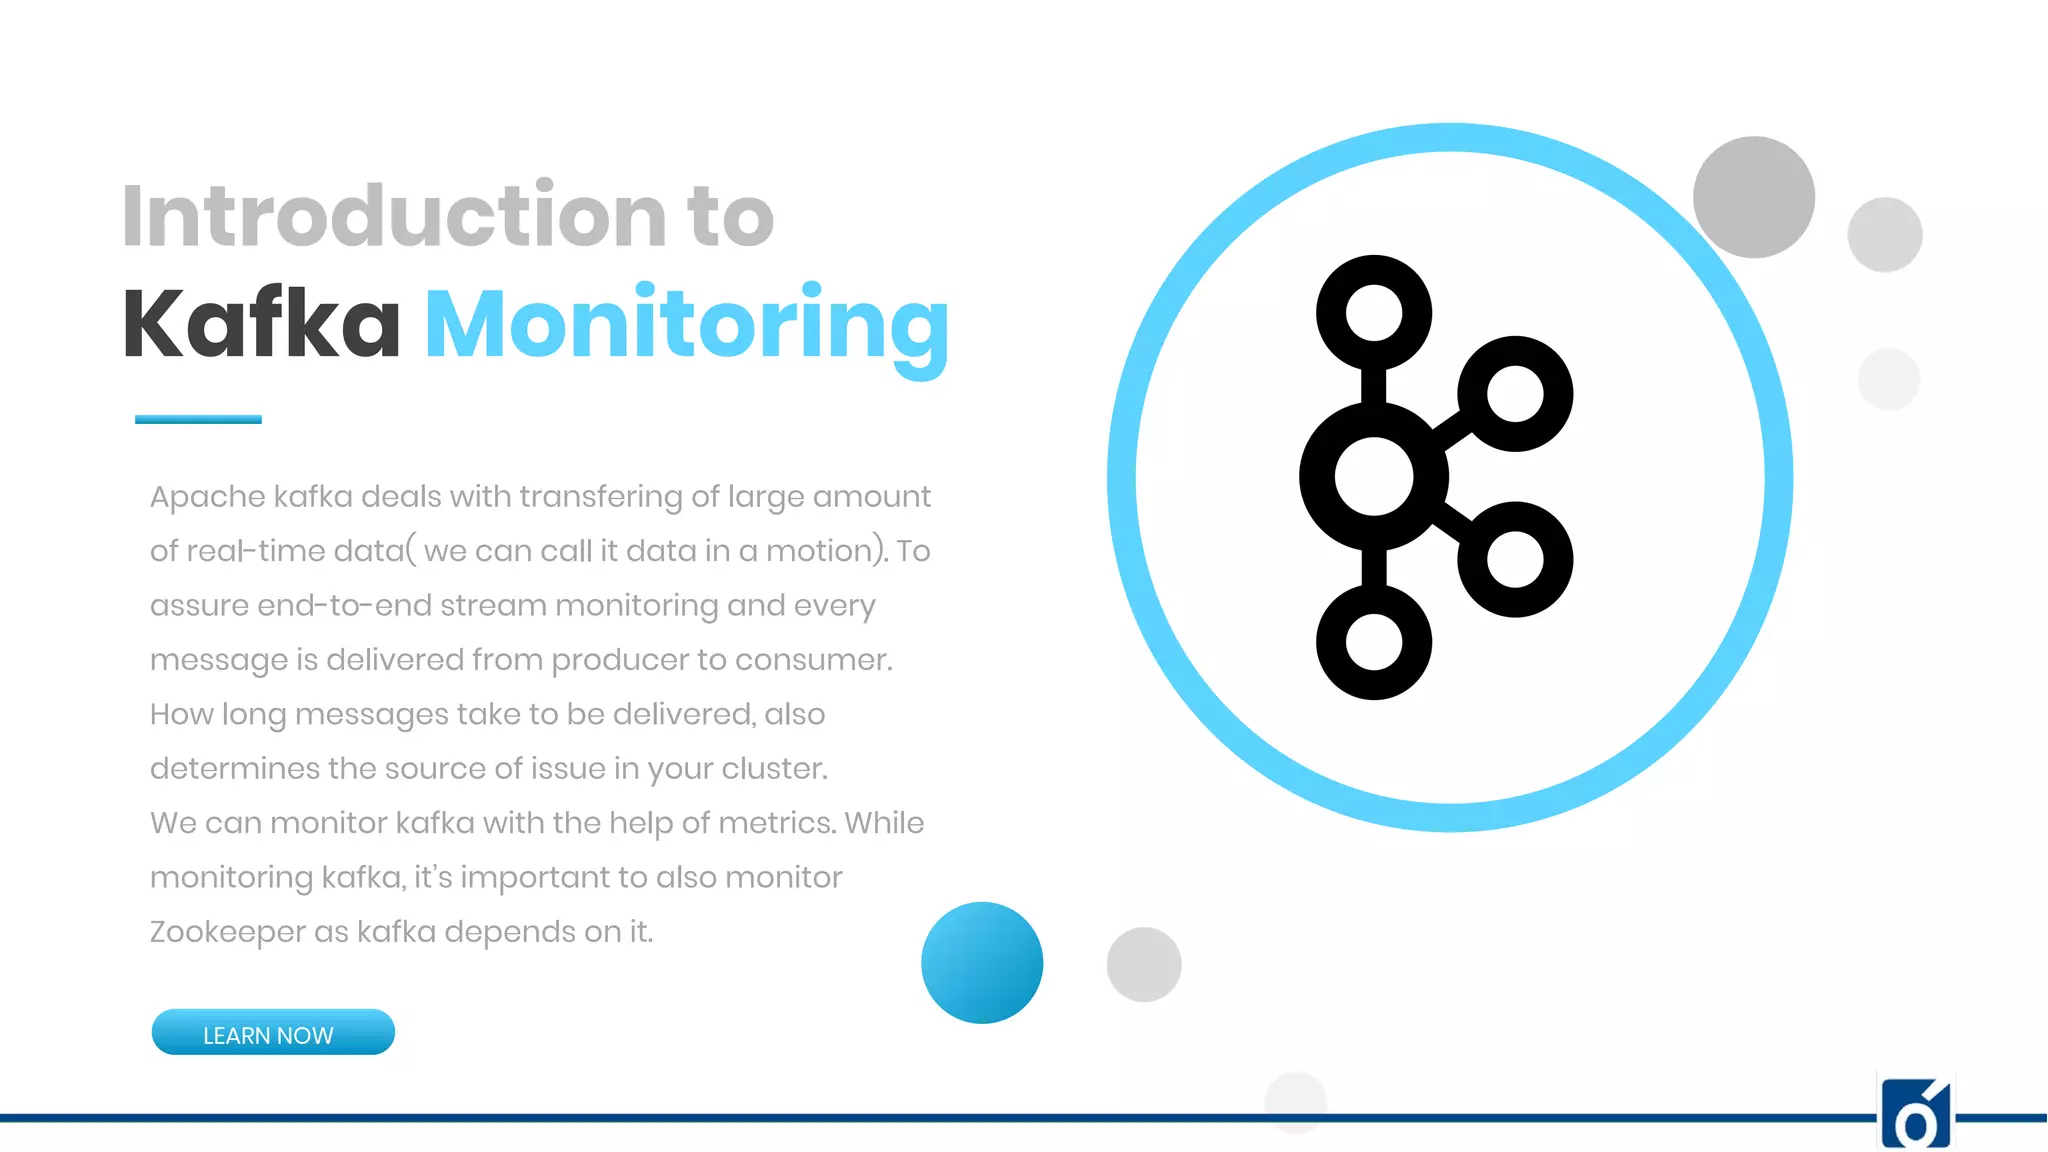
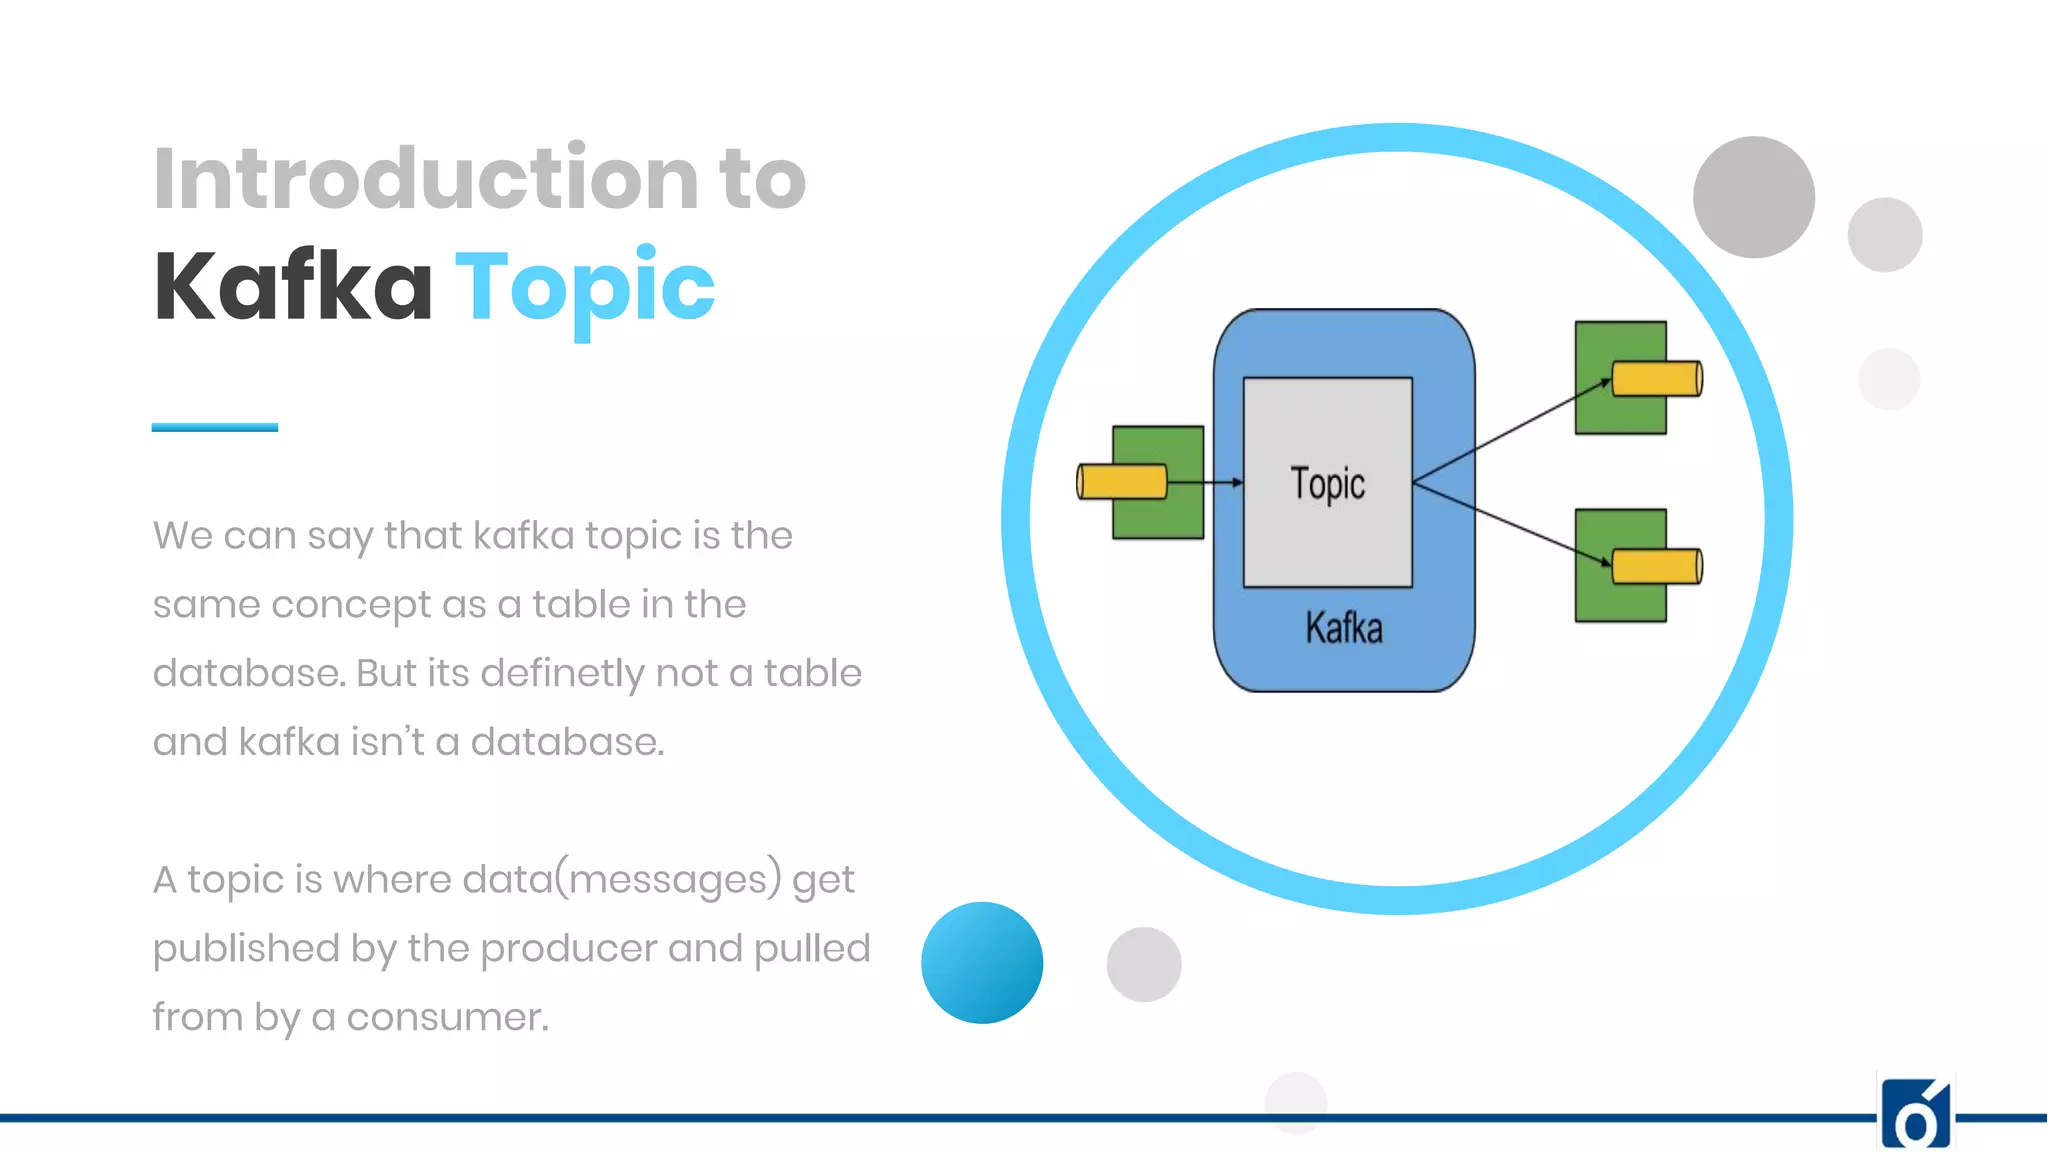
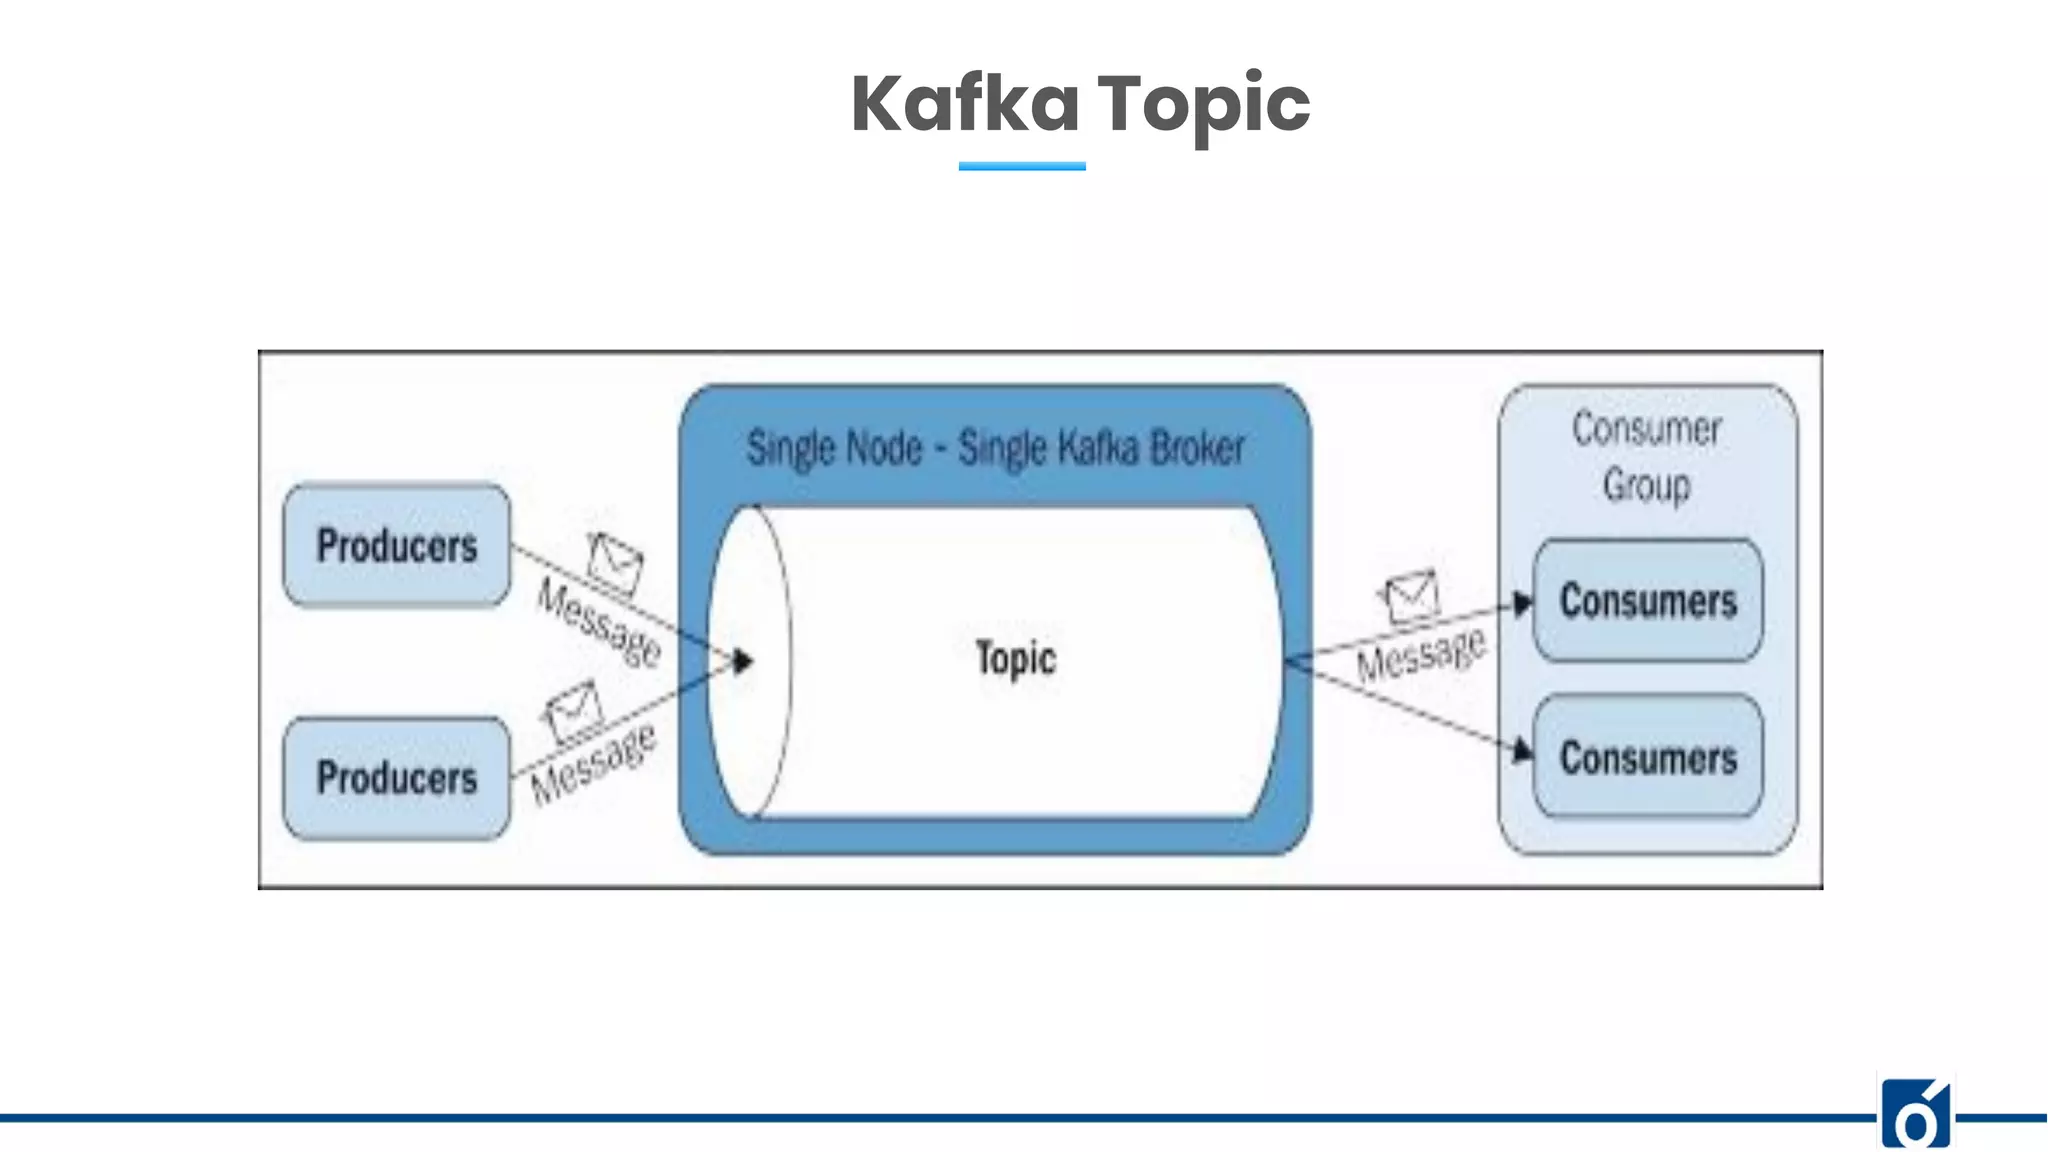
This document presents an overview of Kafka monitoring and topic configuration, emphasizing the importance of monitoring metrics for ensuring data delivery, application performance, and scalability. Key metrics discussed include network request rates, consumer lag, and partition management to maintain data durability and avoid errors. Additionally, it outlines procedures for modifying Kafka topic configurations using command-line tools and JSON scripts.