Download as PDF, PPTX


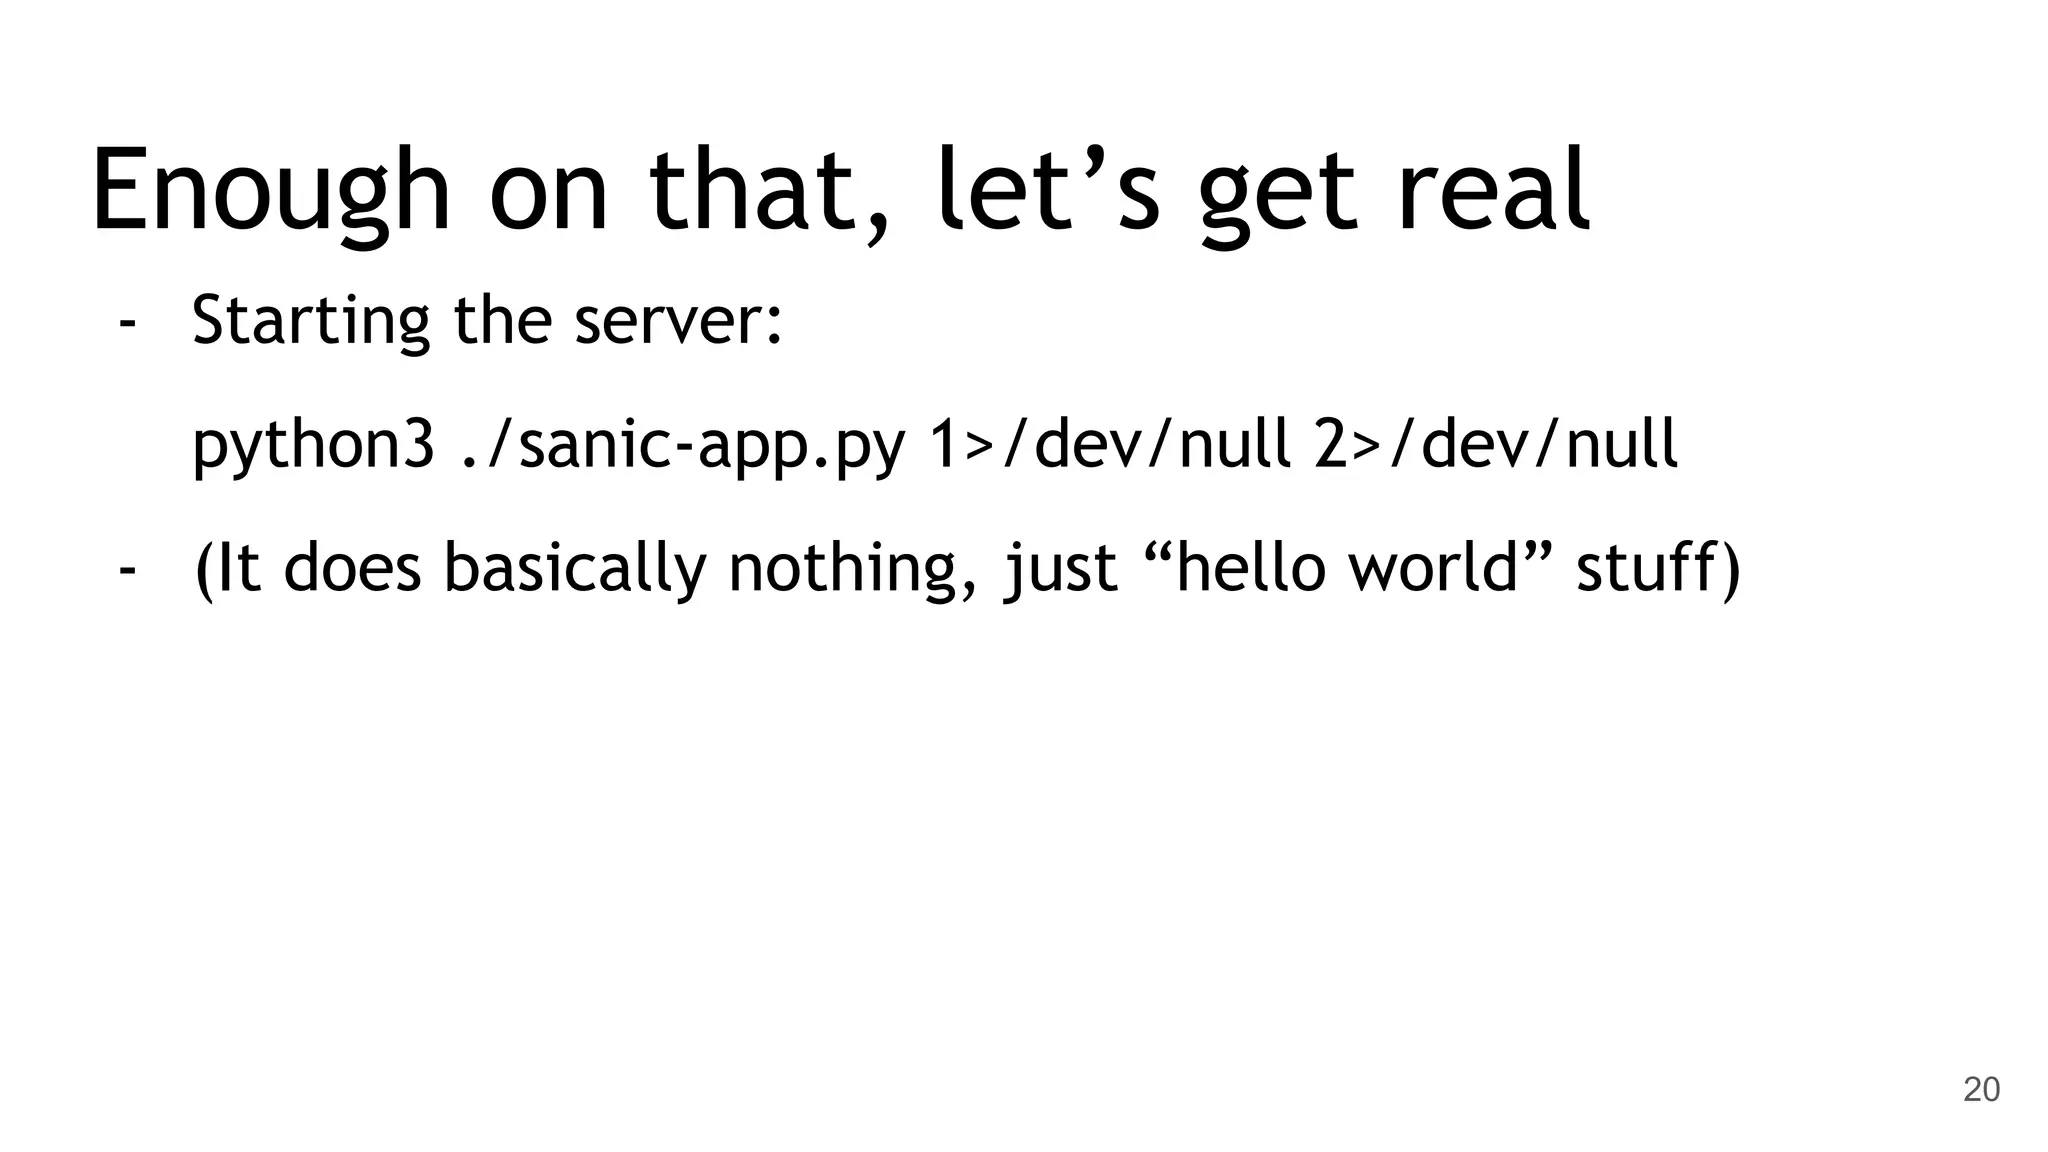


This document discusses profiling Python performance. It begins by acknowledging that Python can be slow due to the Global Interpreter Lock (GIL) and lack of a just-in-time (JIT) compiler. It then demonstrates how to profile a Python program using the pyflame tool to collect stack samples and convert them to a flamegraph for analysis. The document shows pyflame being used to profile a simple Sanic web application under load testing. It finds that pyflame has surprisingly little overhead and concludes that while Python has limitations, it is not inherently slow when profiled and optimized properly.