The document discusses the advantages and challenges of using flash storage technology in Oracle products, emphasizing its potential to replace traditional hard drives with solid-state drives (SSDs) to reduce costs, failures, and latencies. It outlines various flash technologies, benefits including higher IOPS and lower latency, and presents strategies for evaluating and optimizing database workloads for flash storage. Additionally, it highlights how to match object intensities with appropriate storage tiers to enhance performance and cost-effectiveness.


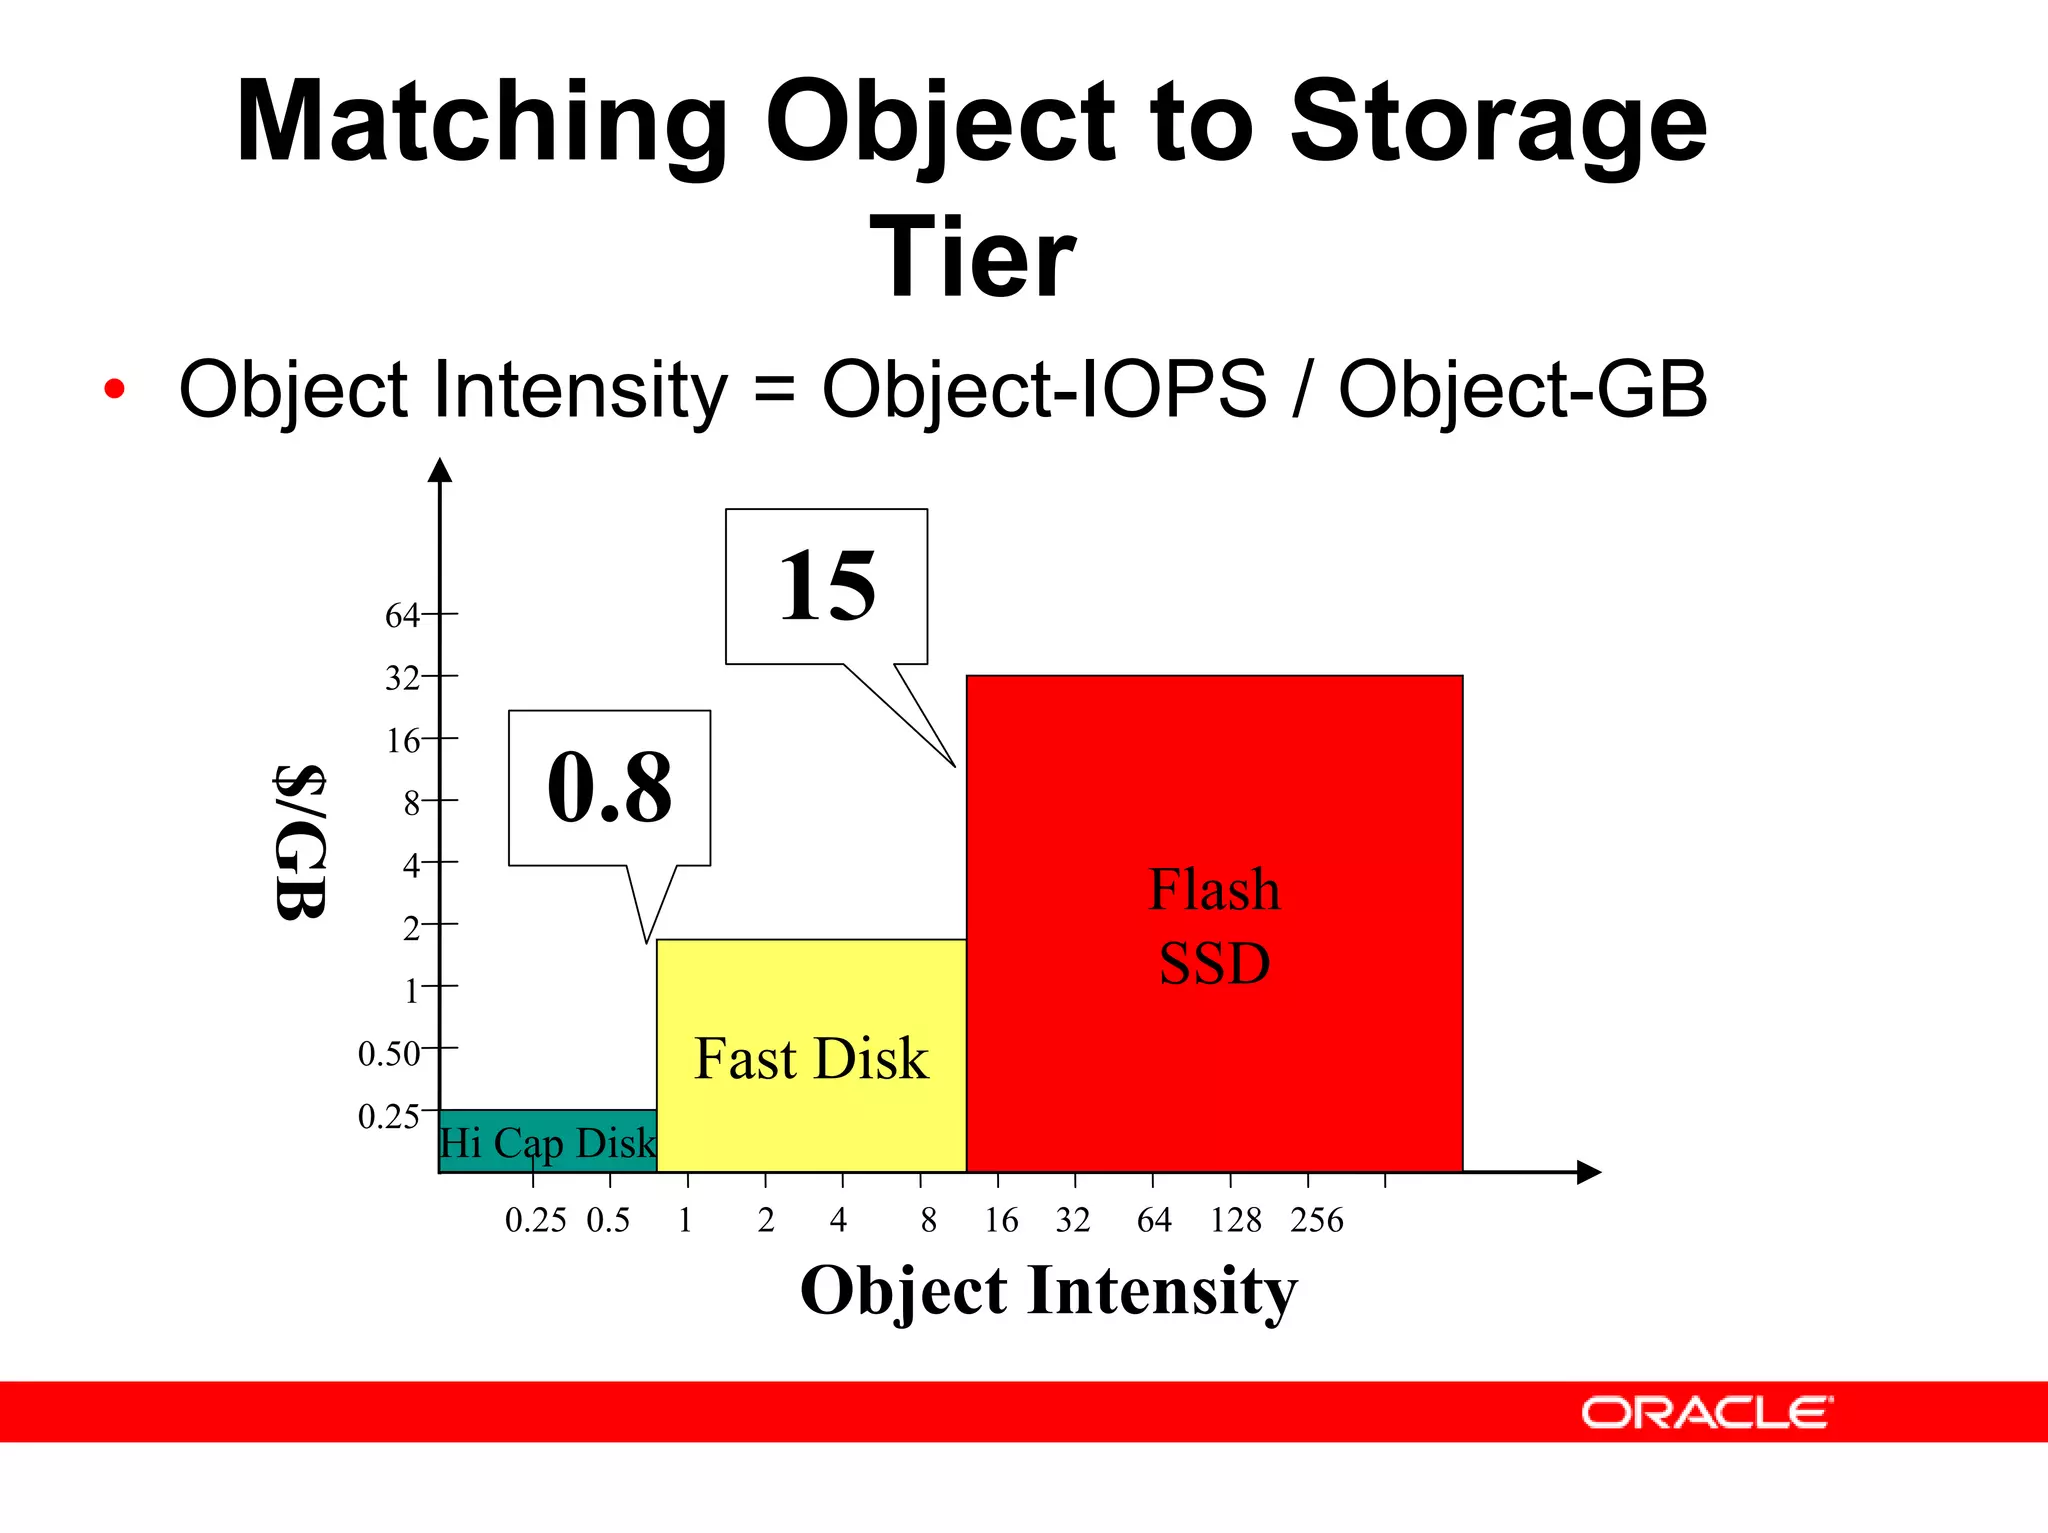
![Matching IO Intensity to Storage Tier • Object Intensity = Object-IOPS / Object-GB • Match Object Intensity with Storage Tier • COST[tier] = MAX(Object IOPS * $/IOPS[tier], Object-GB * $/GB[tier]) • Tier Intensity[tier] = $/GB[tier] / $/IOPS[tier] • If Object-Intensity > Tier-Intensity then cost of object in this tier is IOPS bound • Otherwise cost of object in this tier is Capacity bound • Optimize: • If cost is IOPS bound, compare with lower (cheaper IOPS) tier • if cost is Capacity bound, compare with upper (cheaper capacity) tier](https://image.slidesharecdn.com/presentation-databaseonflash-150728034917-lva1-app6891/75/Presentation-database-on-flash-22-2048.jpg)
![Tier Intensity Cut Offs • Tier Intensity = $/GB / $/IOPS • Hi Cap Disk Intensity = ($250 / 1000GB) / ($250 / 100 IOPS) = 1/10 • Fast Disk Intensity = ($600 / 300GB) / ($600 / 300 IOPS) = 1 • Flash Intensity = ($2400 / 80GB) / ($2400 / 30K IOPS) = 375 • If Object Intensity is > 375: Choose Flash • If Object Intensity is between 1 and 375 • Break even when Intensity is $/GB[Flash] / $/IOPS[Fast-Disk] = ($2400 / 80GB) / ($600 / 300 IOPS) = 15 • If Object Intensity is between 1/10 and 1: • Break even when Intensity is $/GB[Fast-Disk] / $/IOPS[HC-Disk] = ($600 / 300 GB) / ($250 / 100 IOPS) = 0.8 • If Object Intensity is < 1/10: Choose High Capacity Disk](https://image.slidesharecdn.com/presentation-databaseonflash-150728034917-lva1-app6891/75/Presentation-database-on-flash-23-2048.jpg)