Download as PDF, PPTX

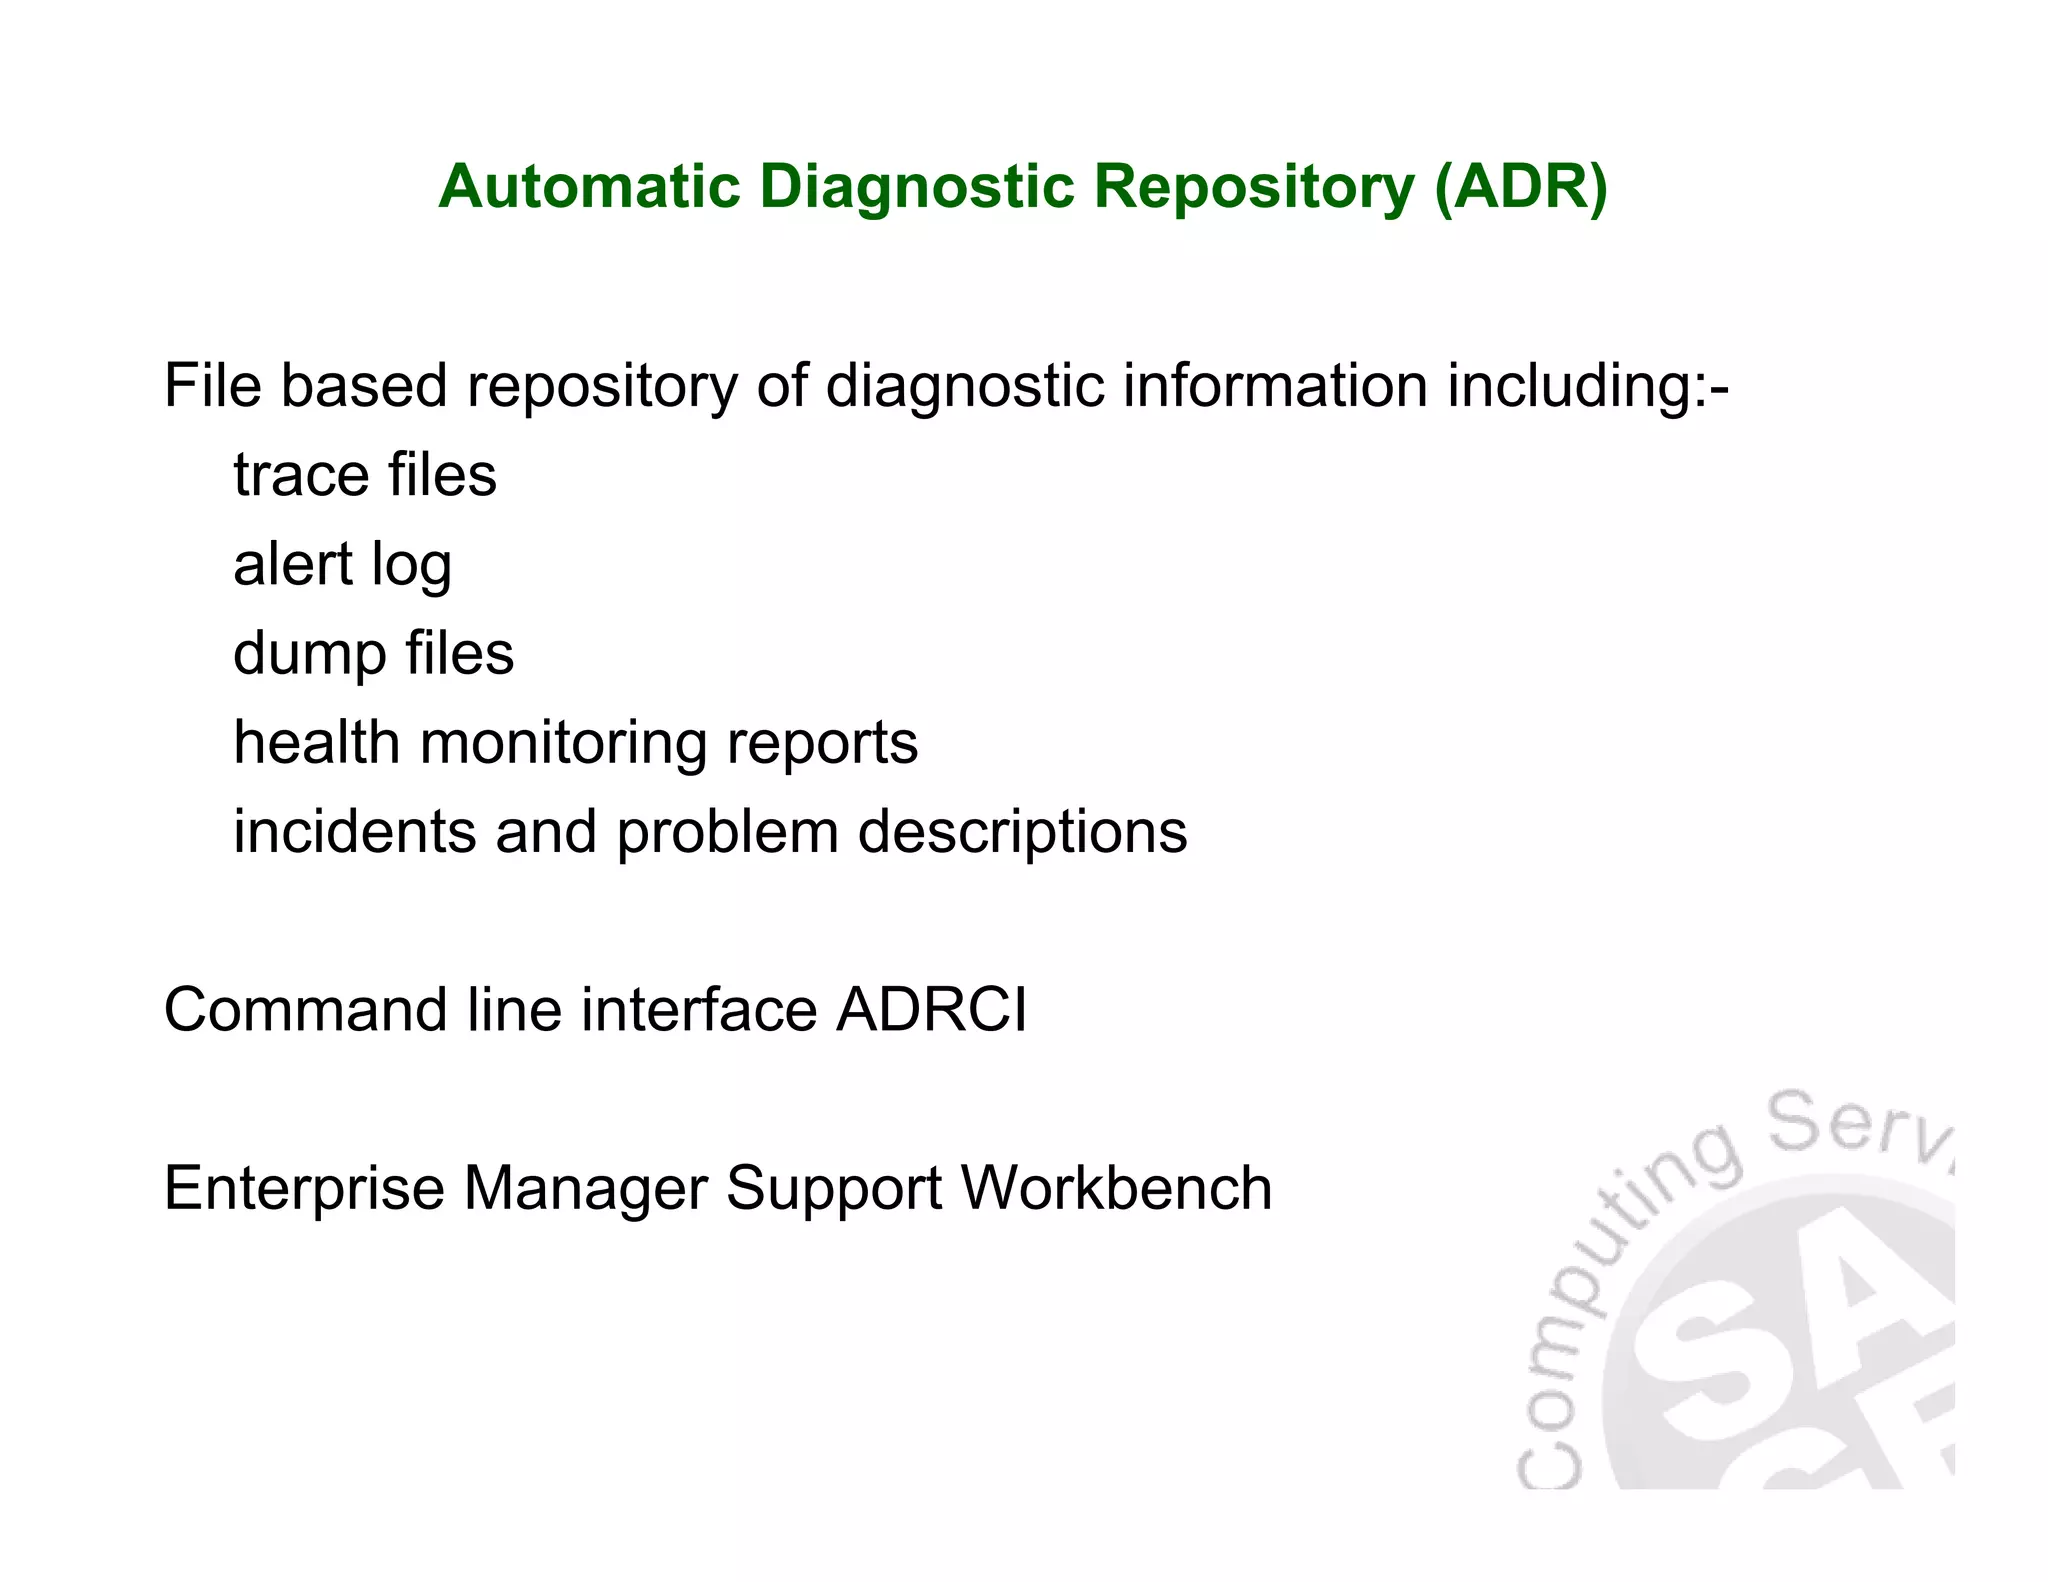

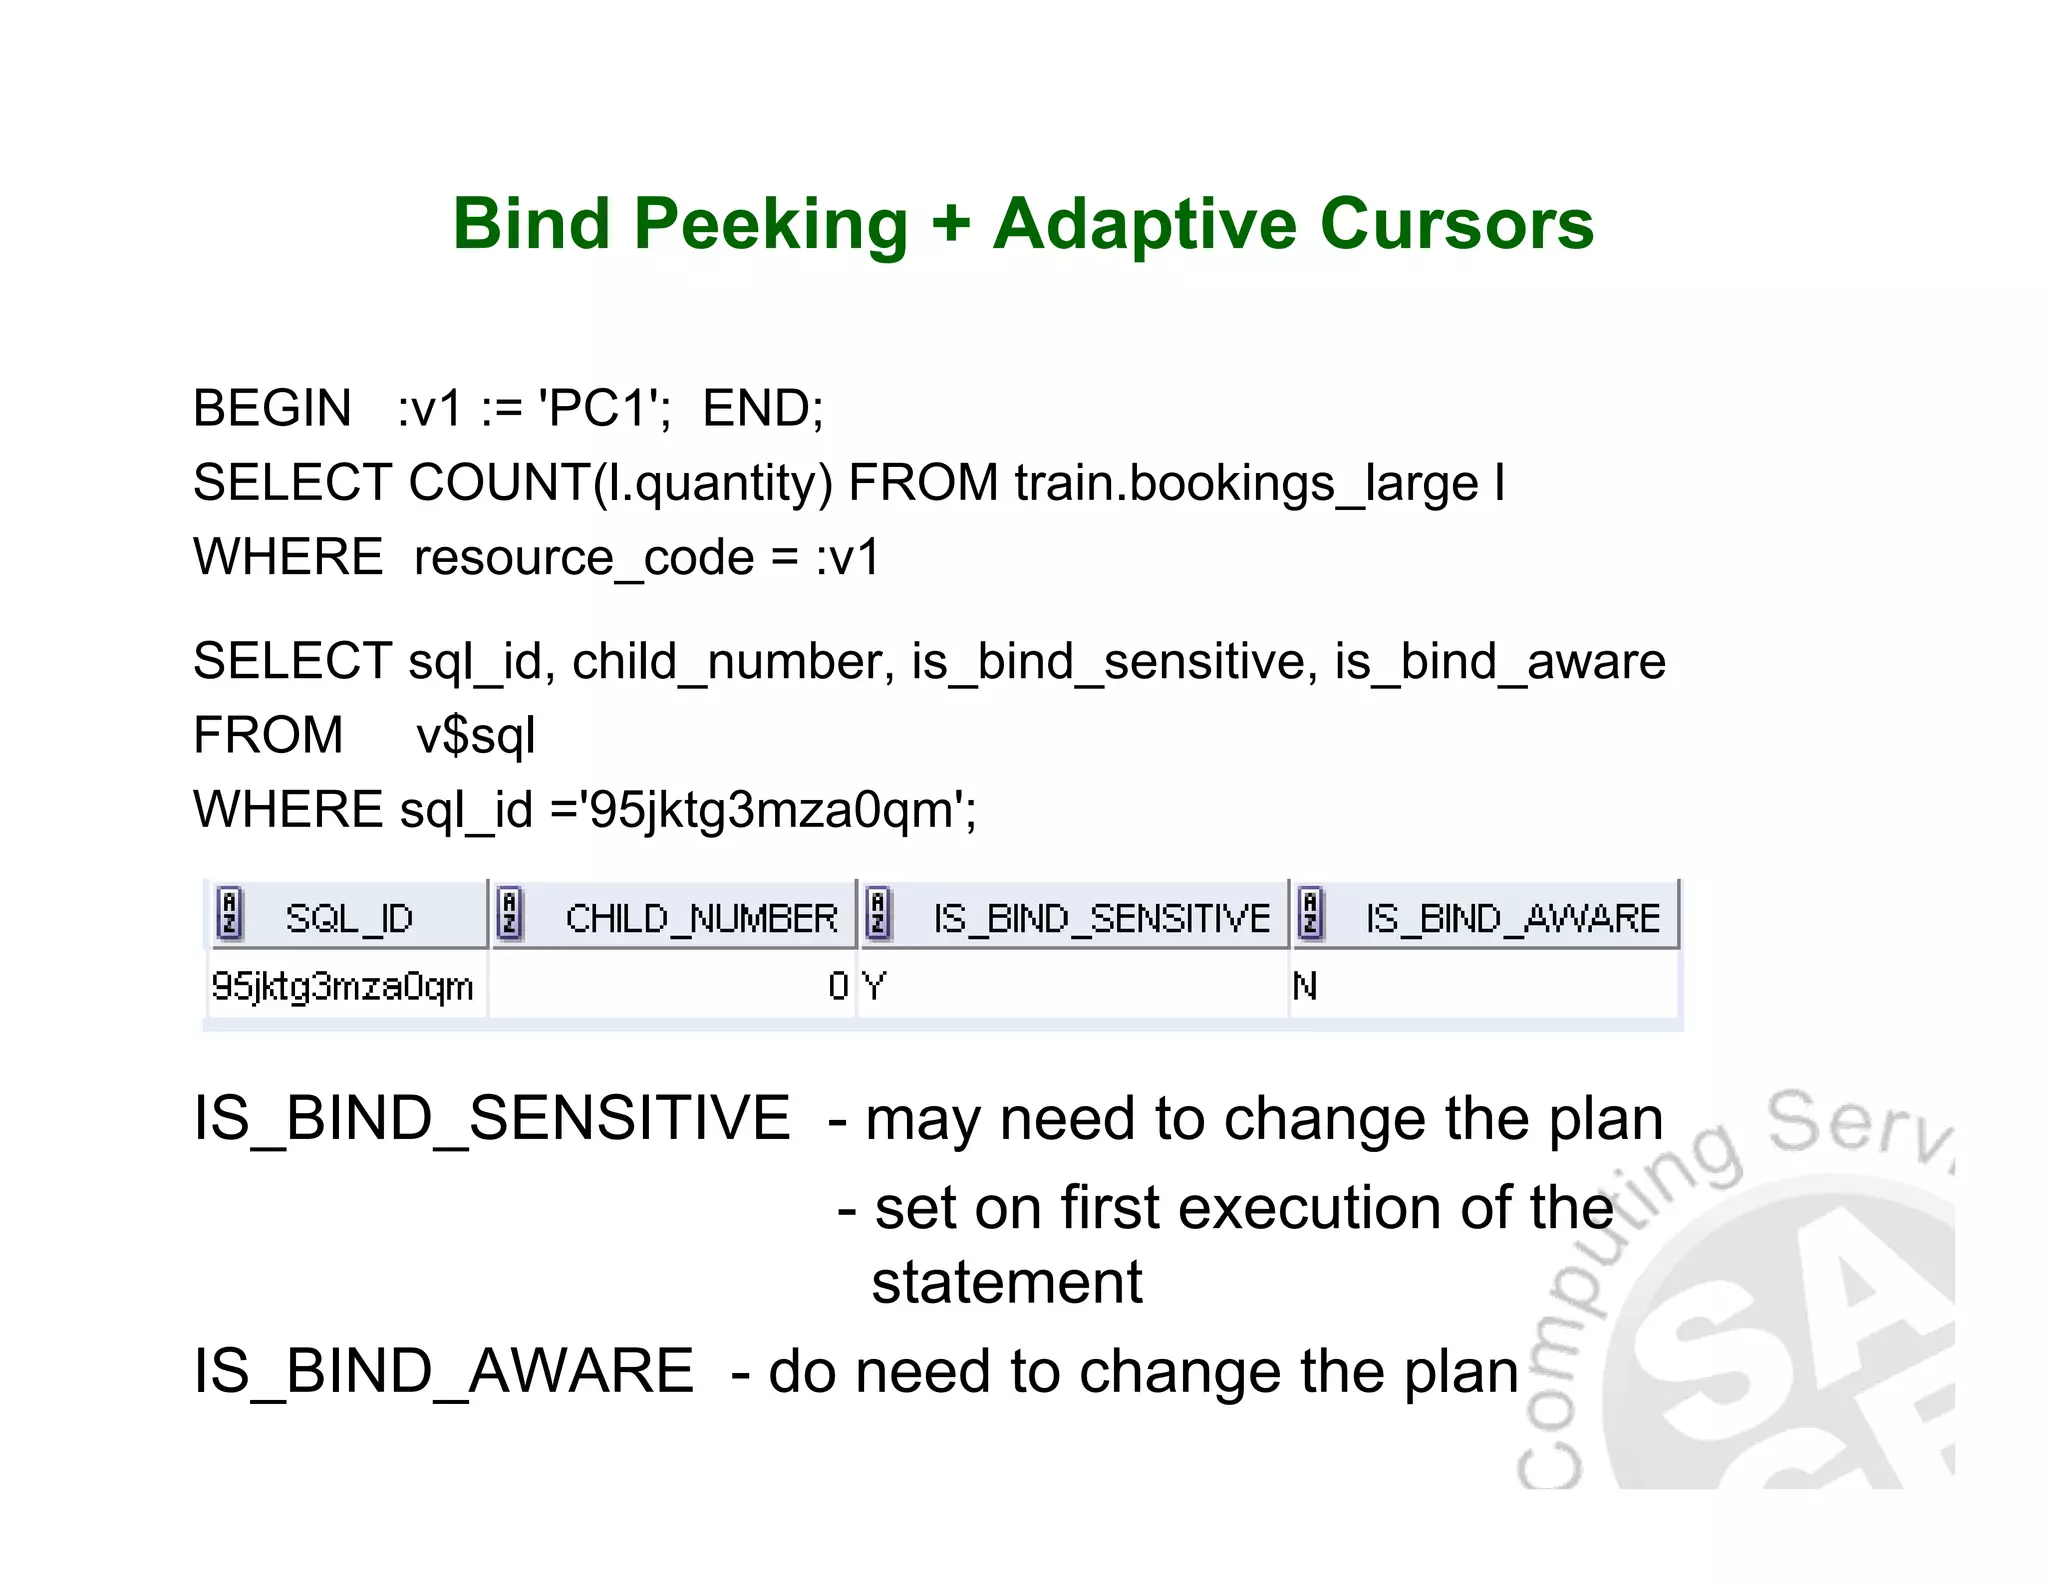
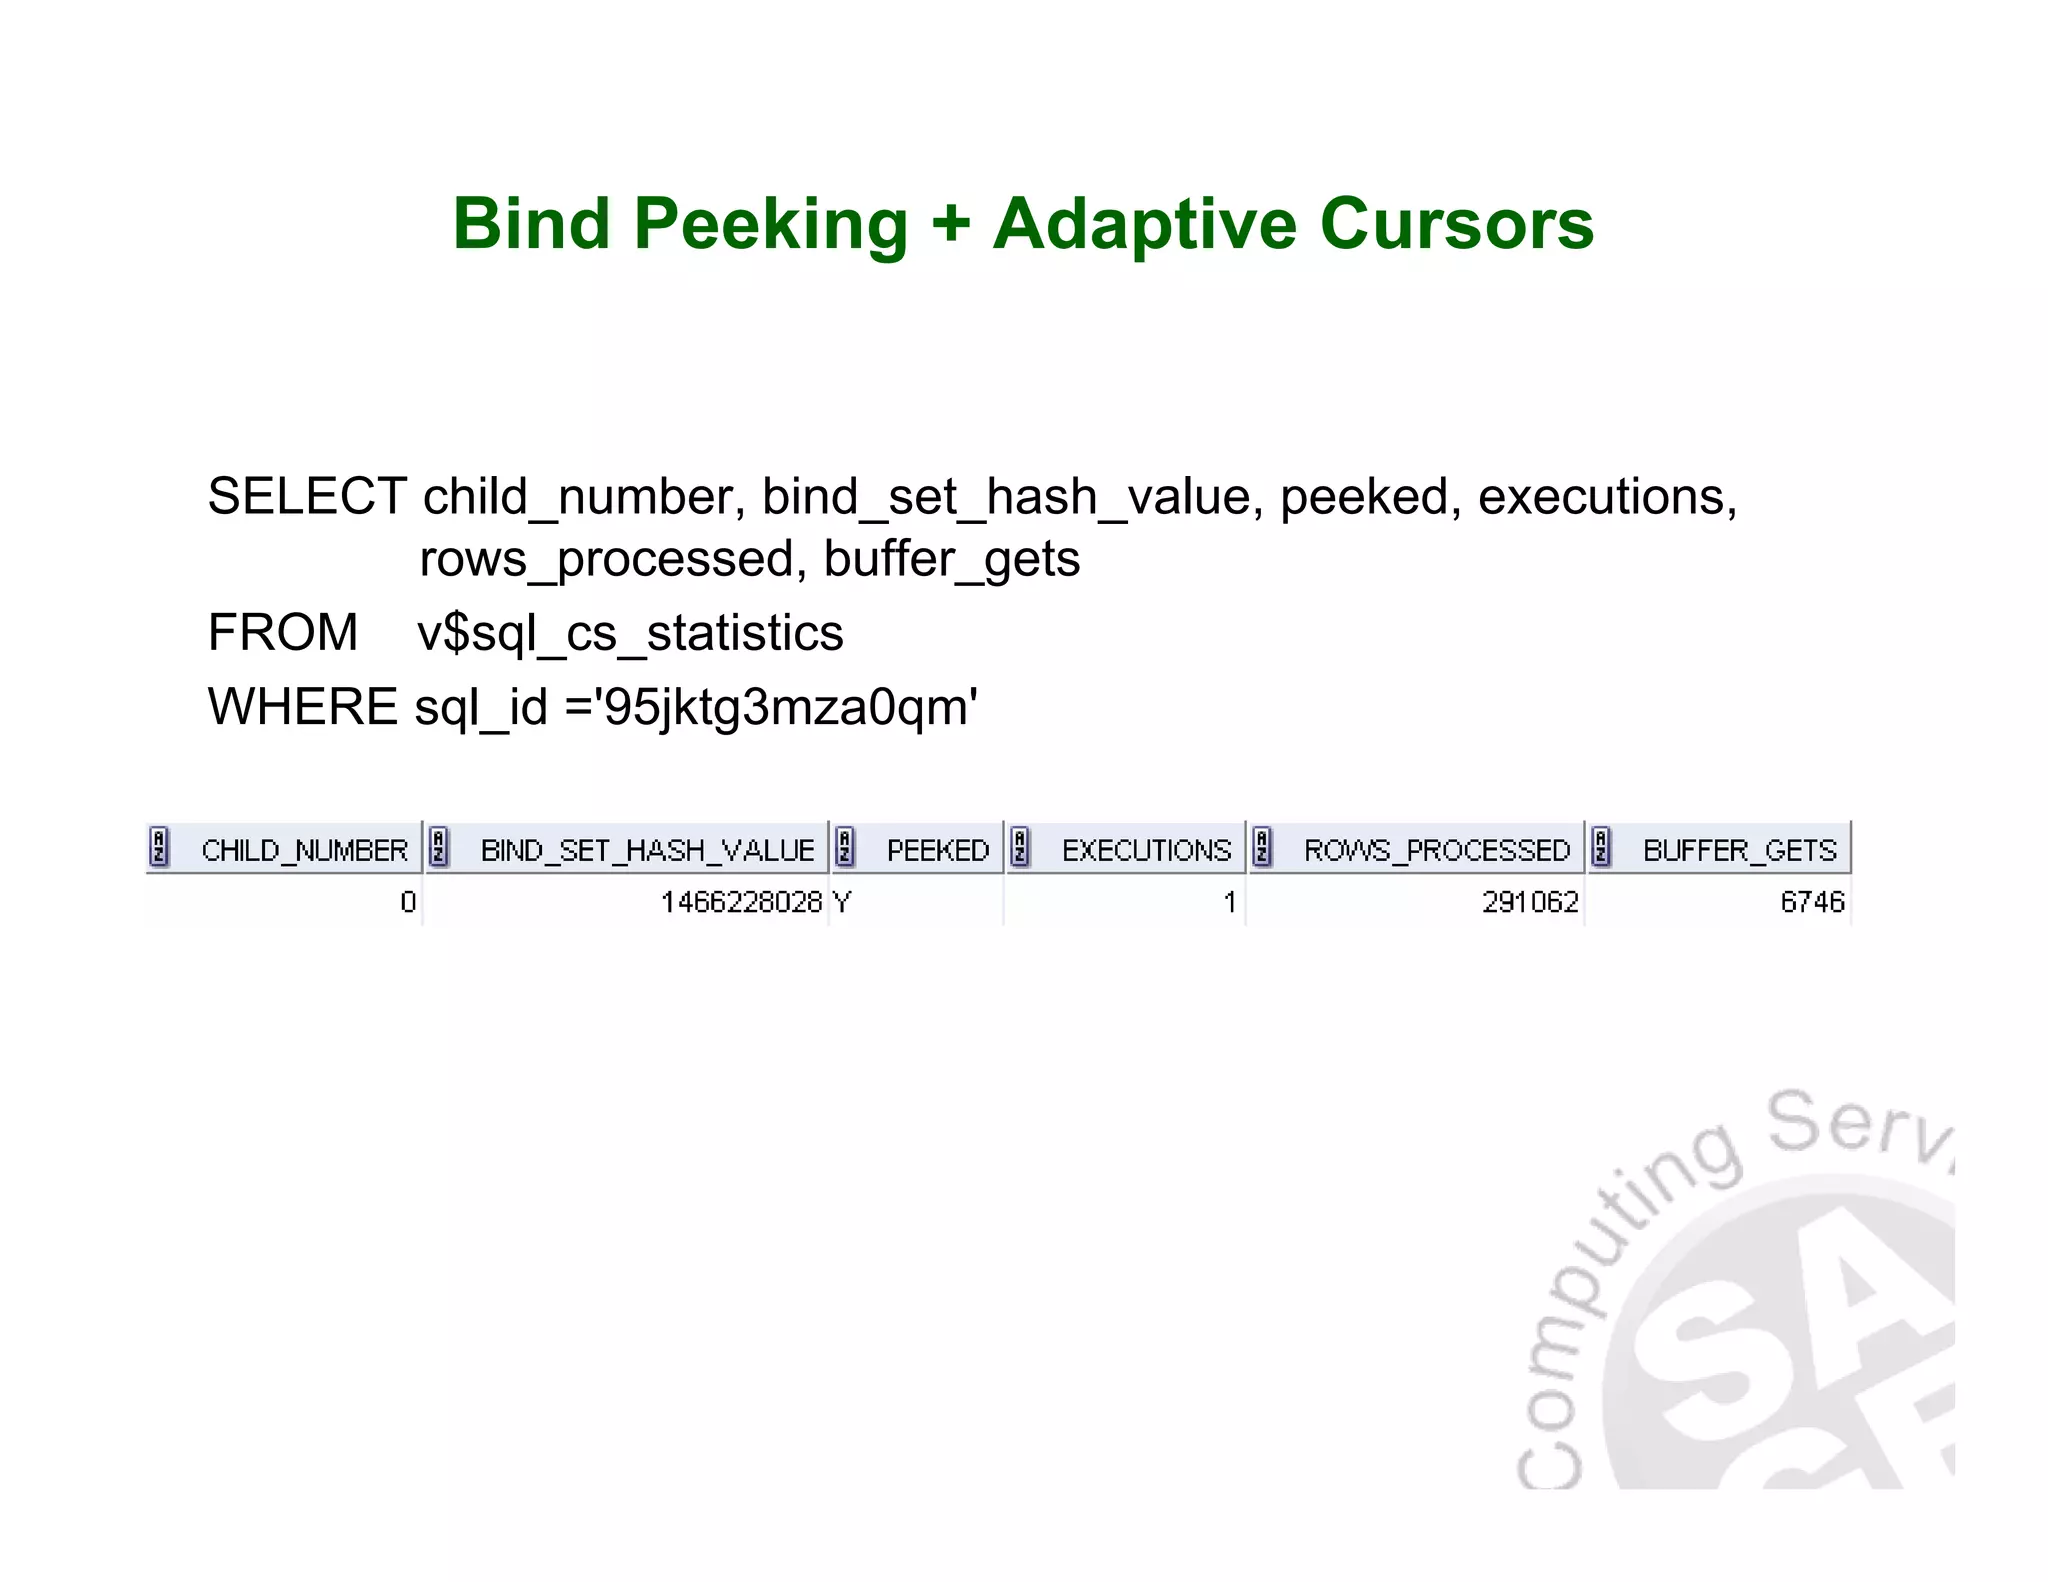
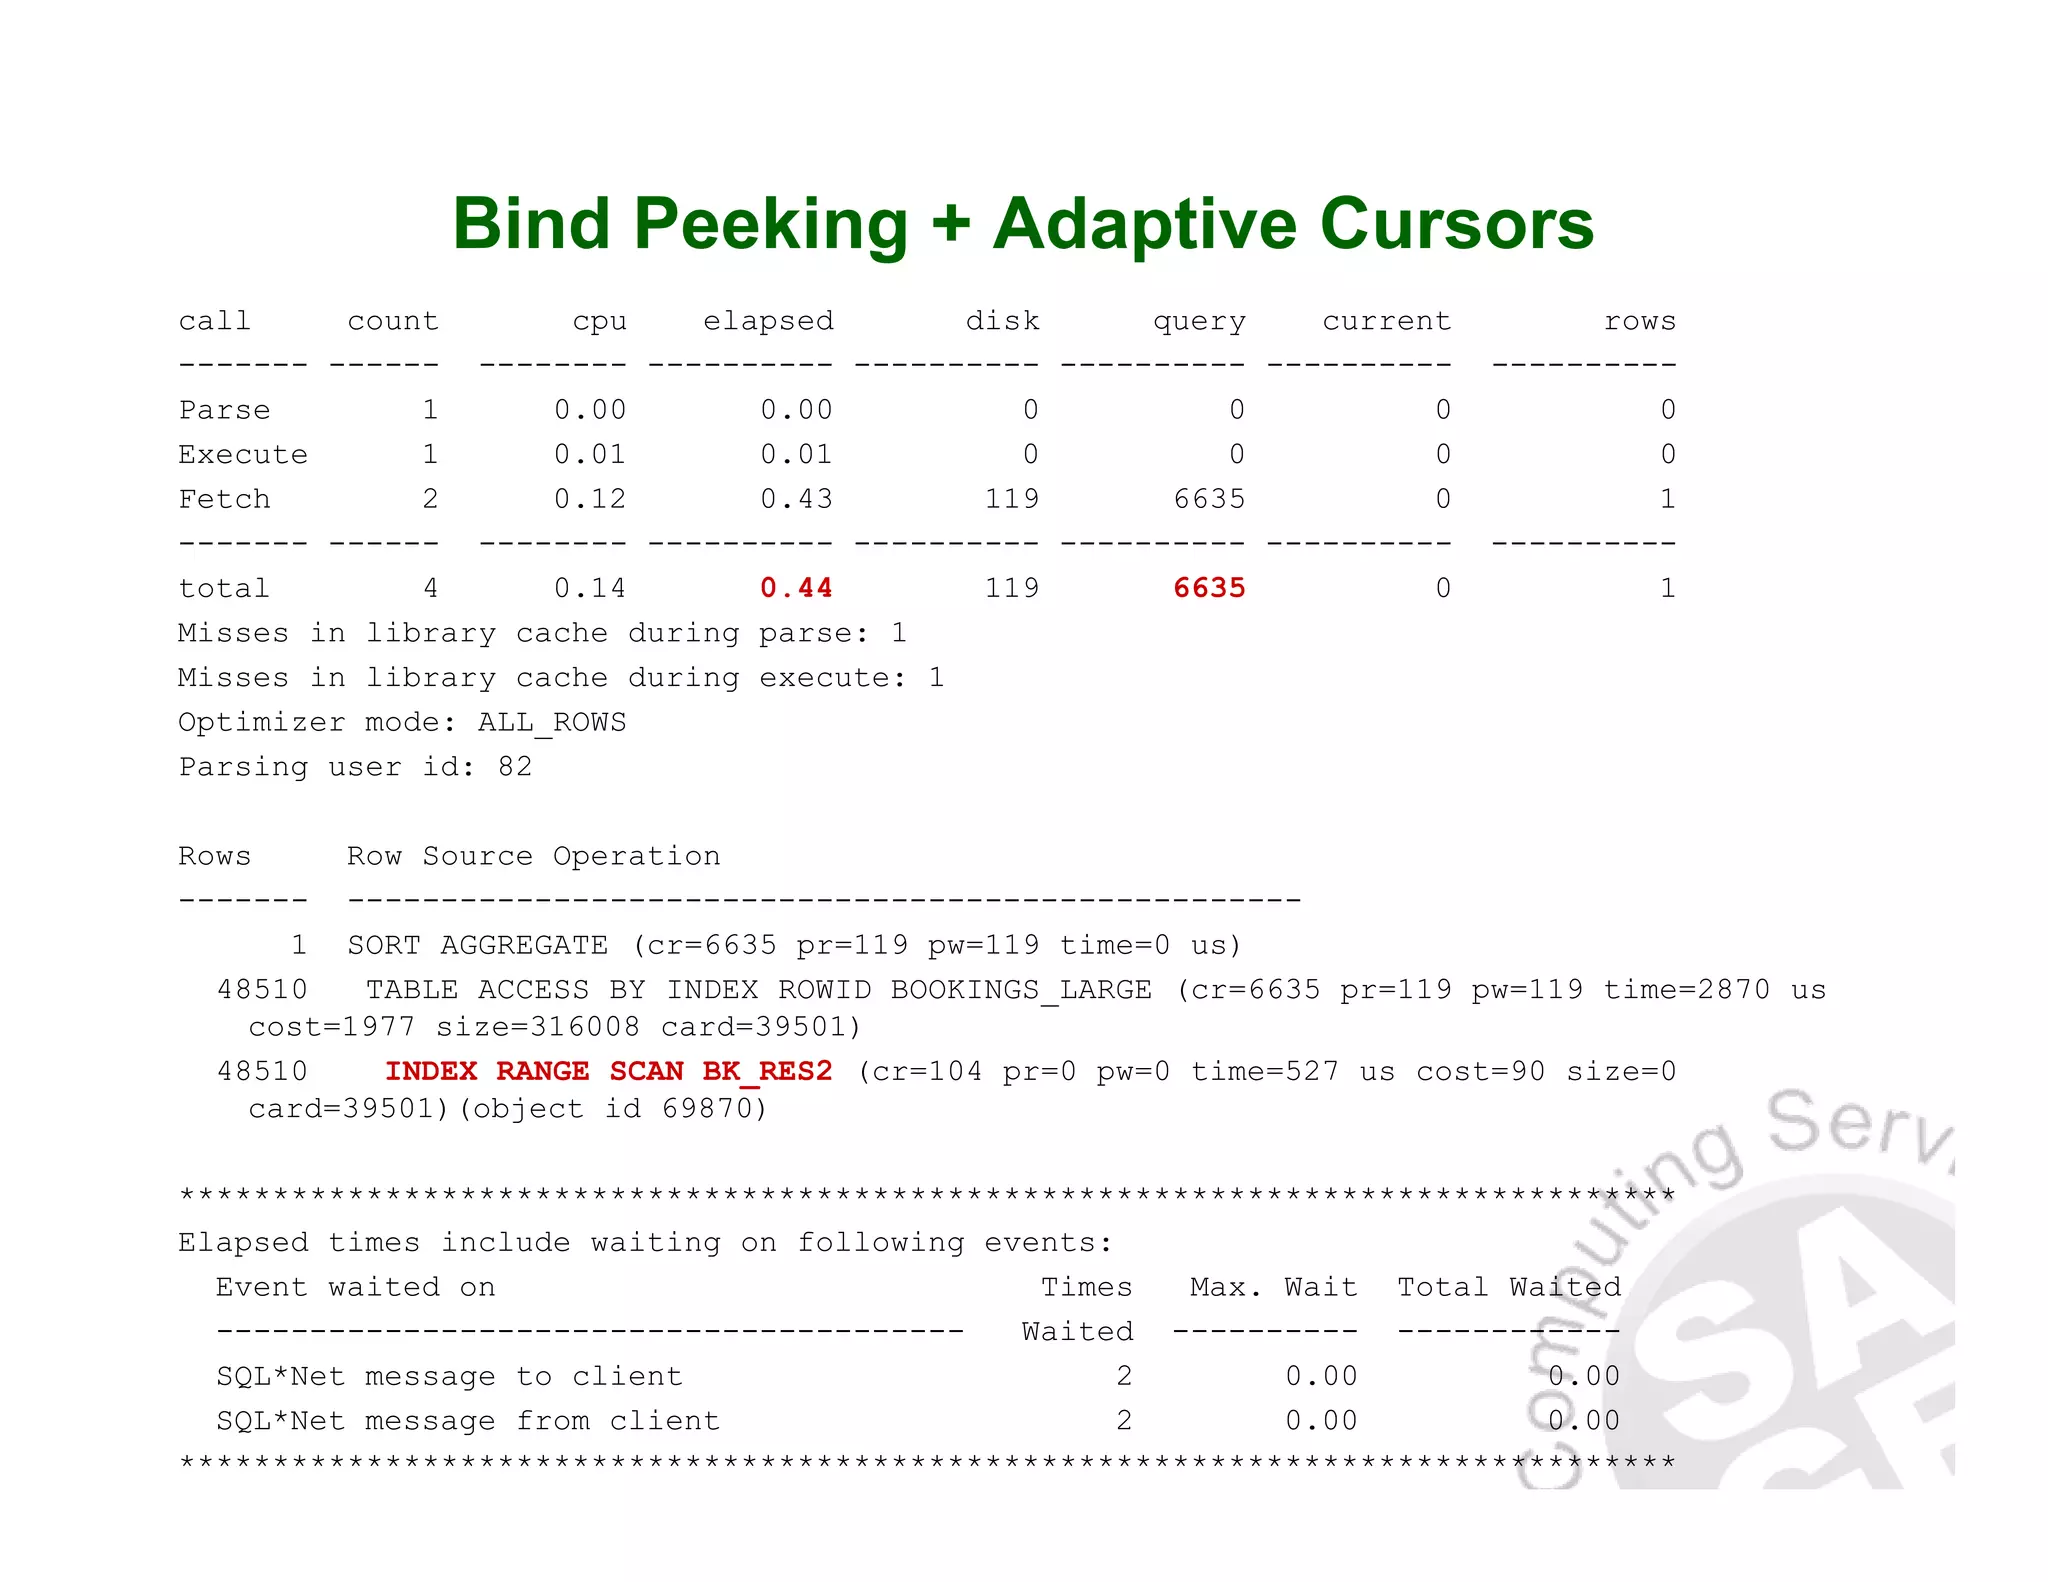
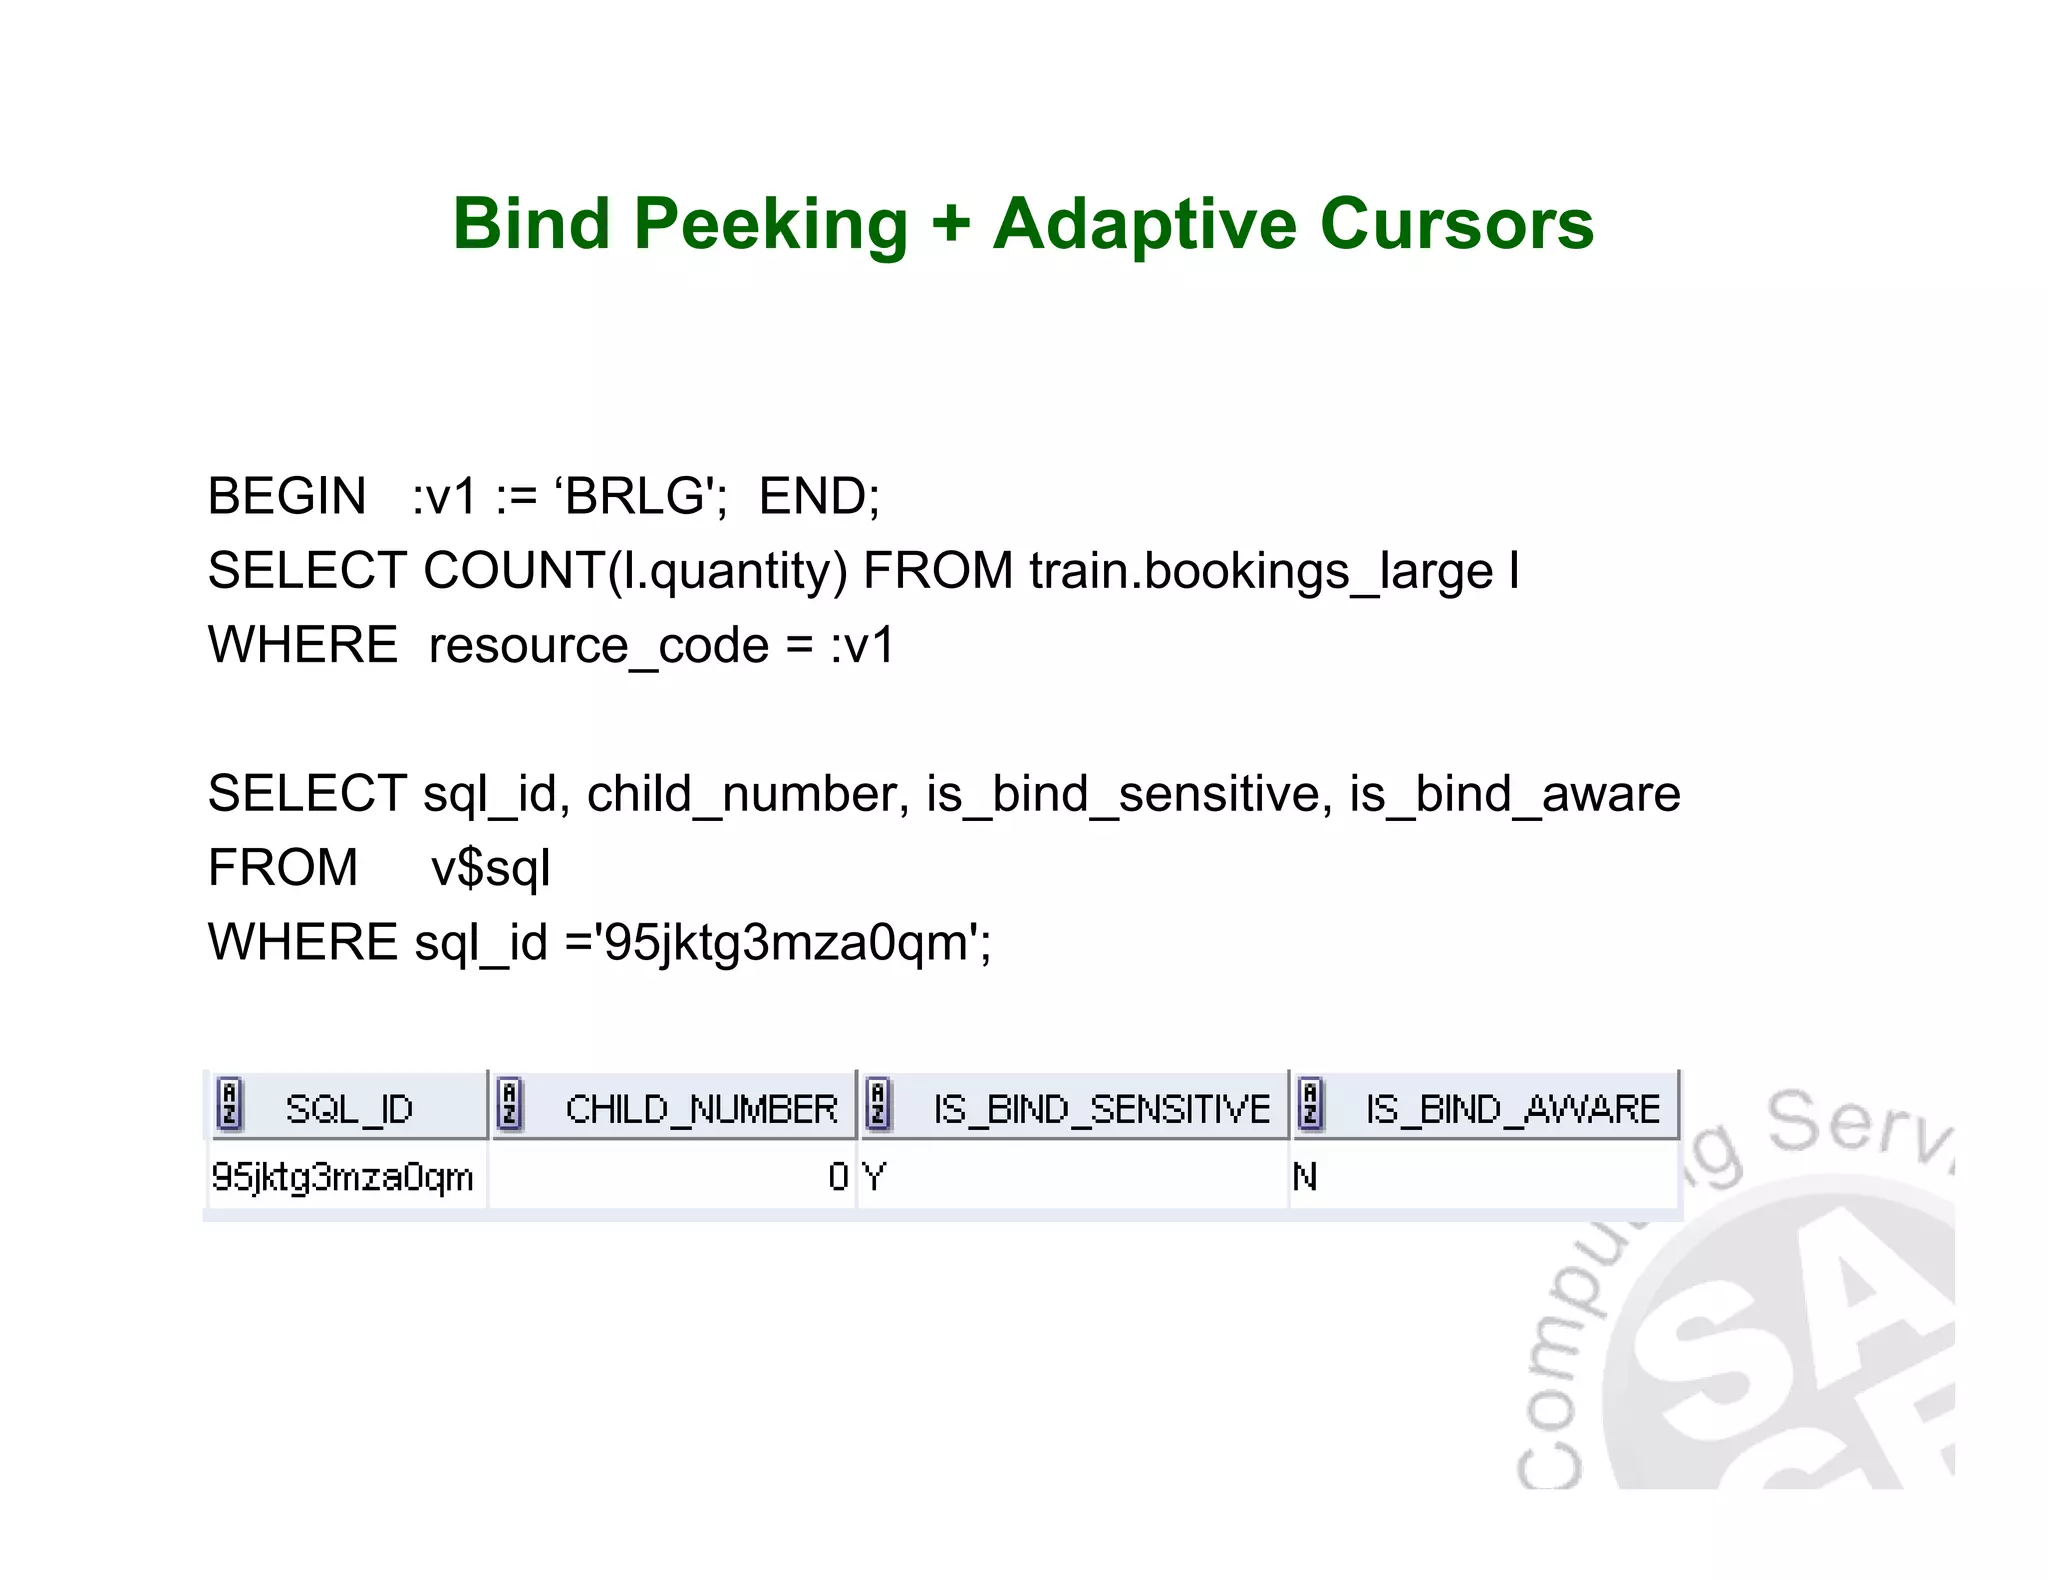

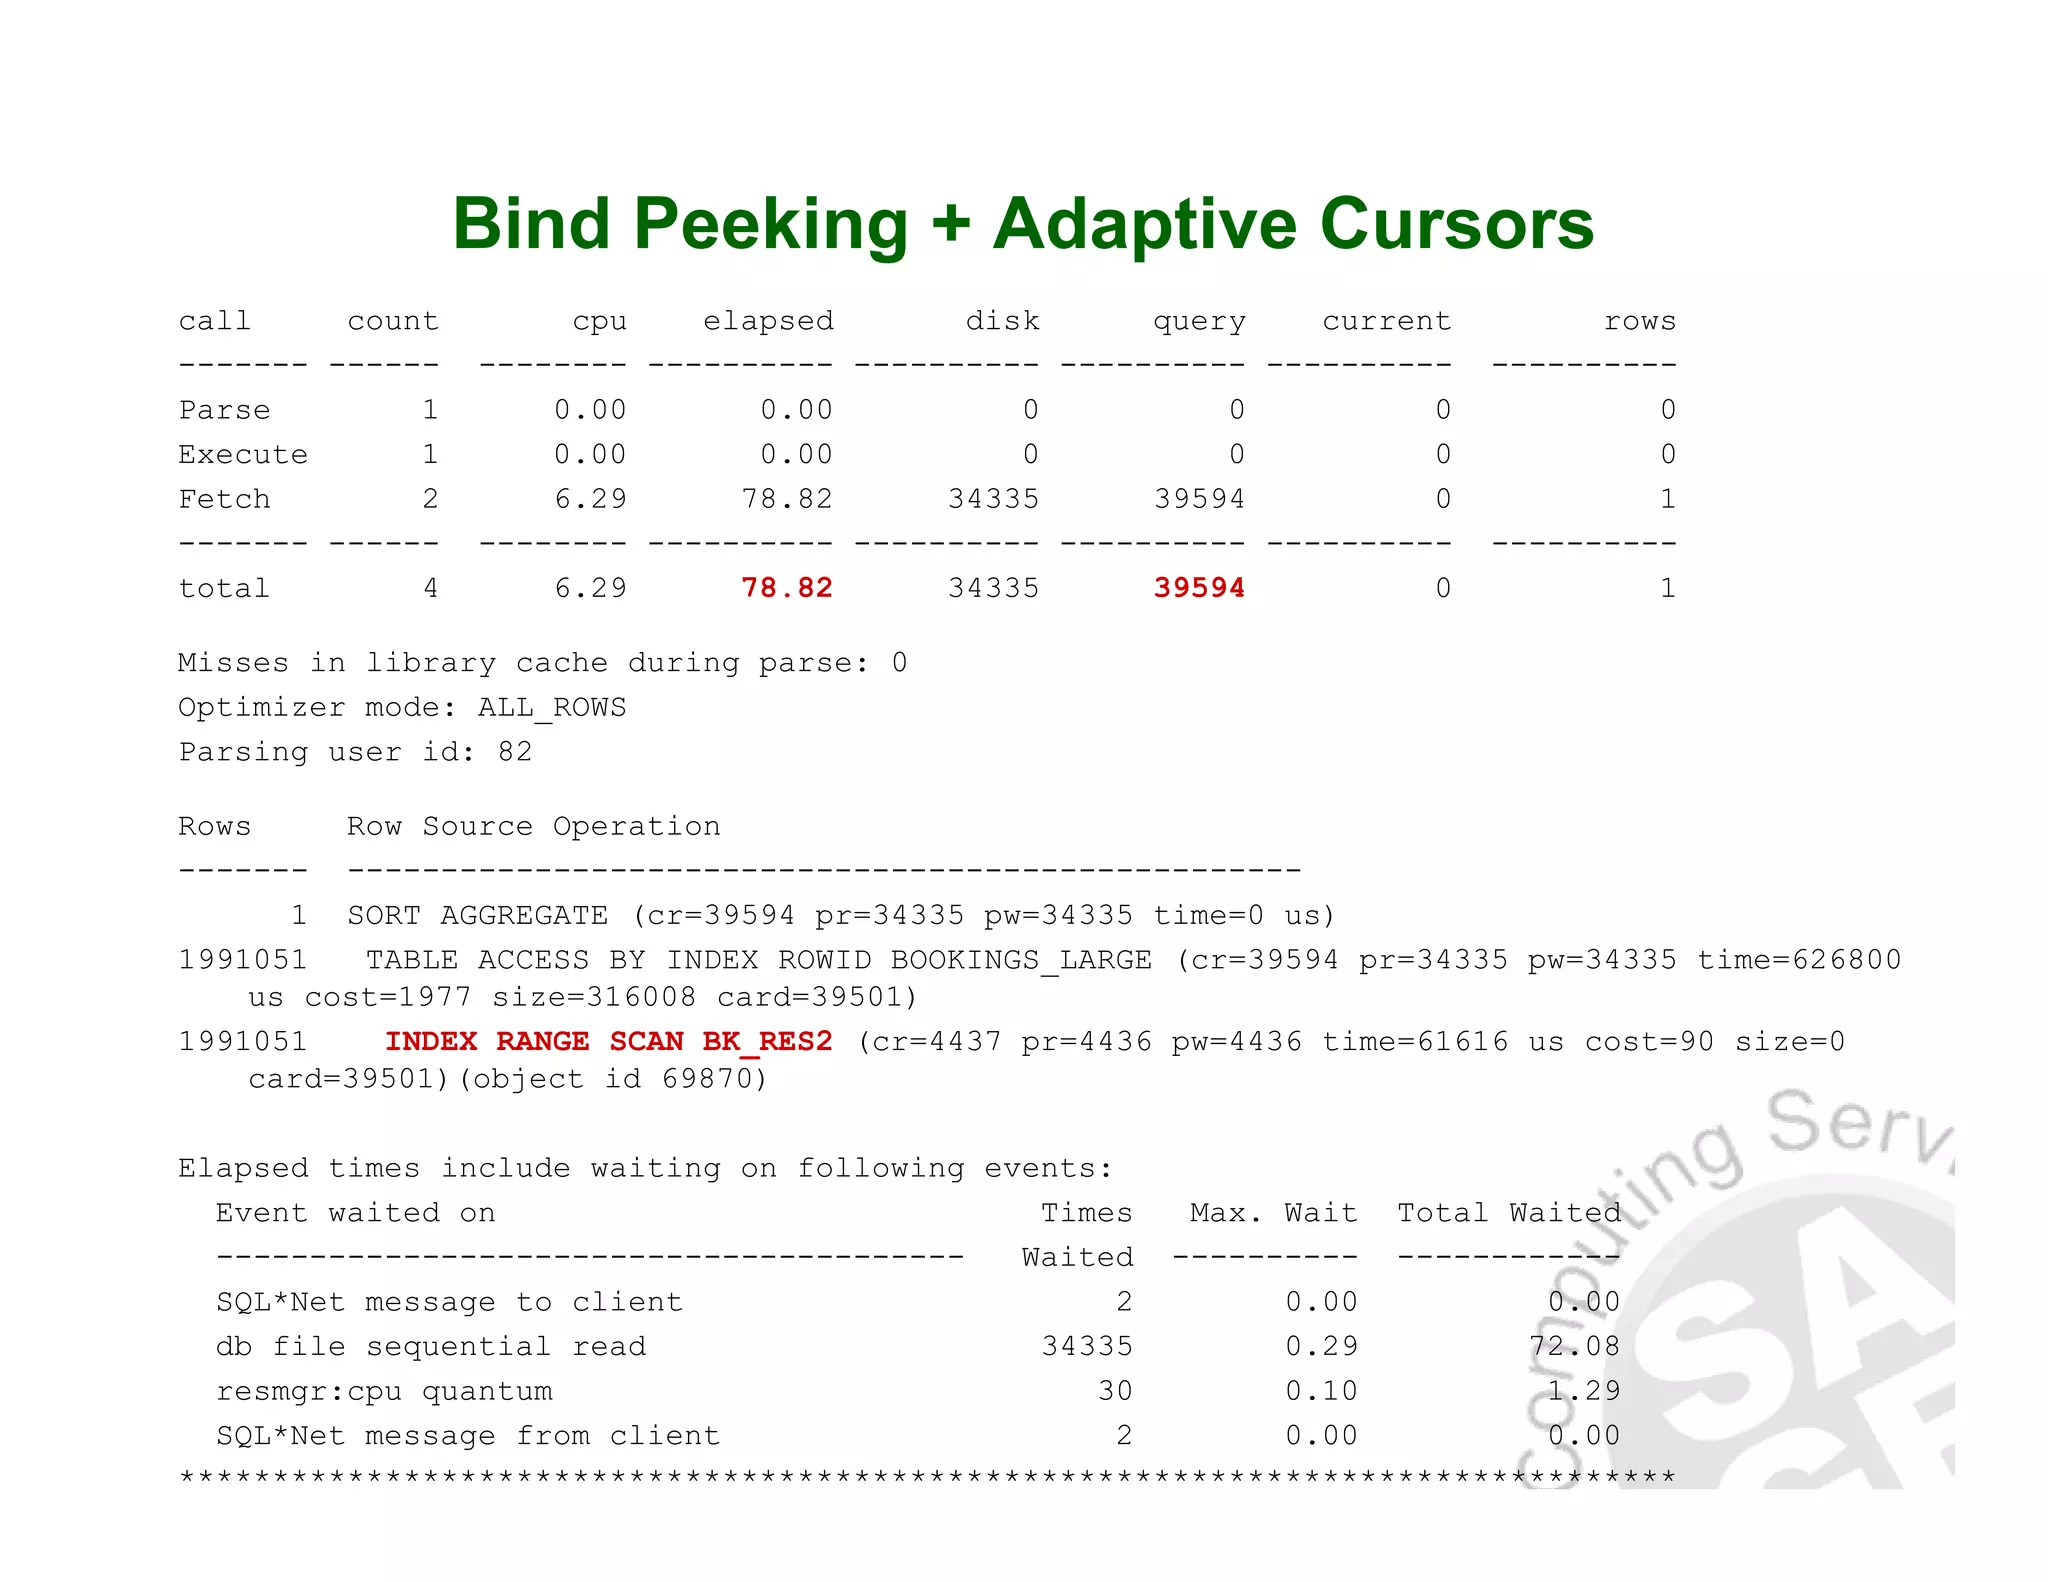
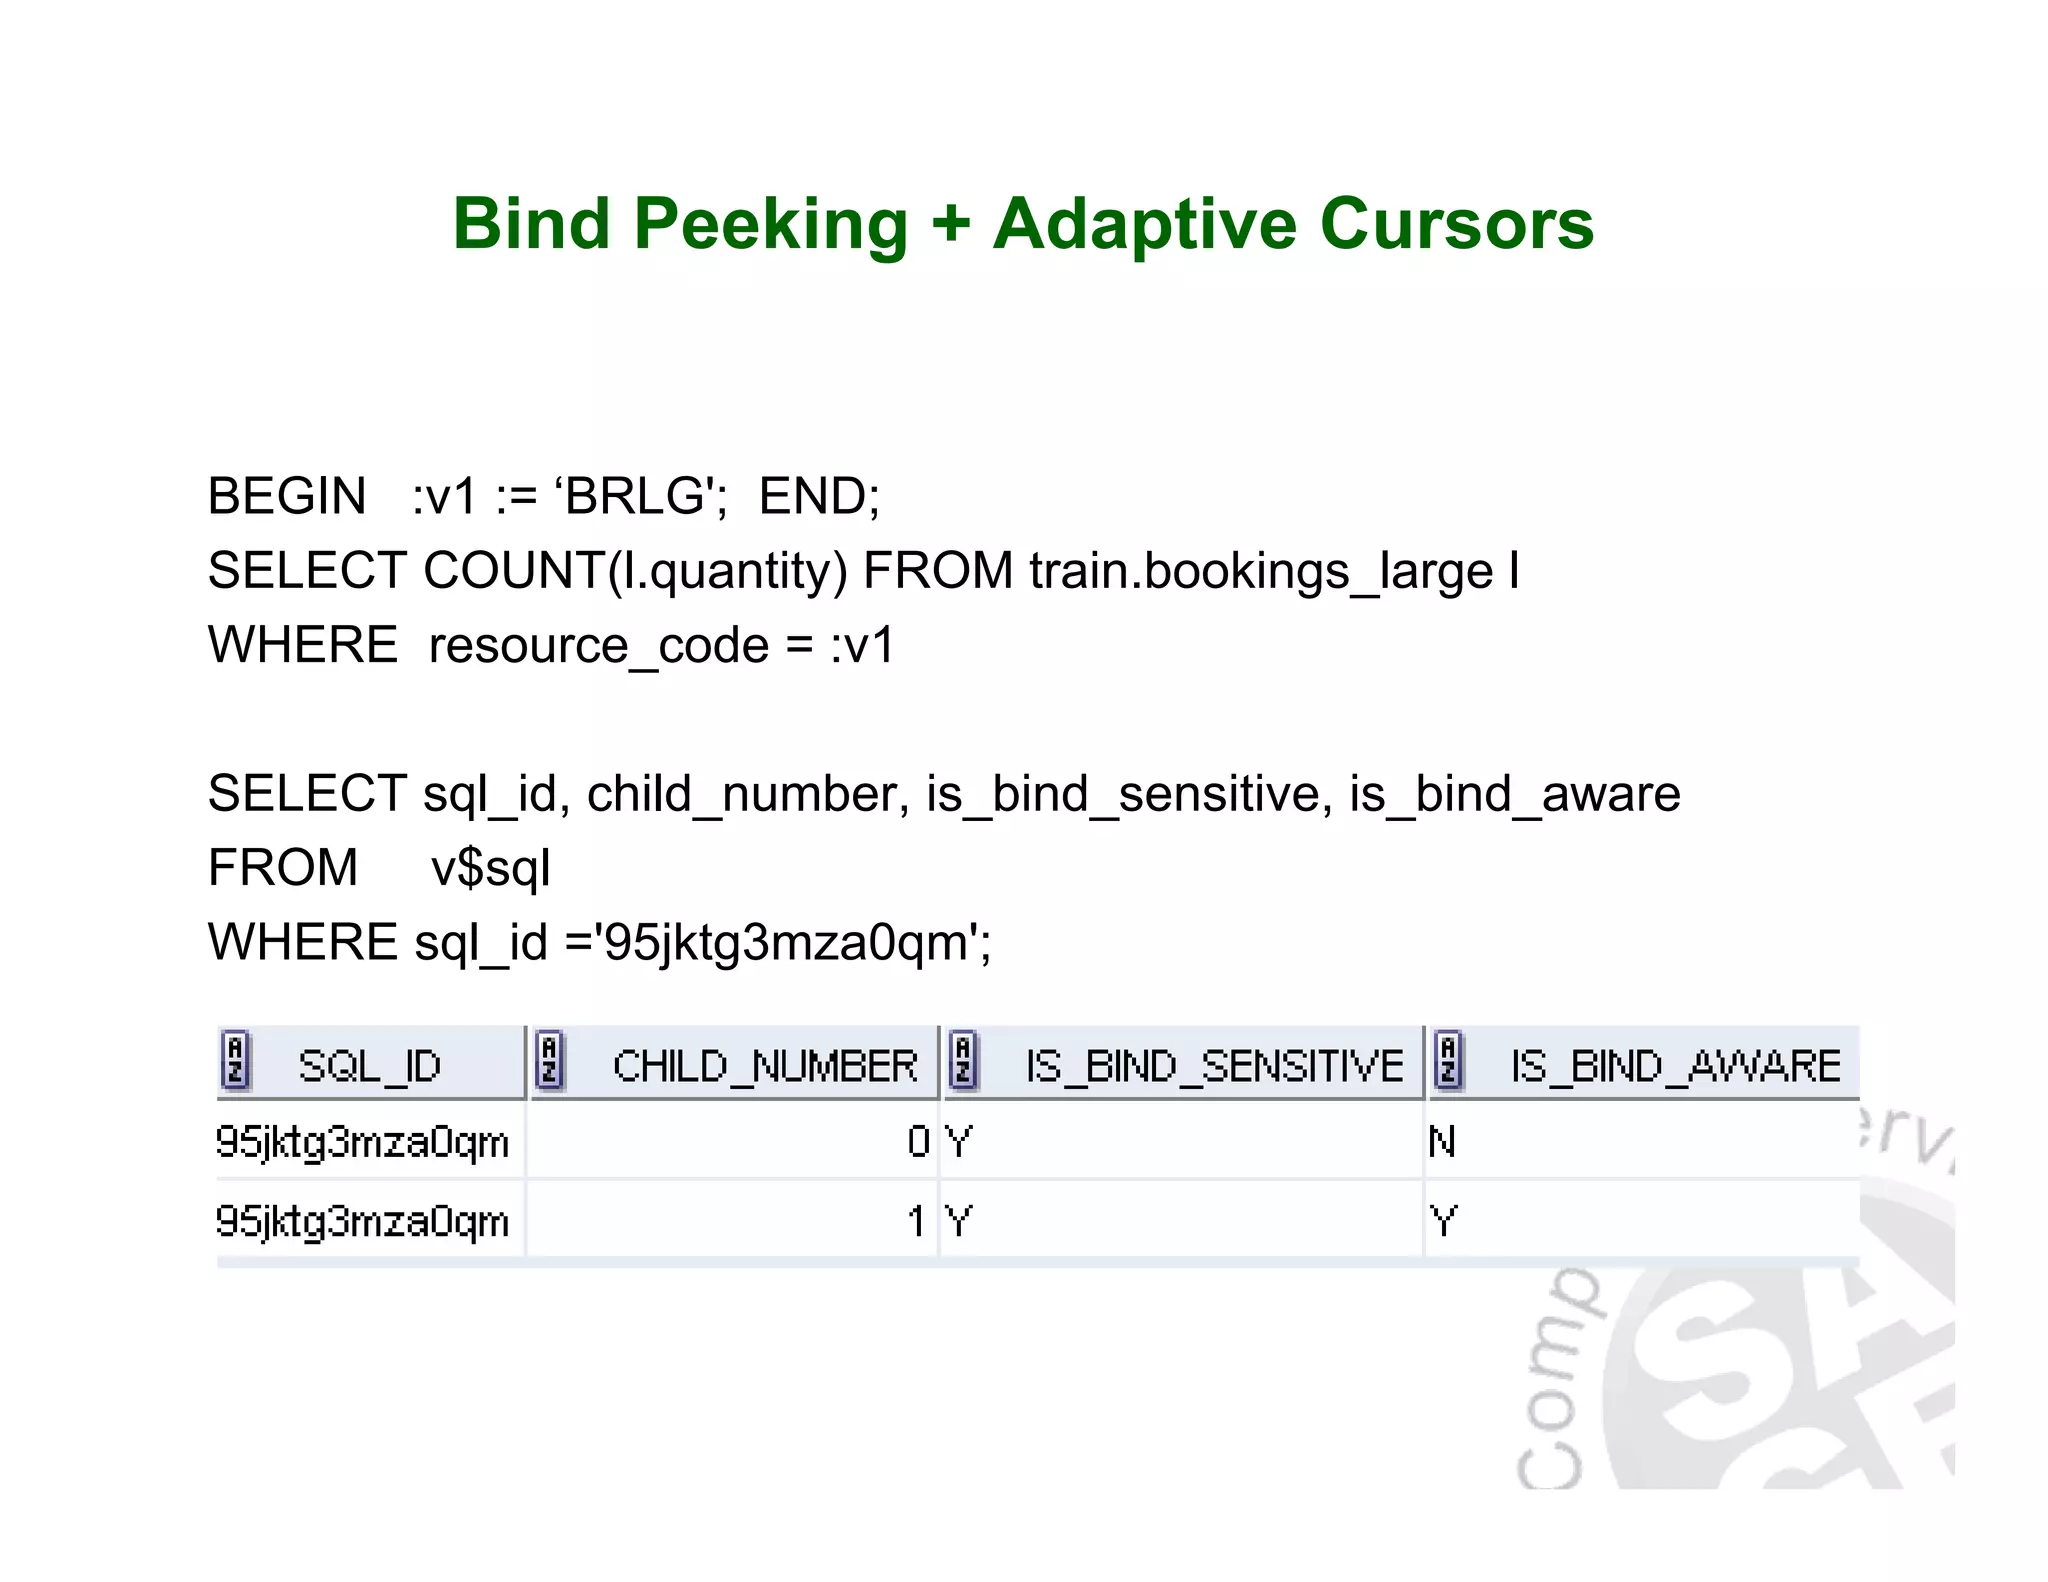
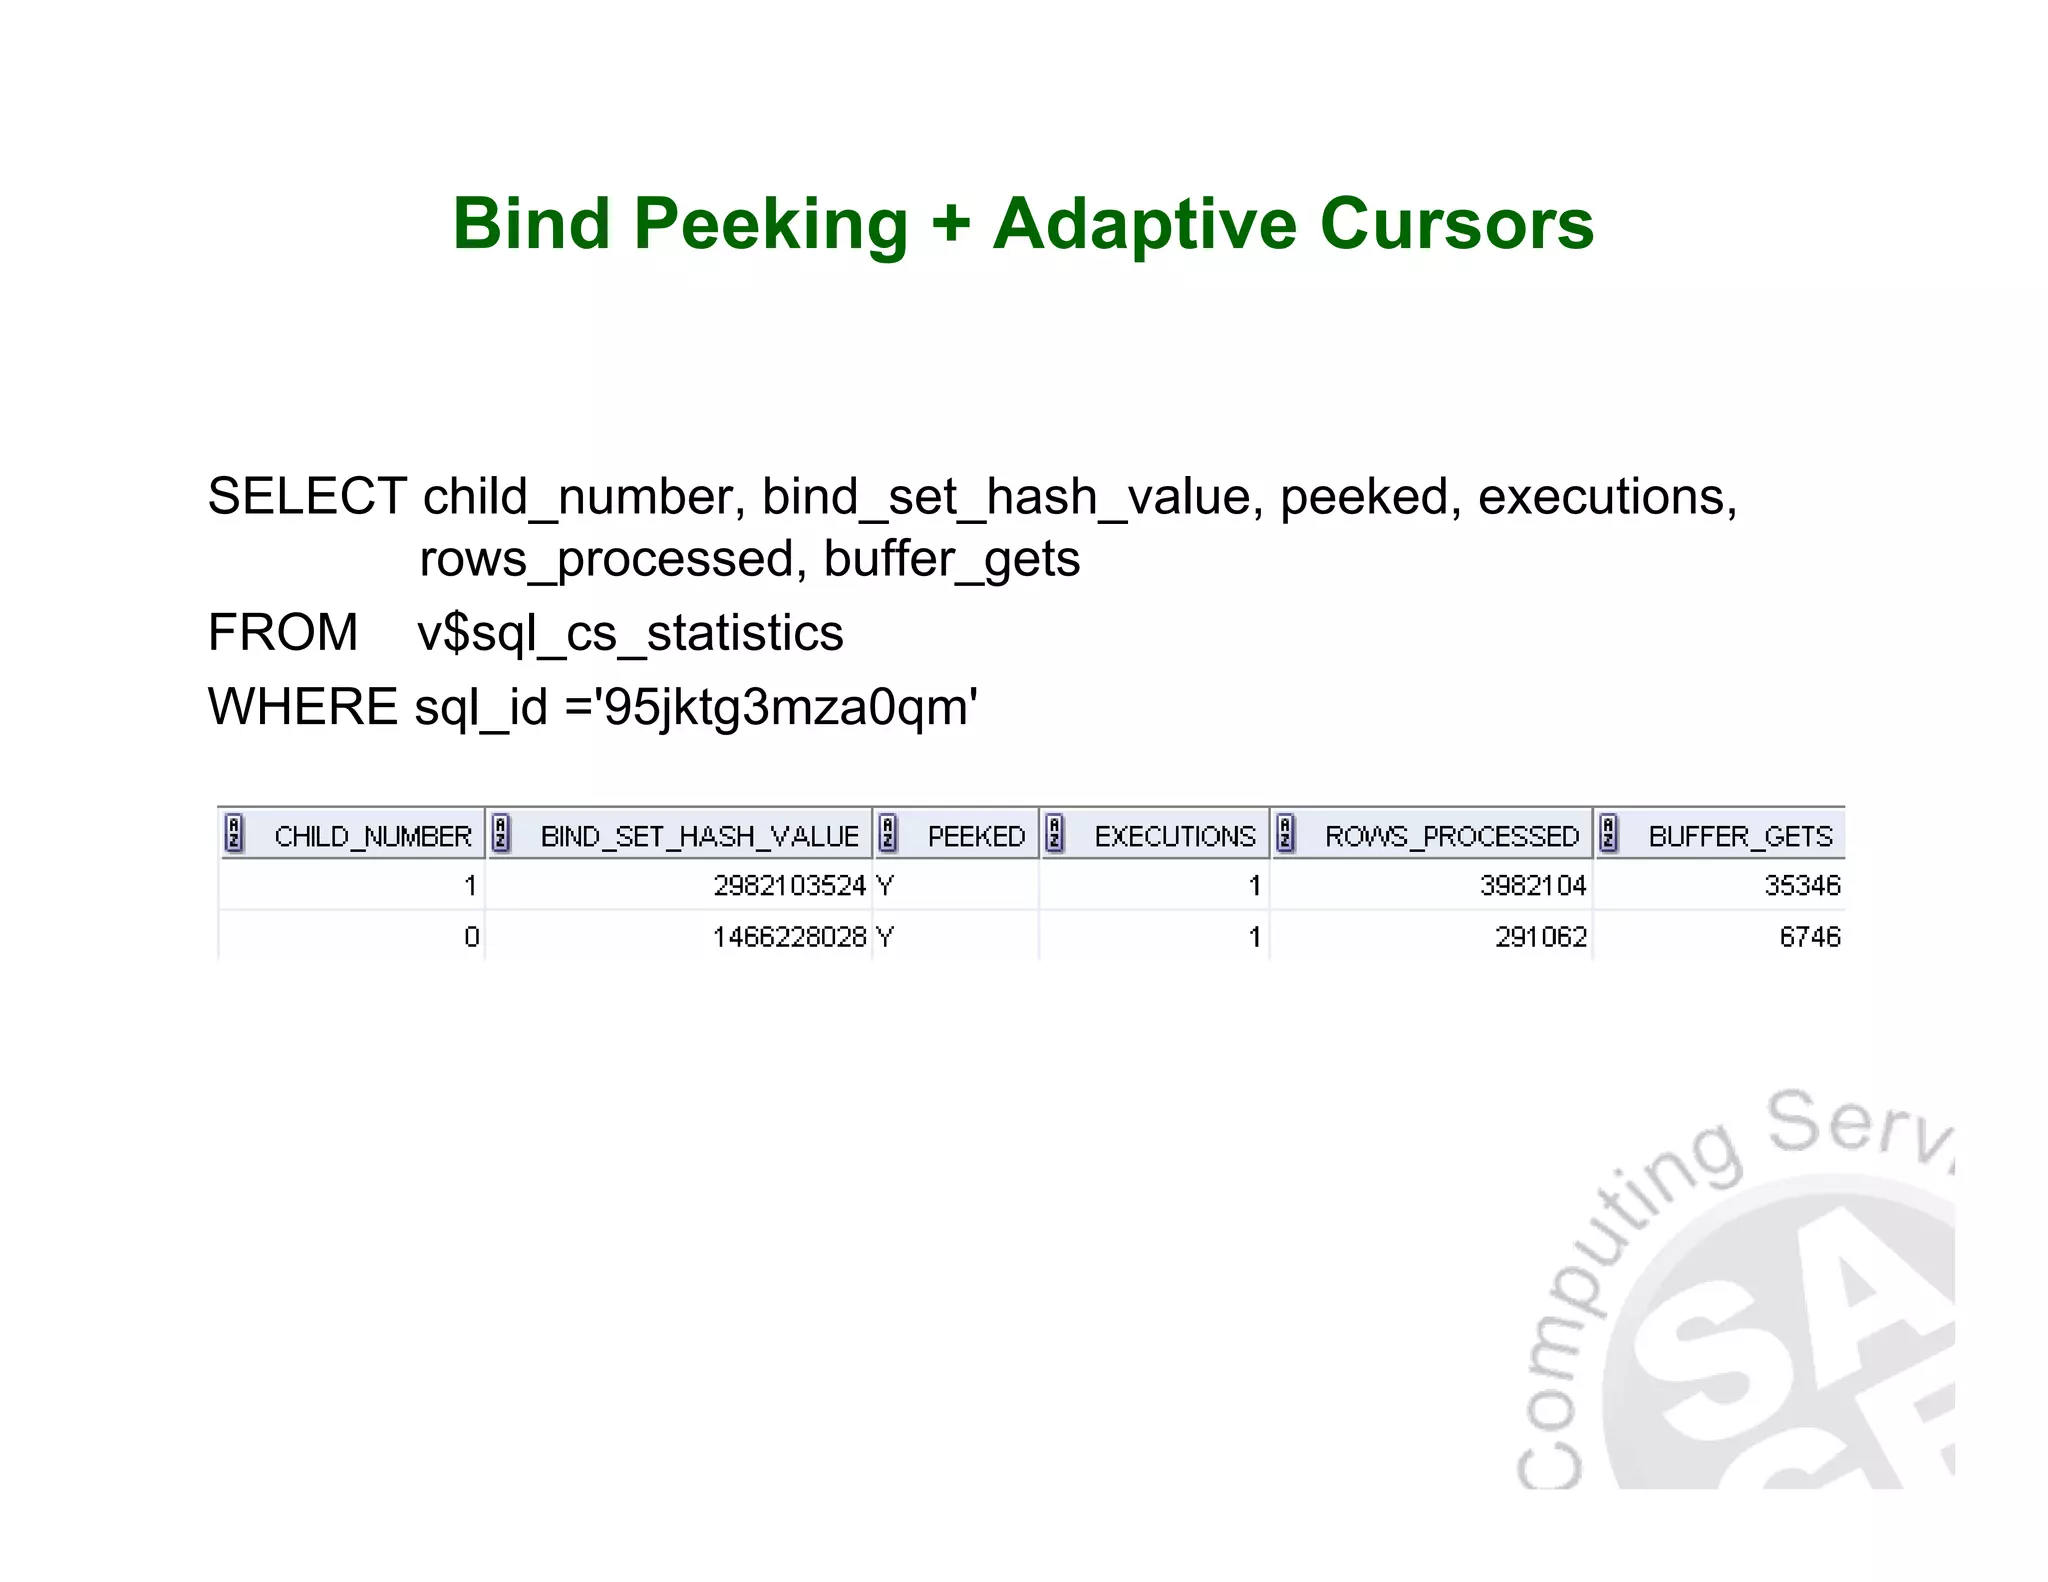
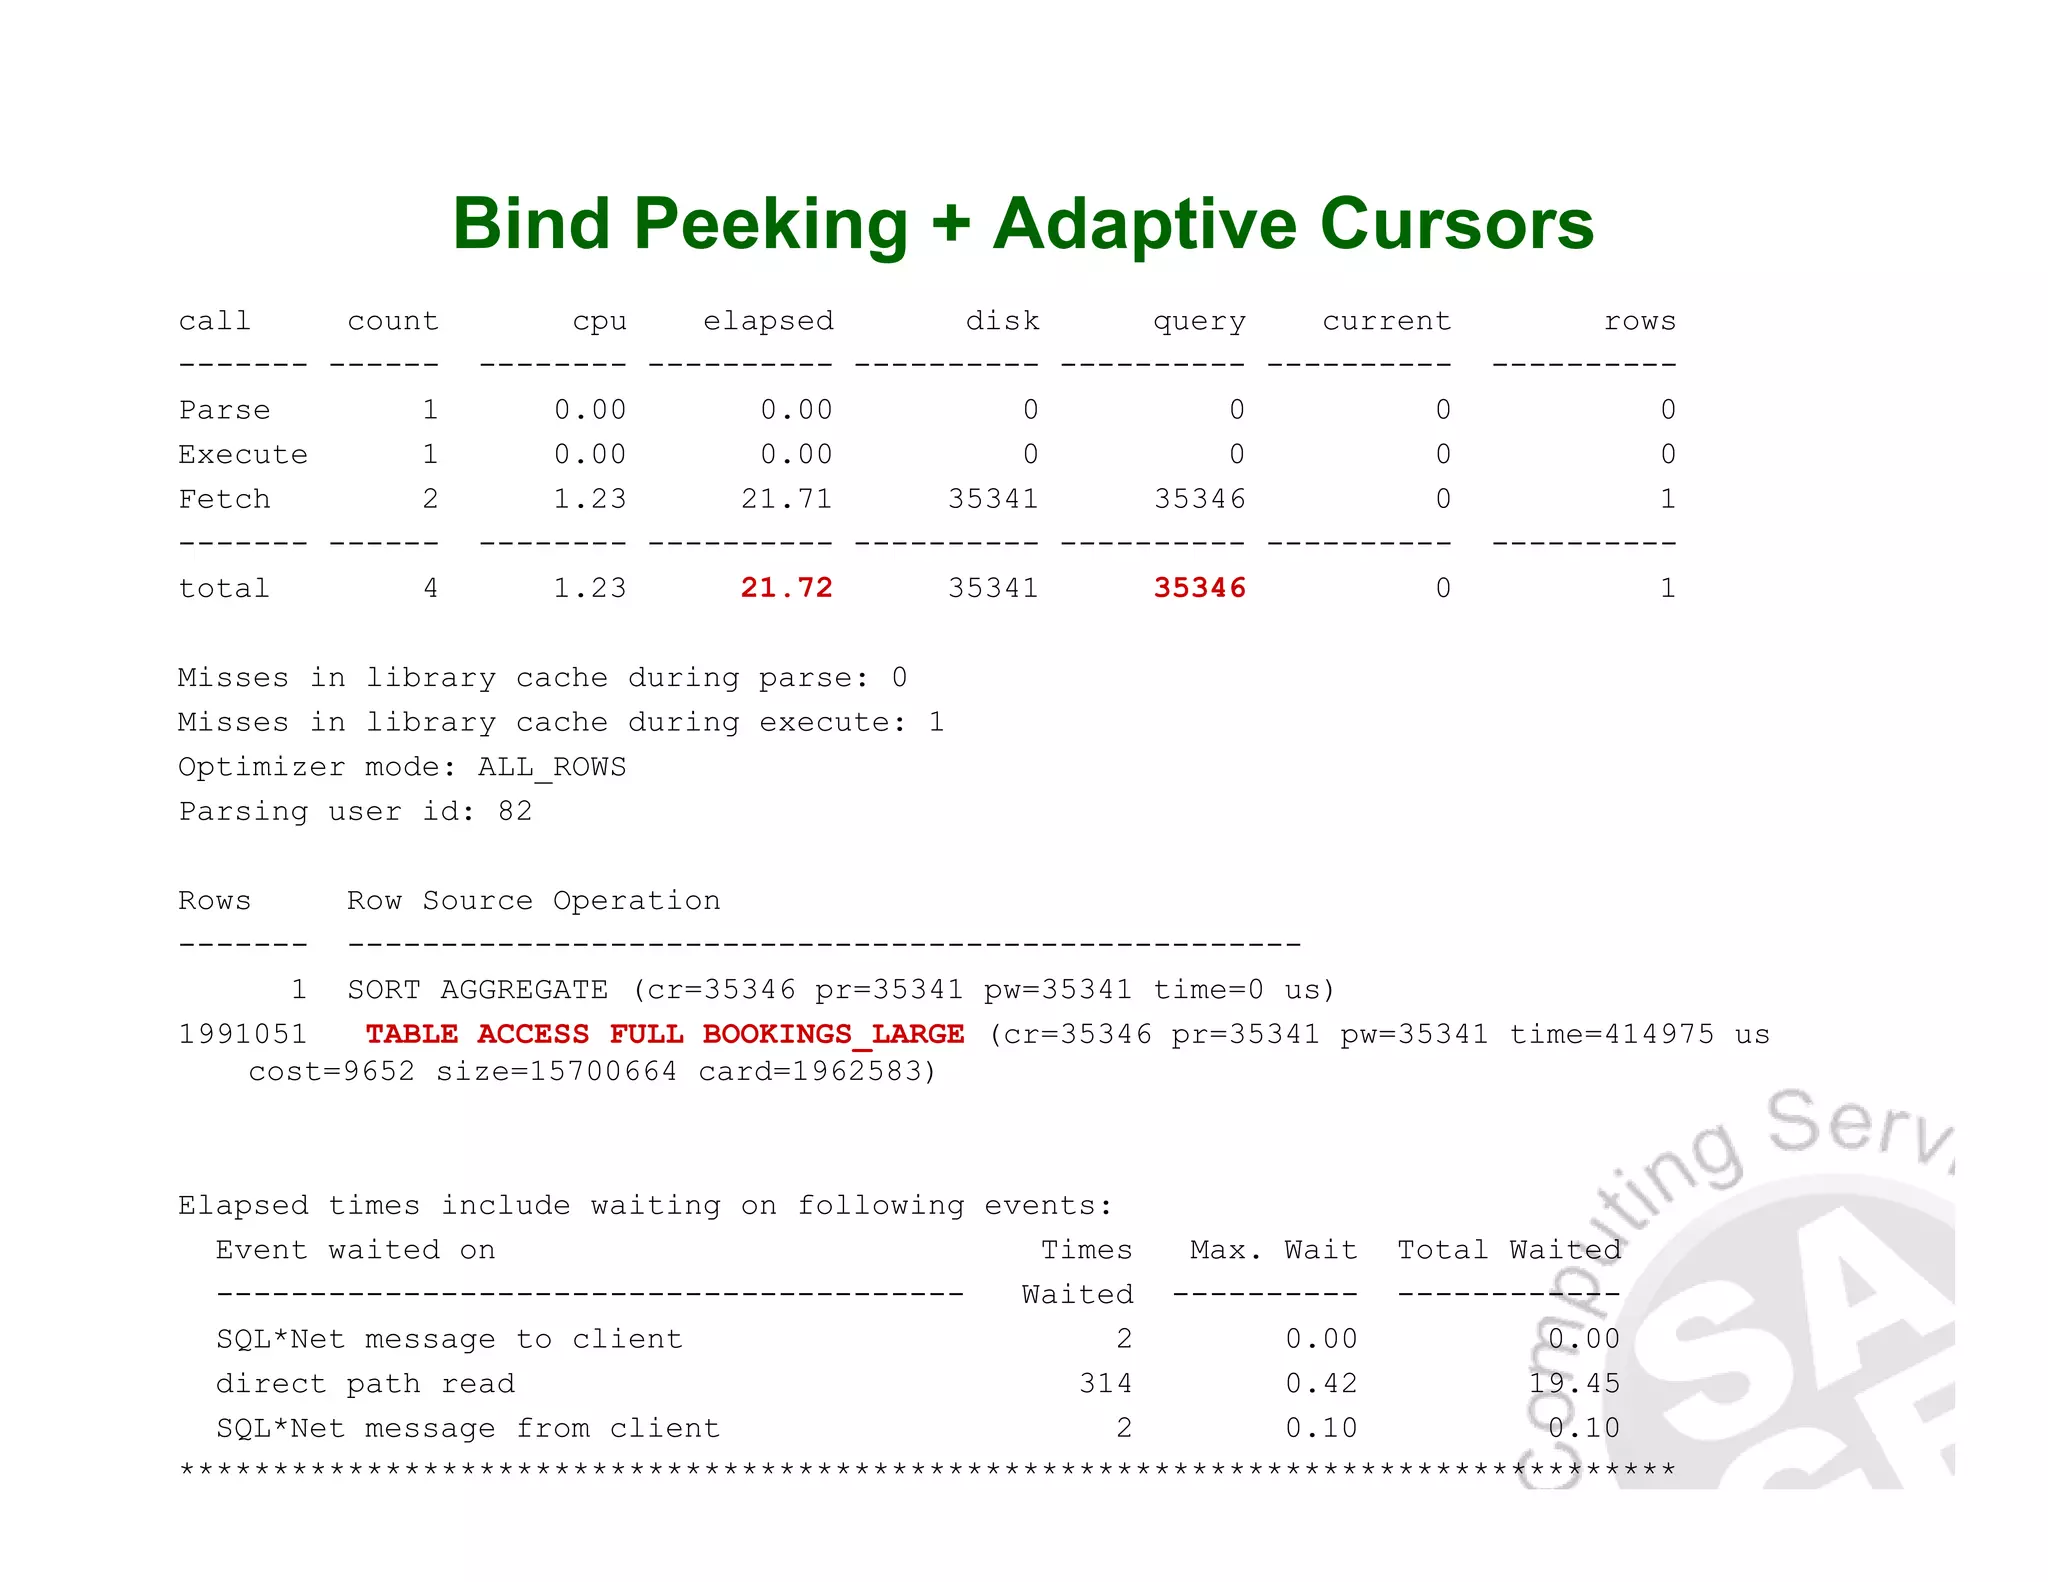


The document discusses advanced Oracle database tuning features in version 11g, emphasizing the use of the Automatic Diagnostic Repository (ADR) for diagnostic information management. It covers techniques such as bind peeking and adaptive cursors, detailing how they influence SQL execution plans and performance. The document also explores the importance of multi-column statistics in optimizing query performance across complex database joins.