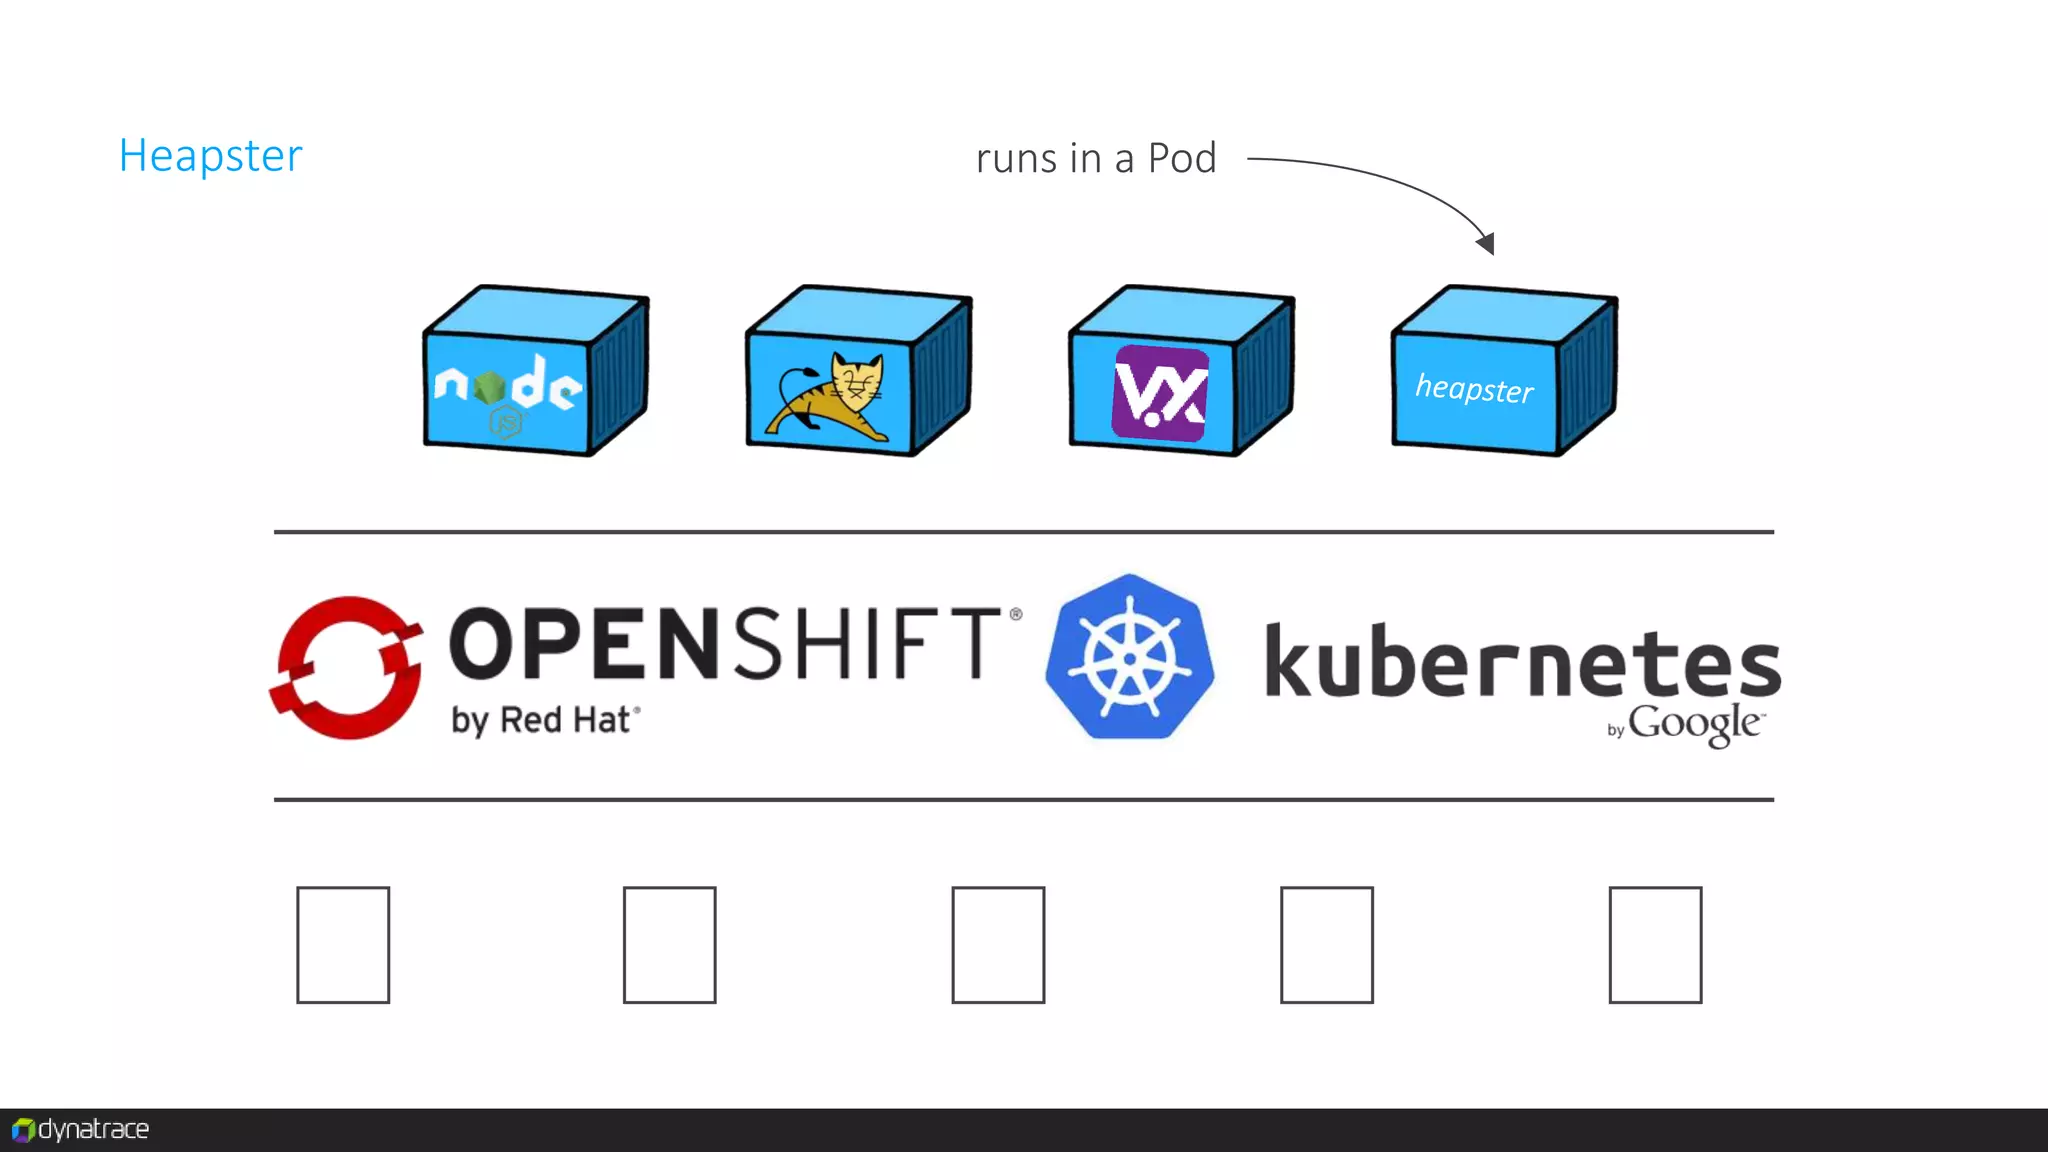
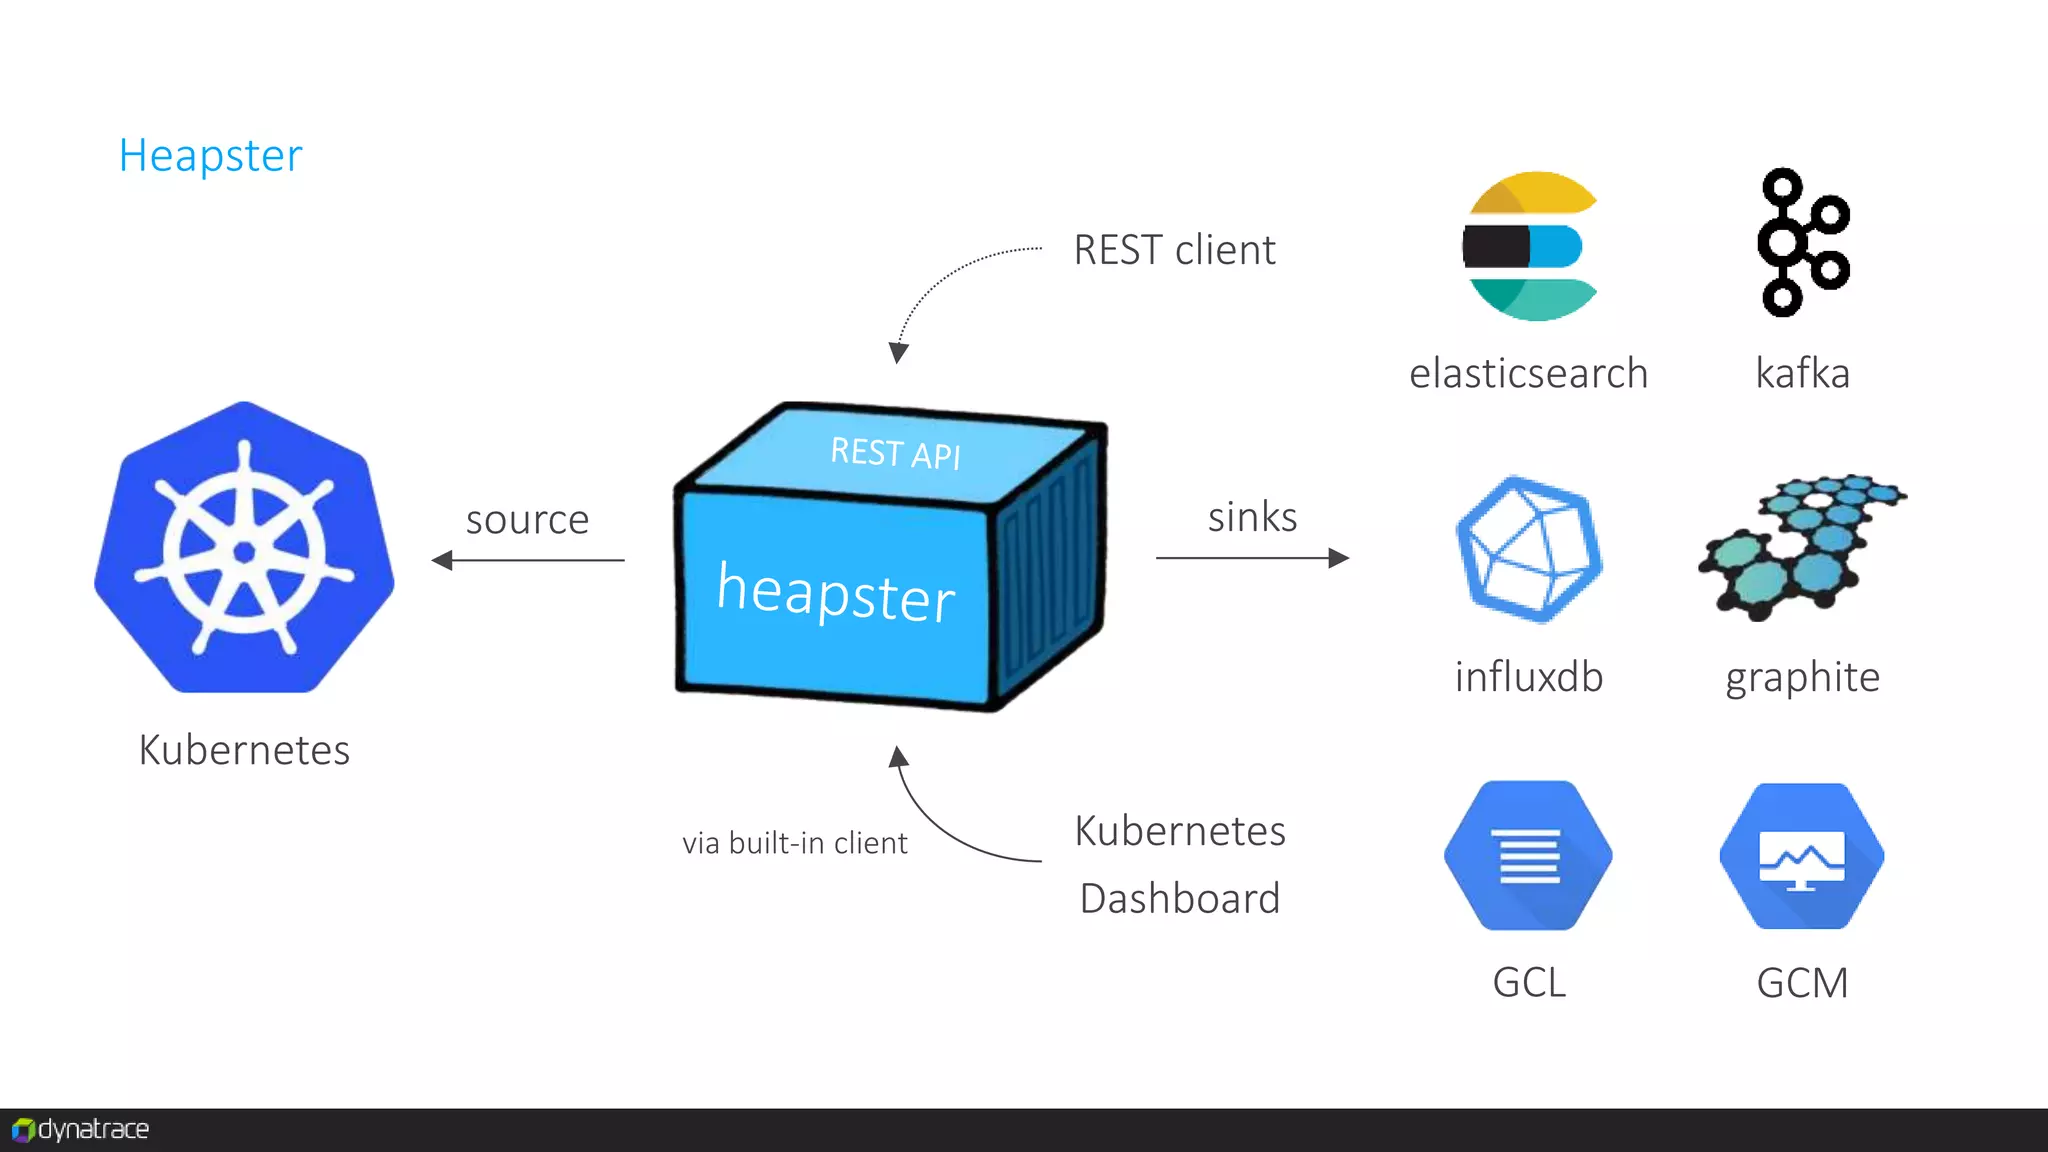
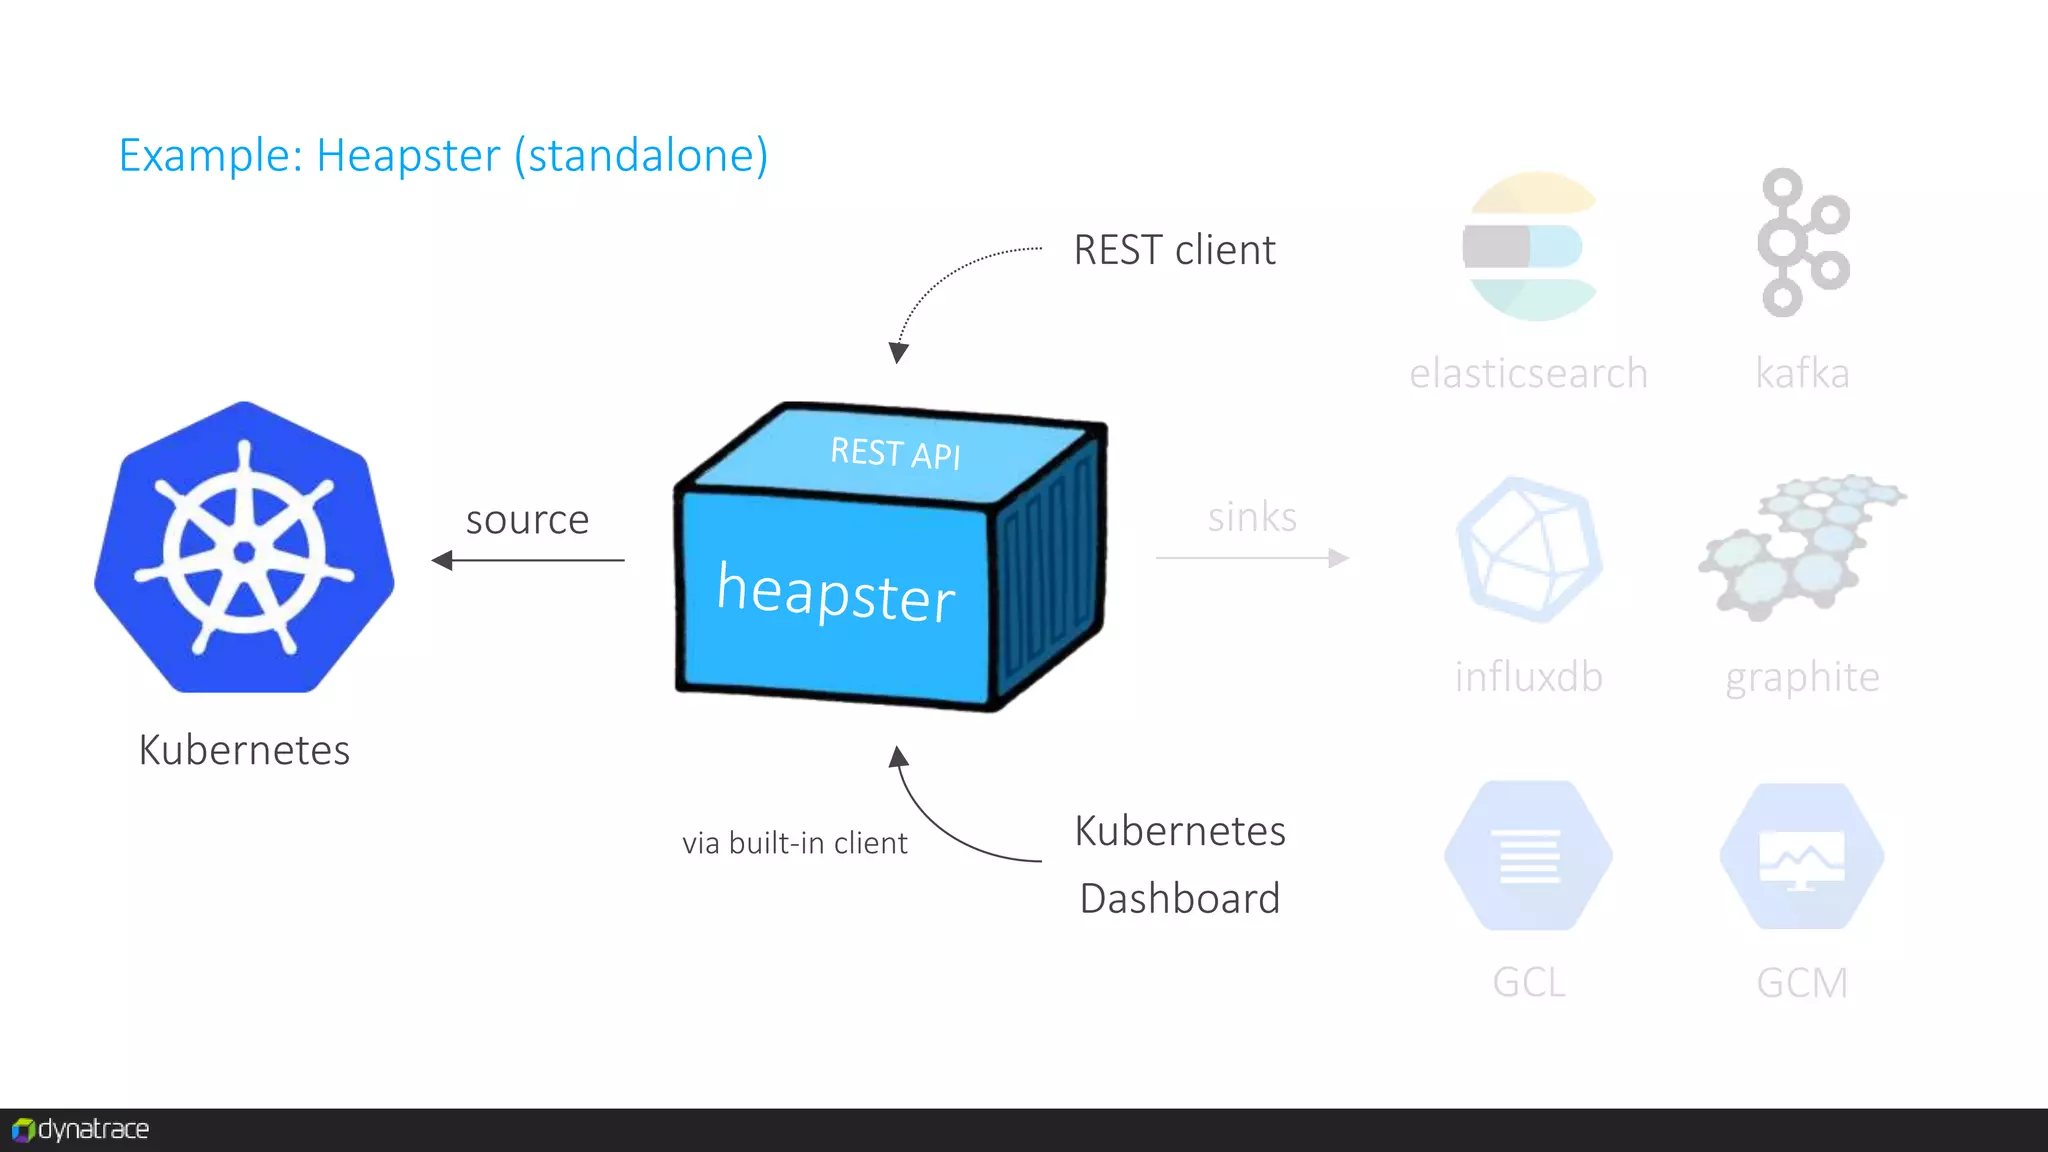
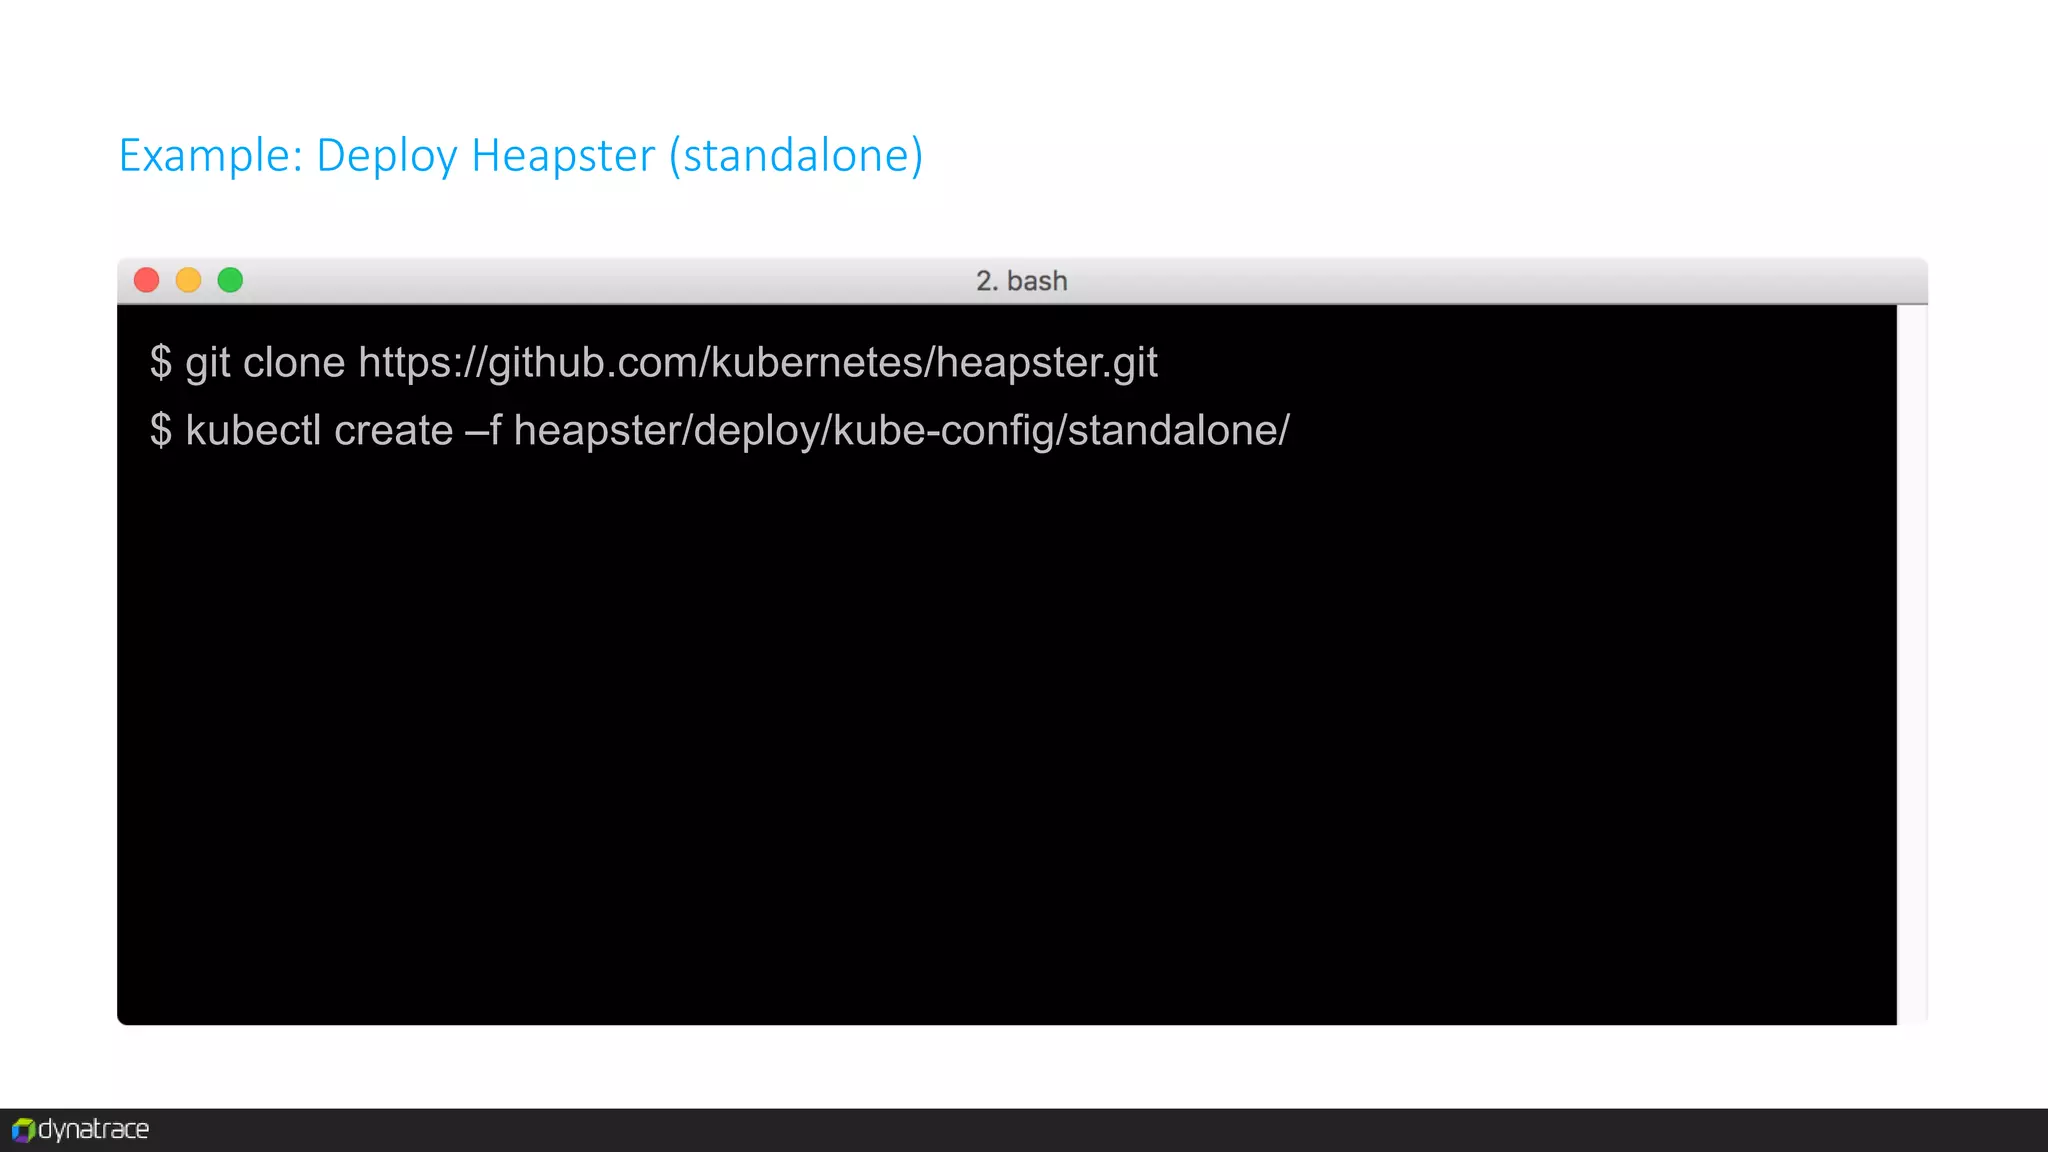
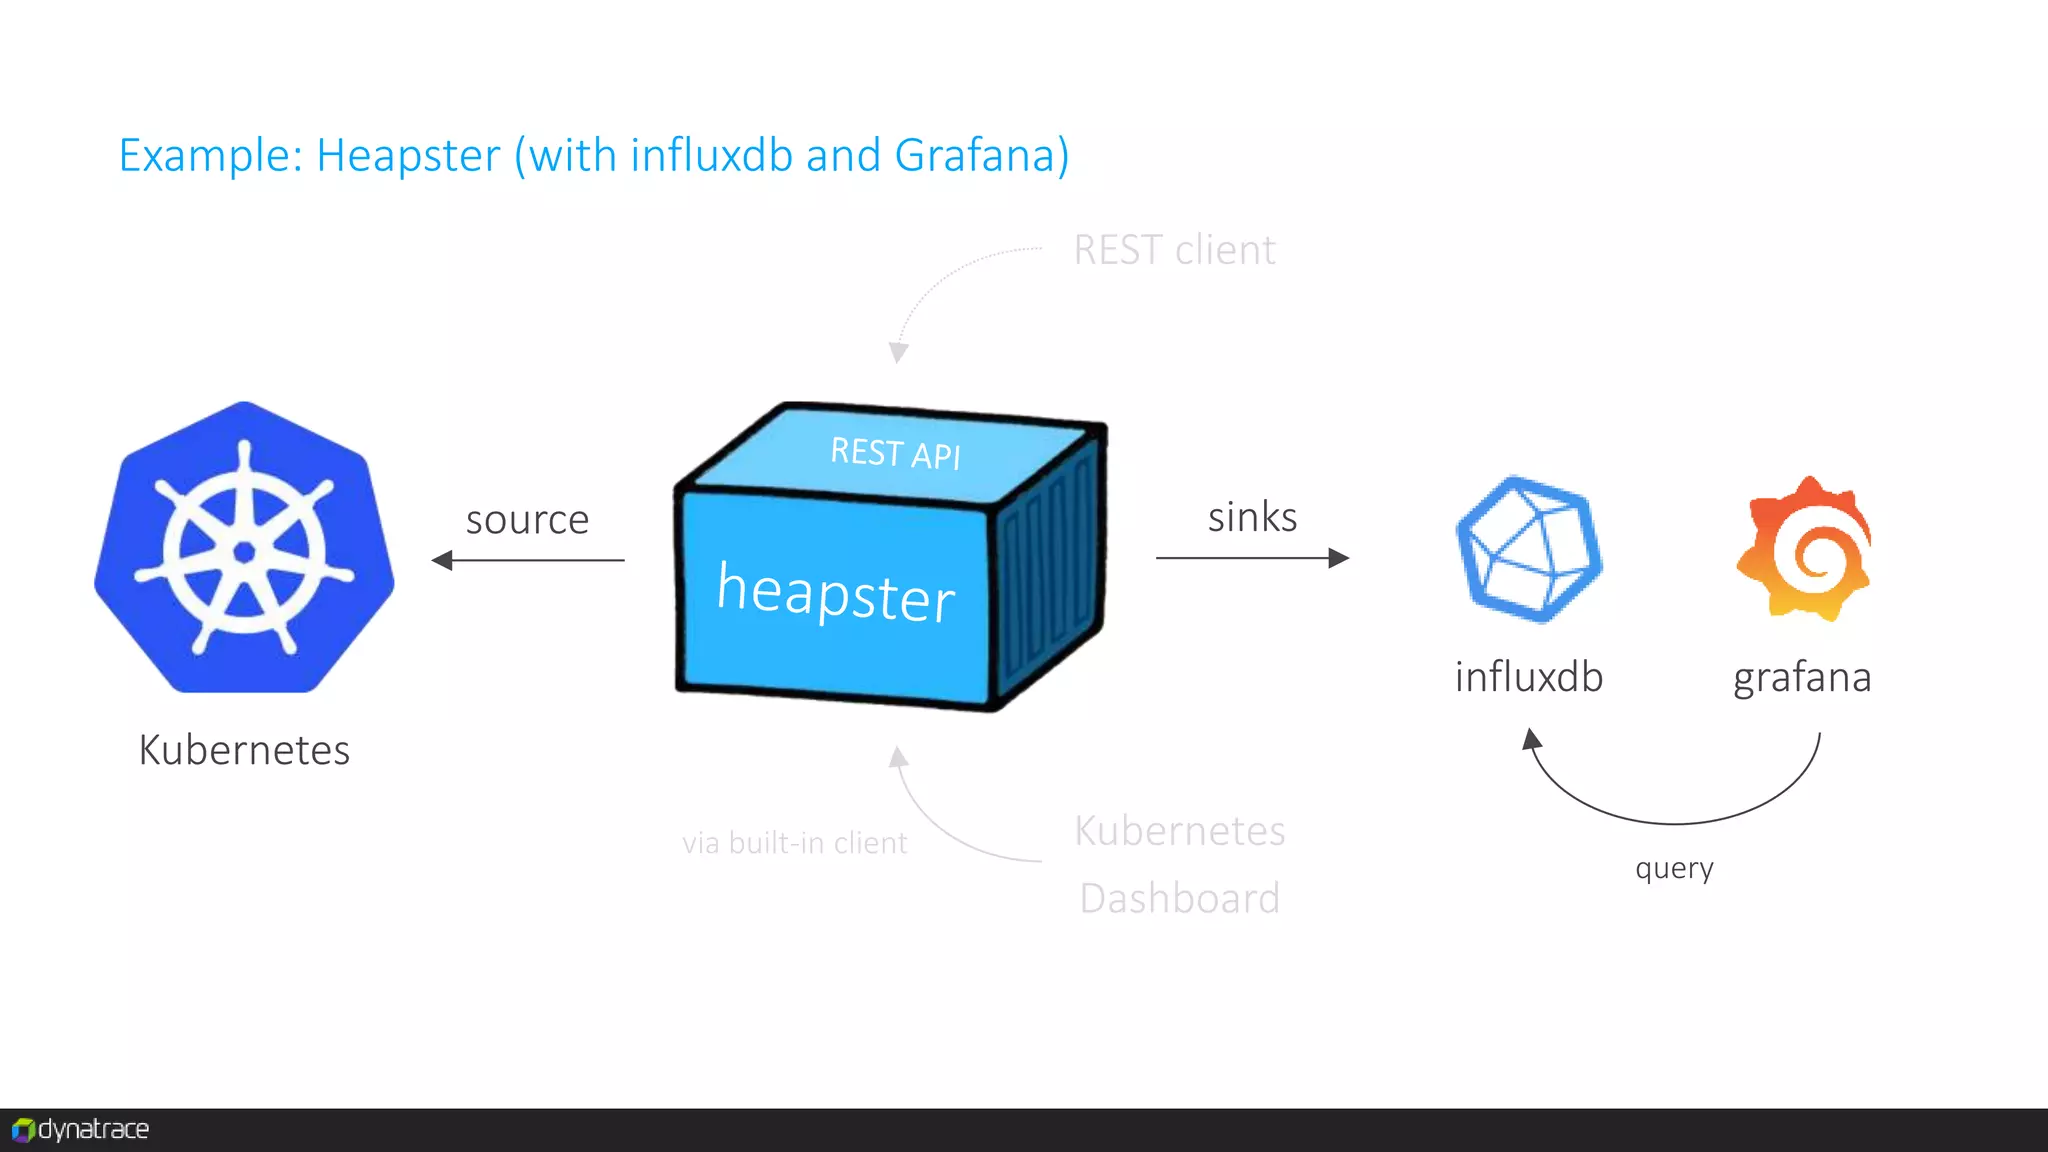
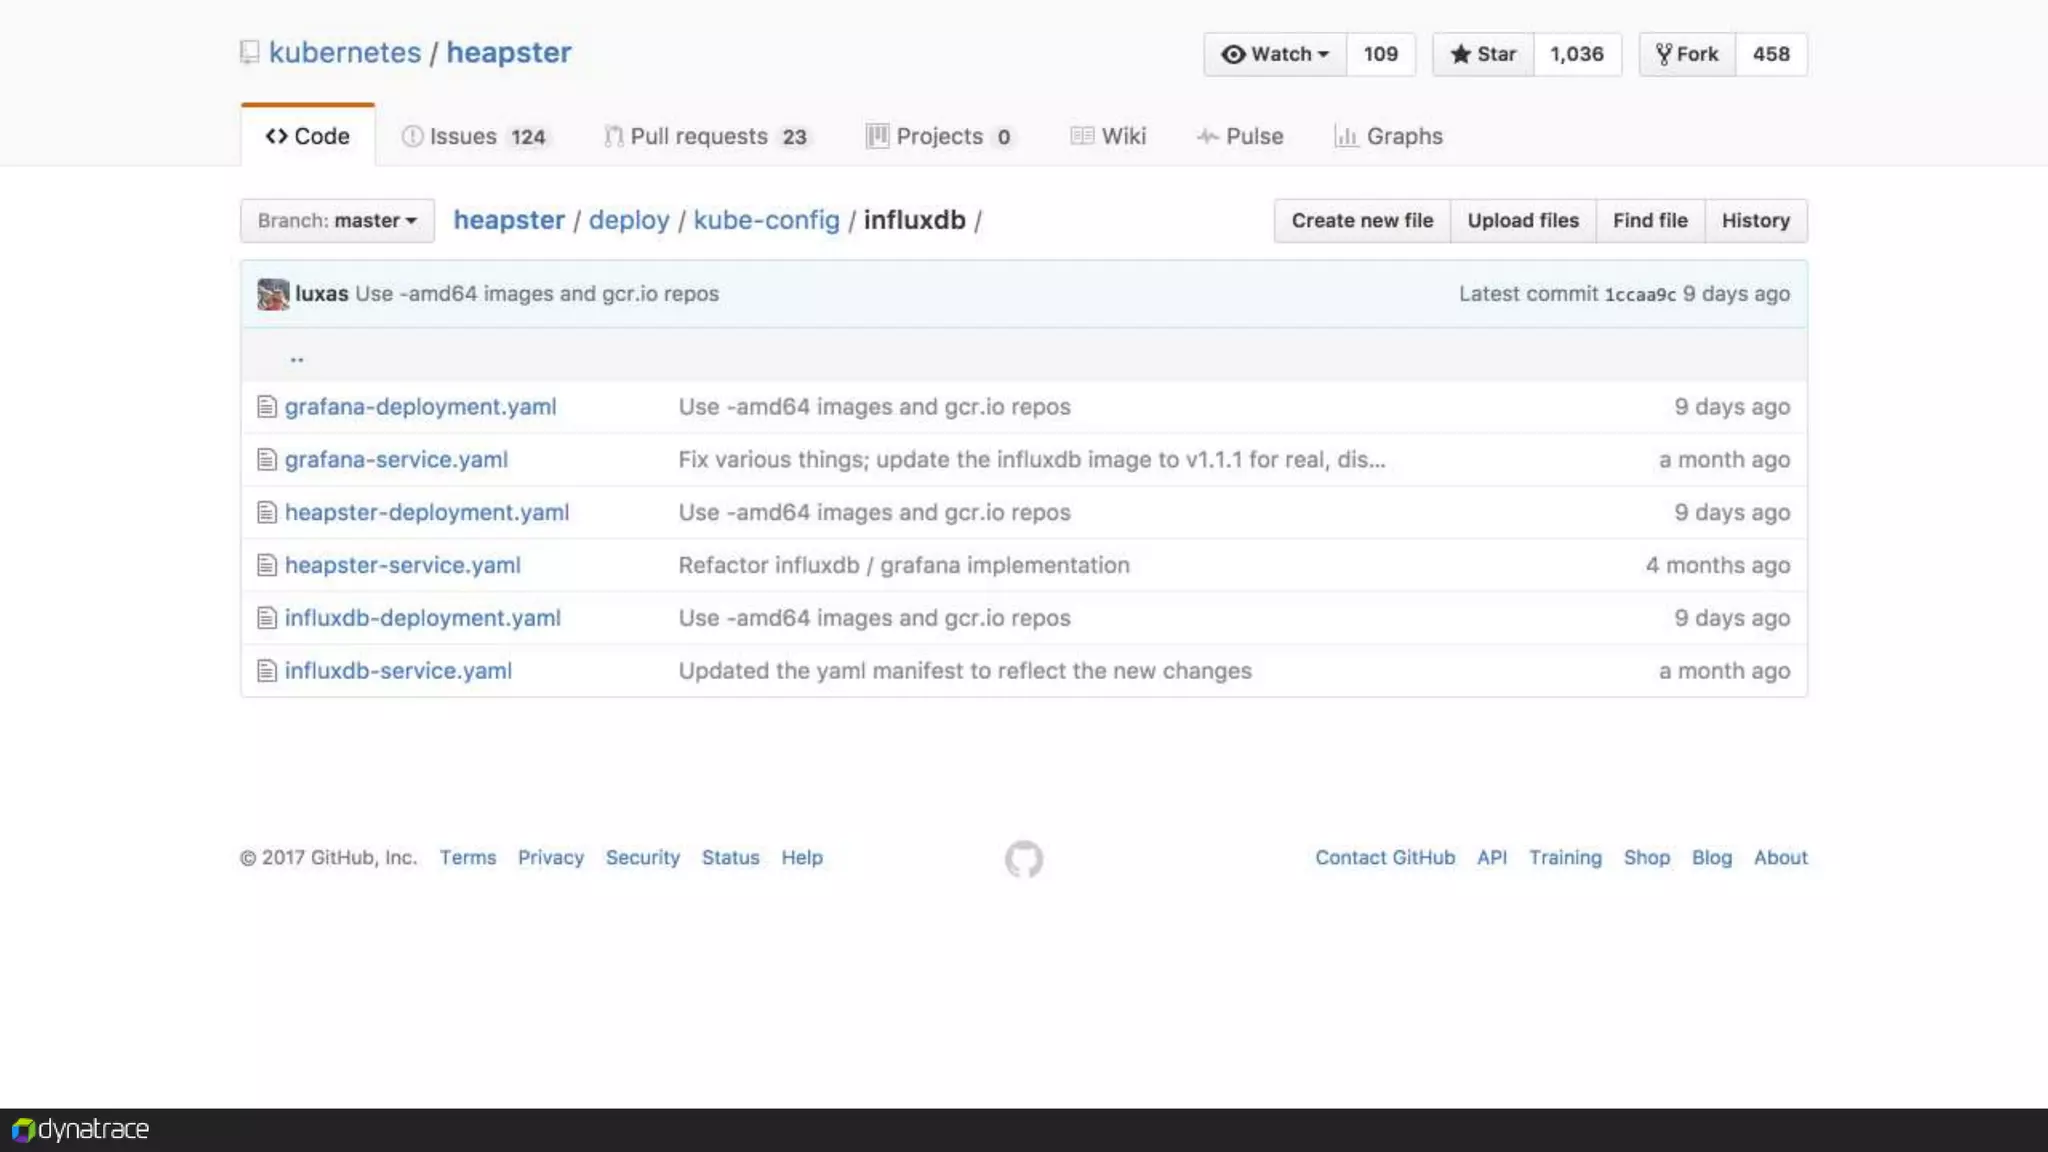
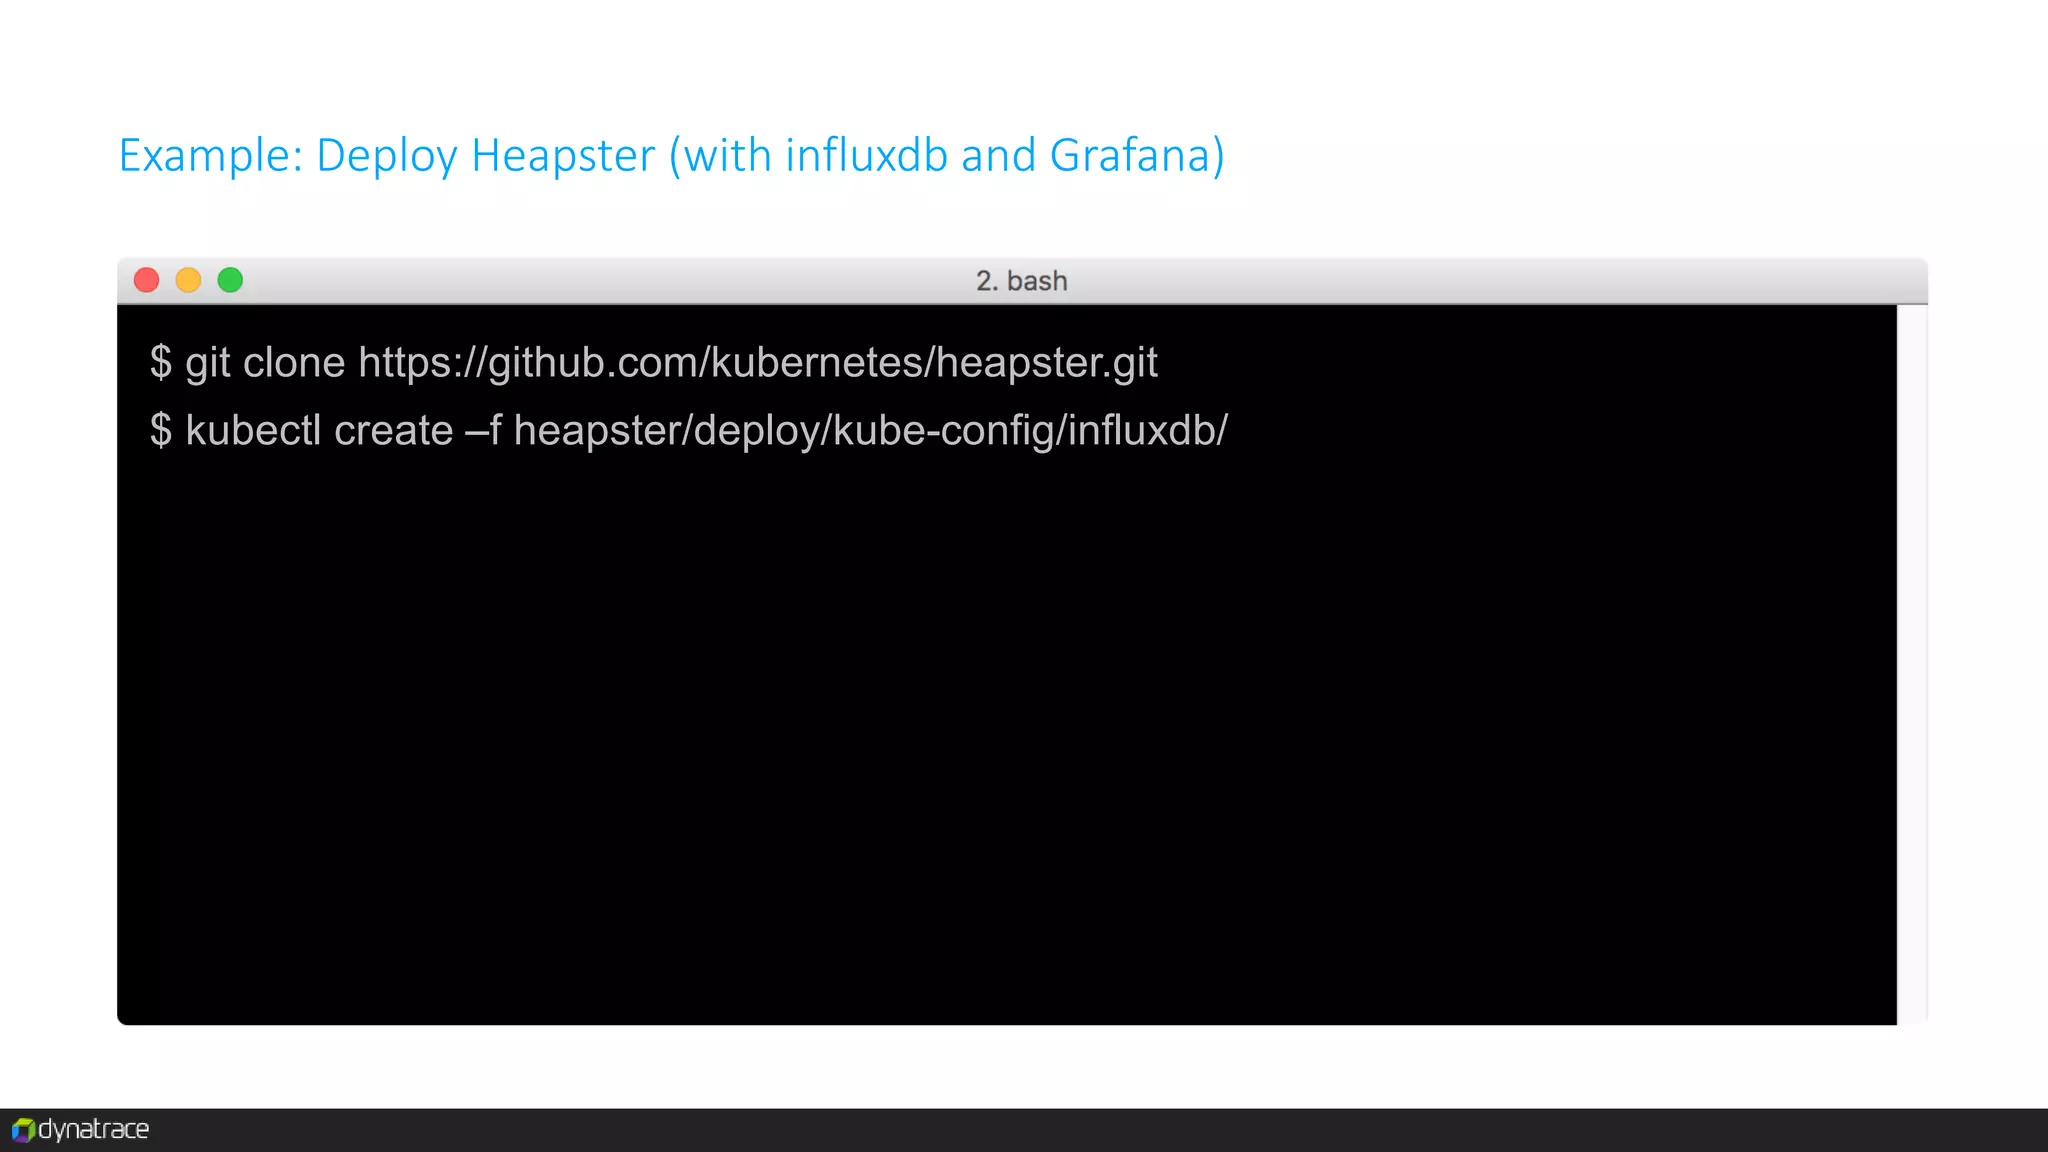
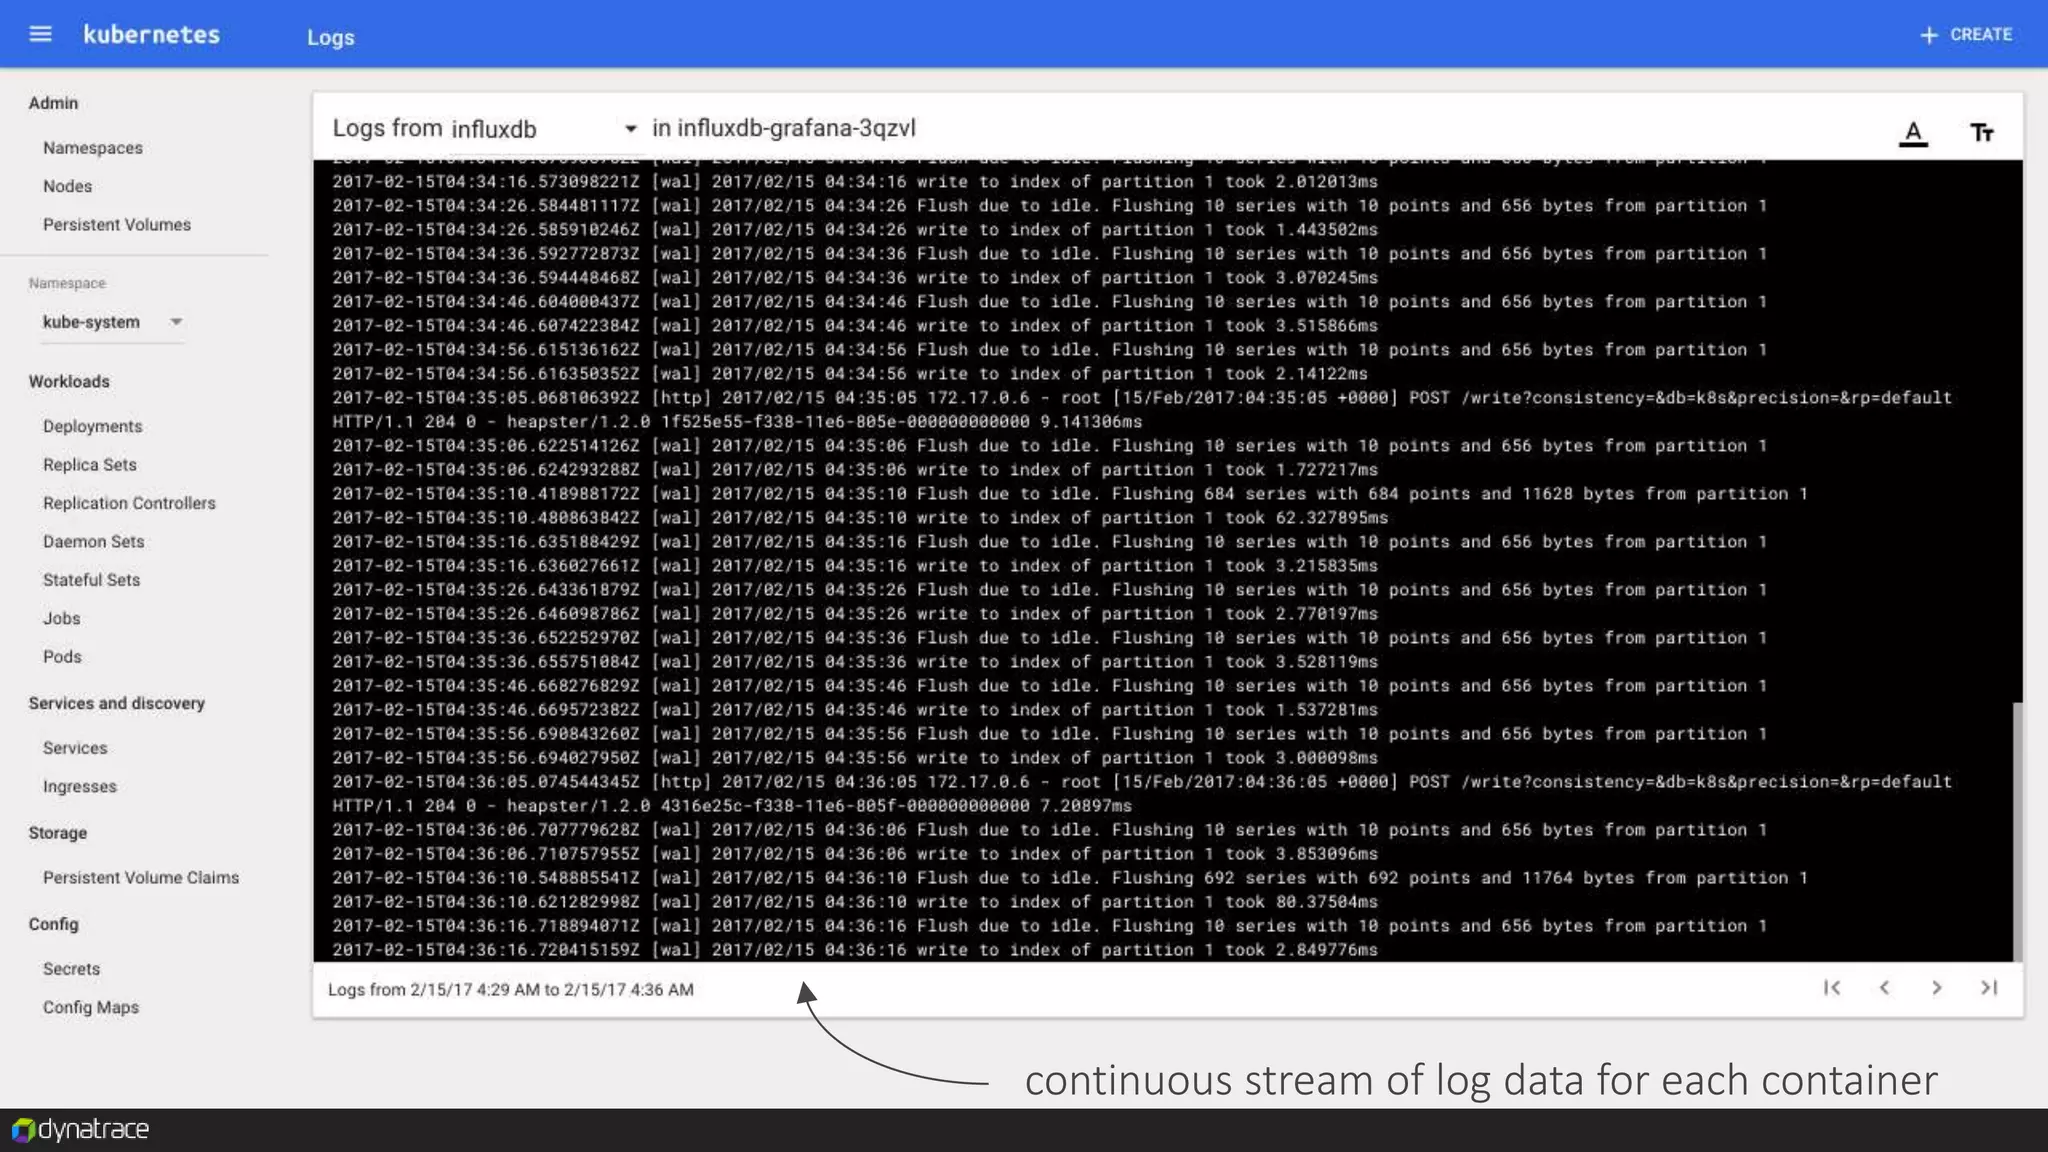
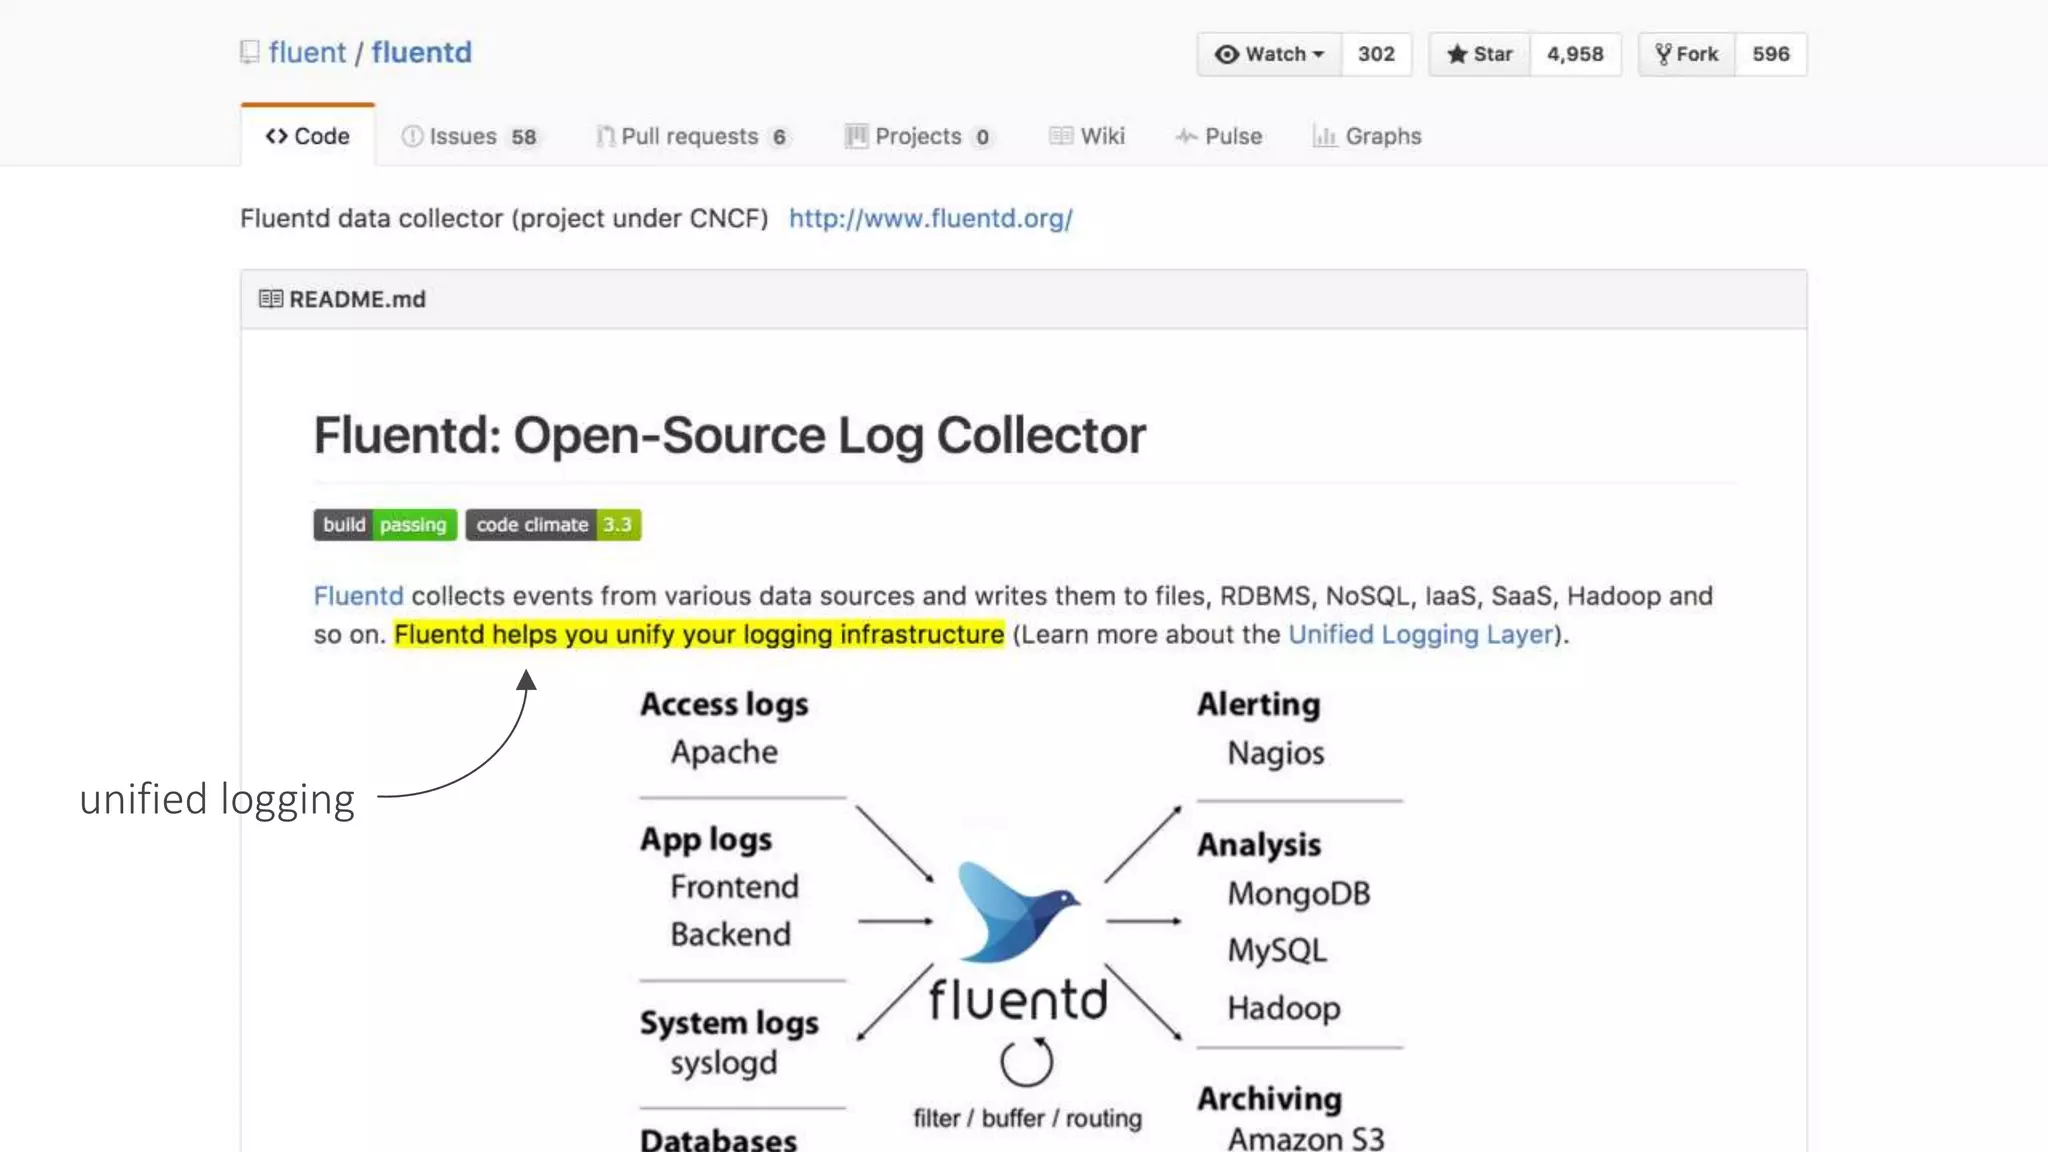
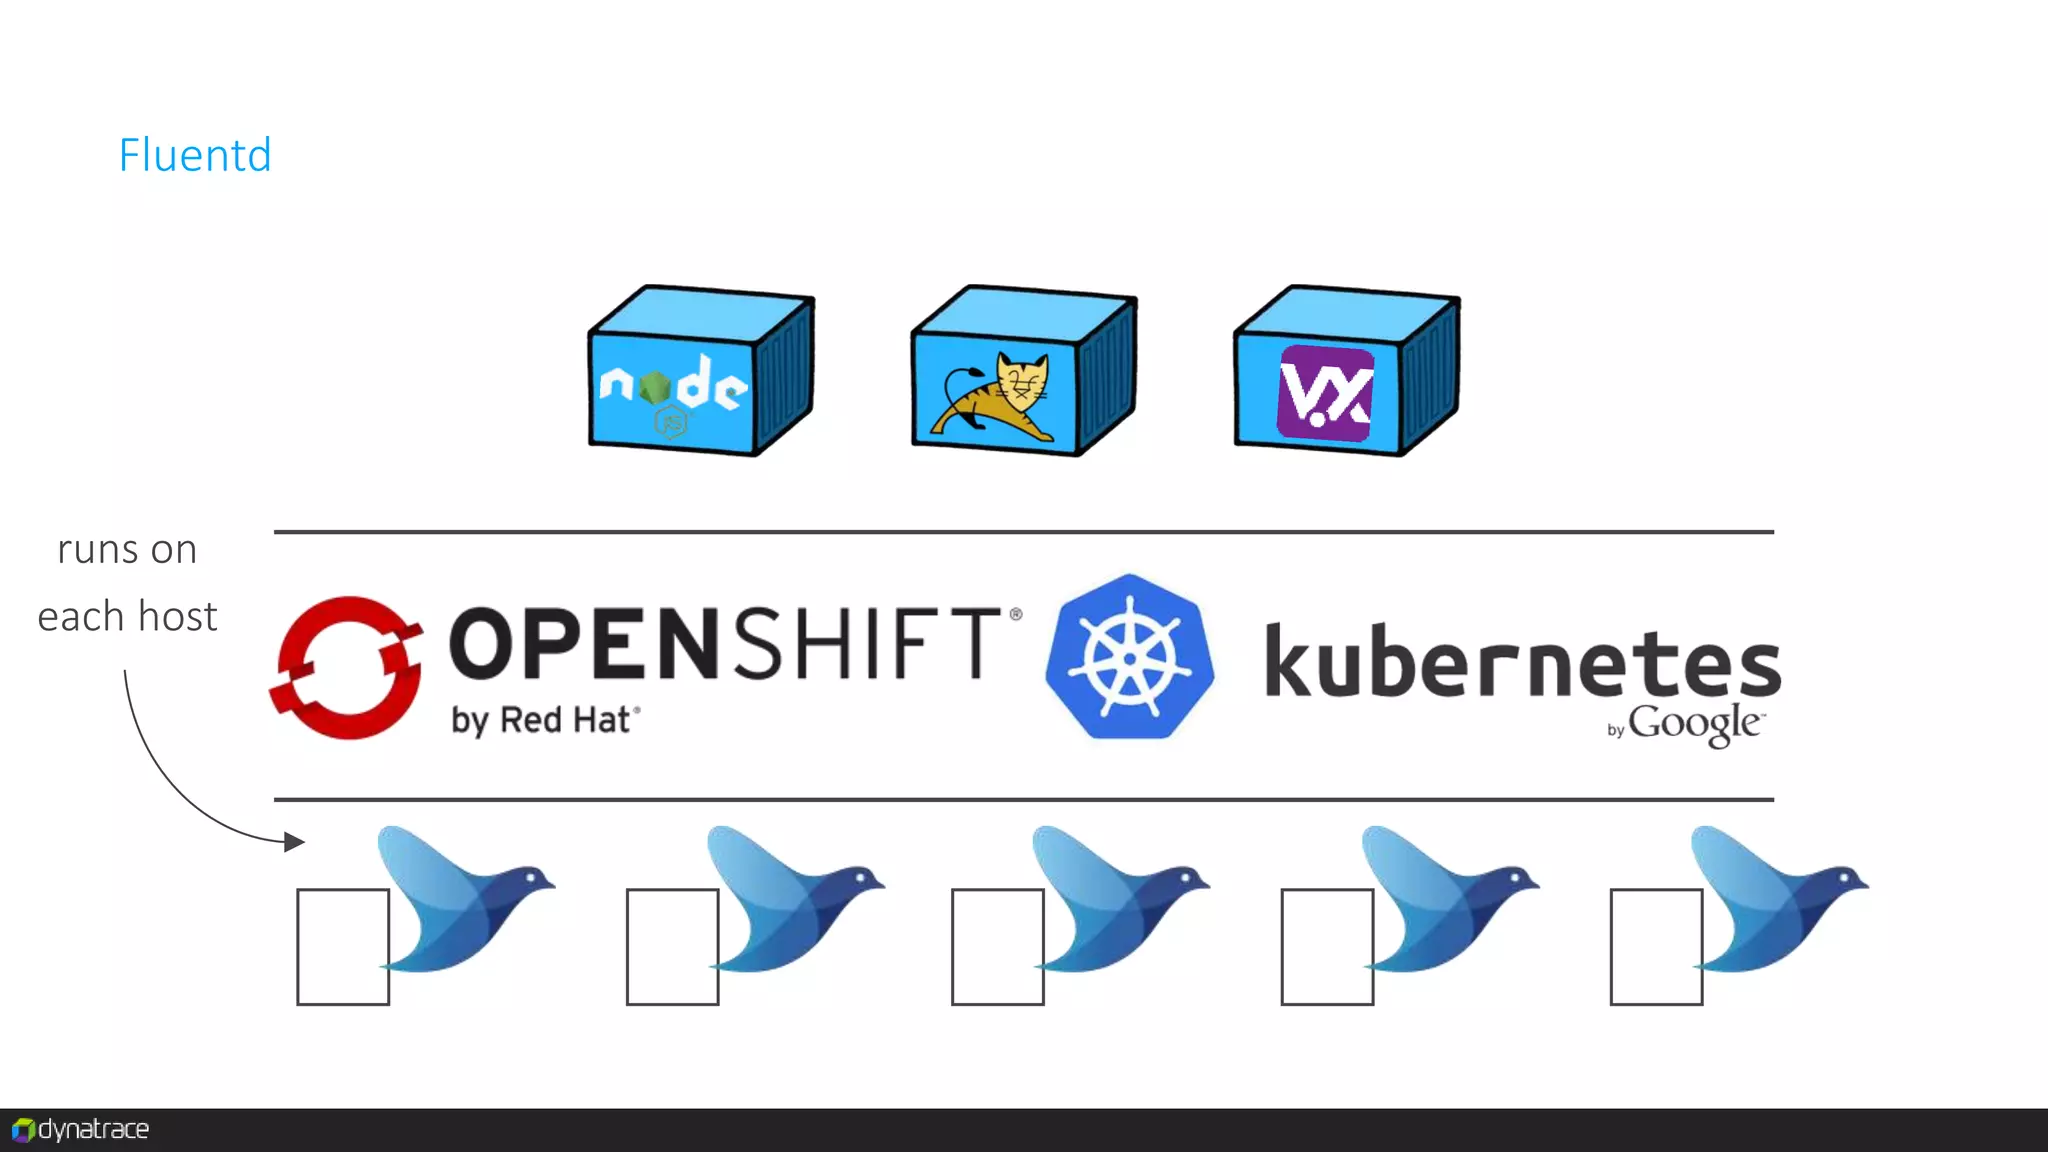
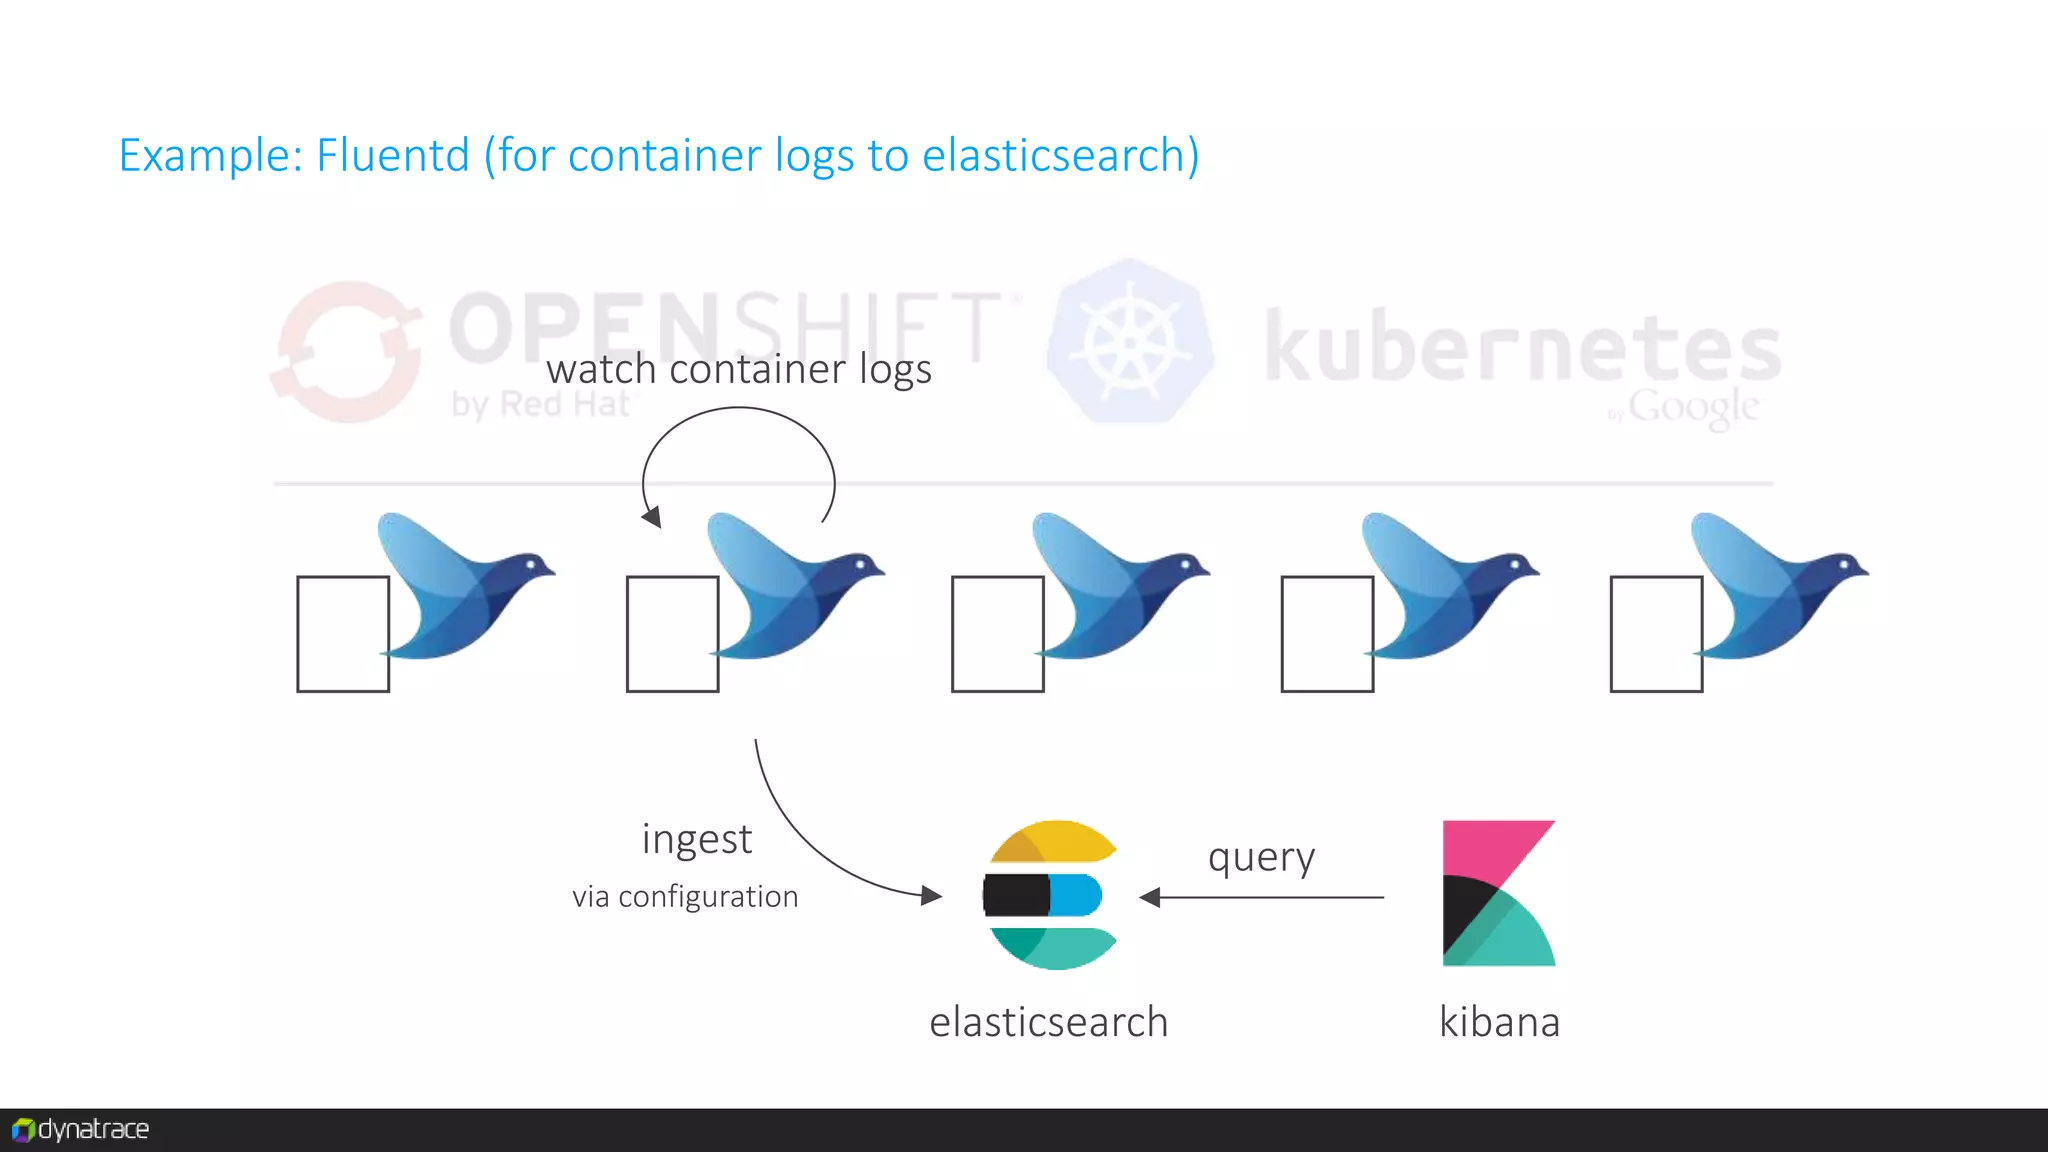
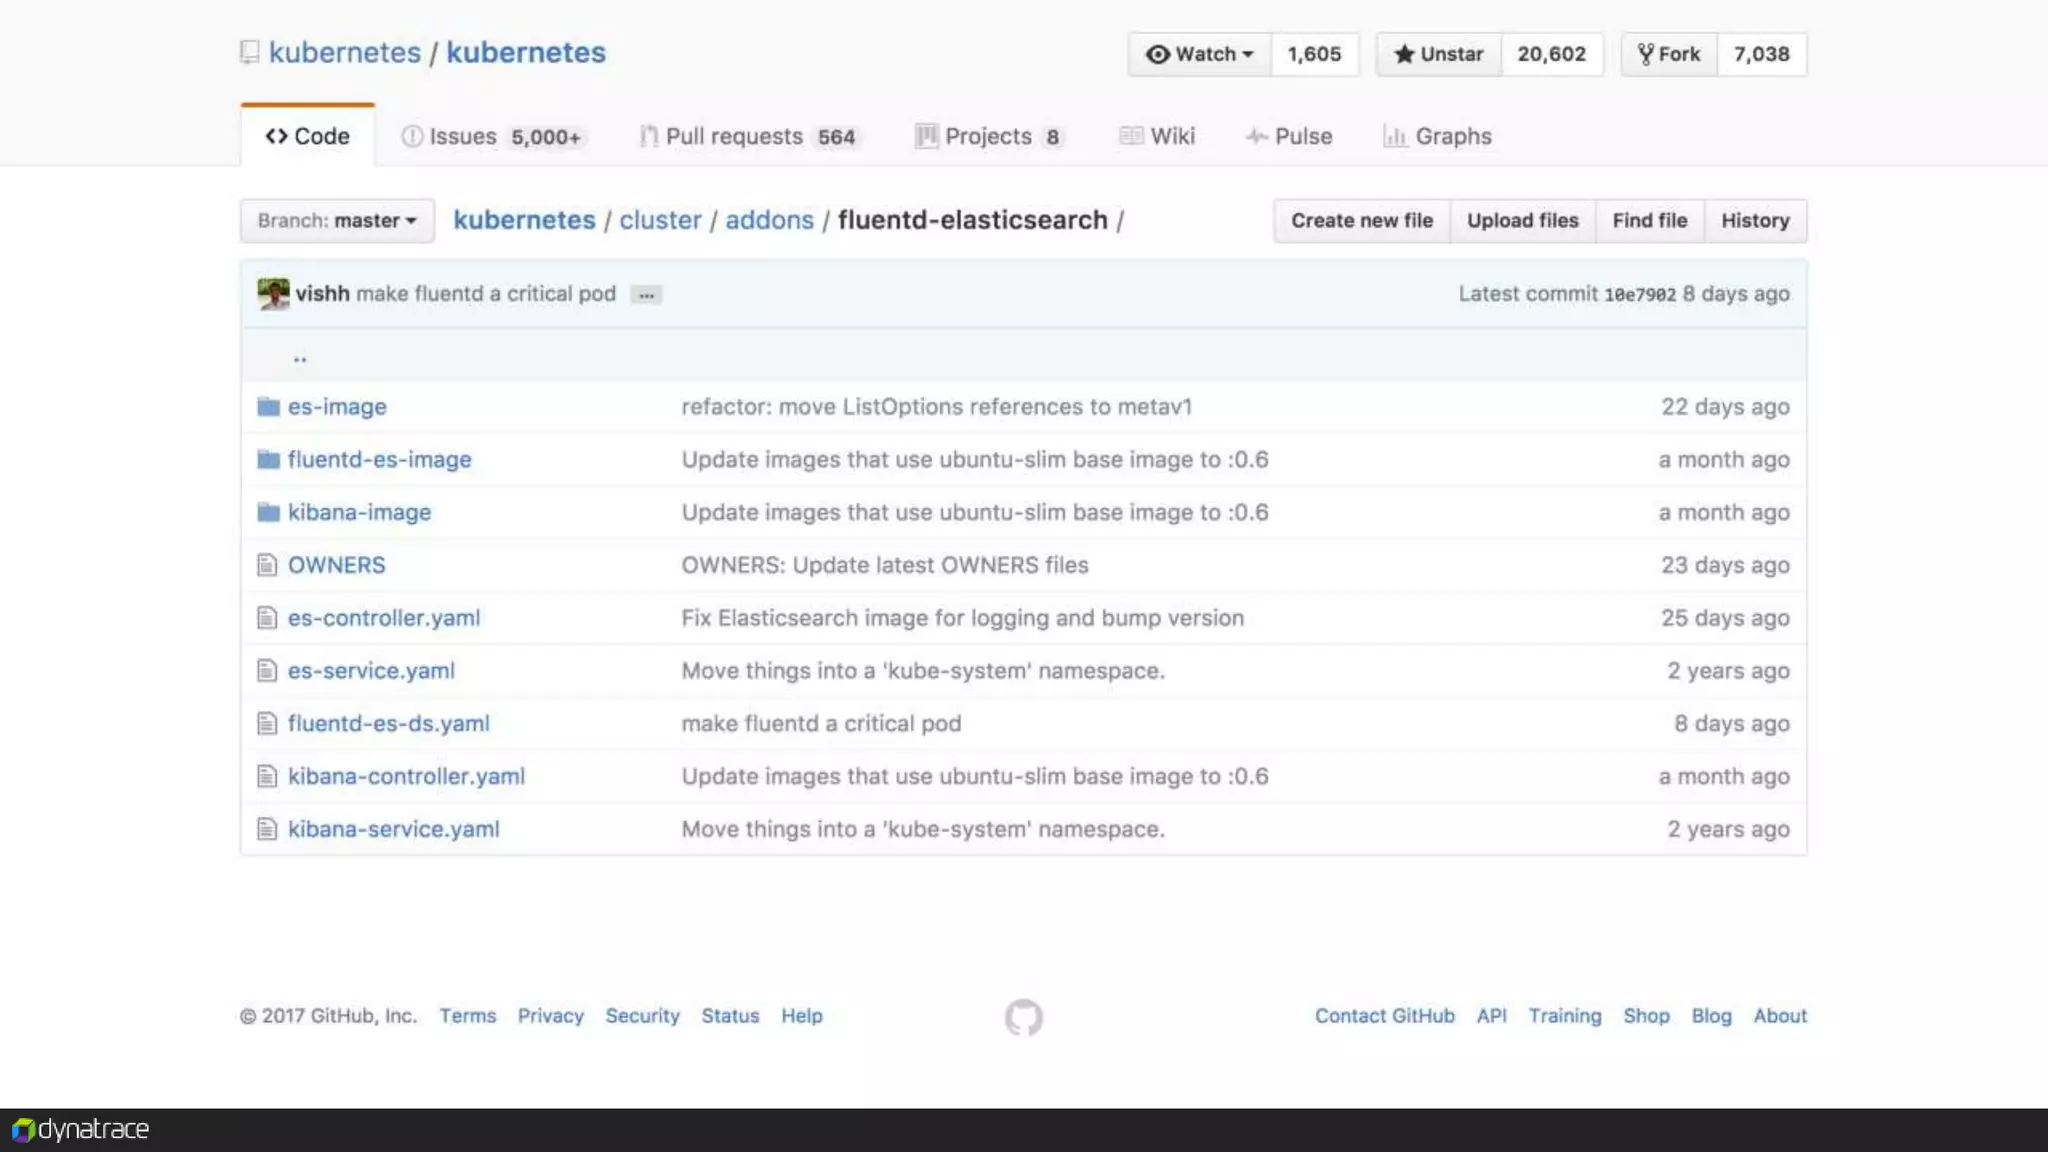
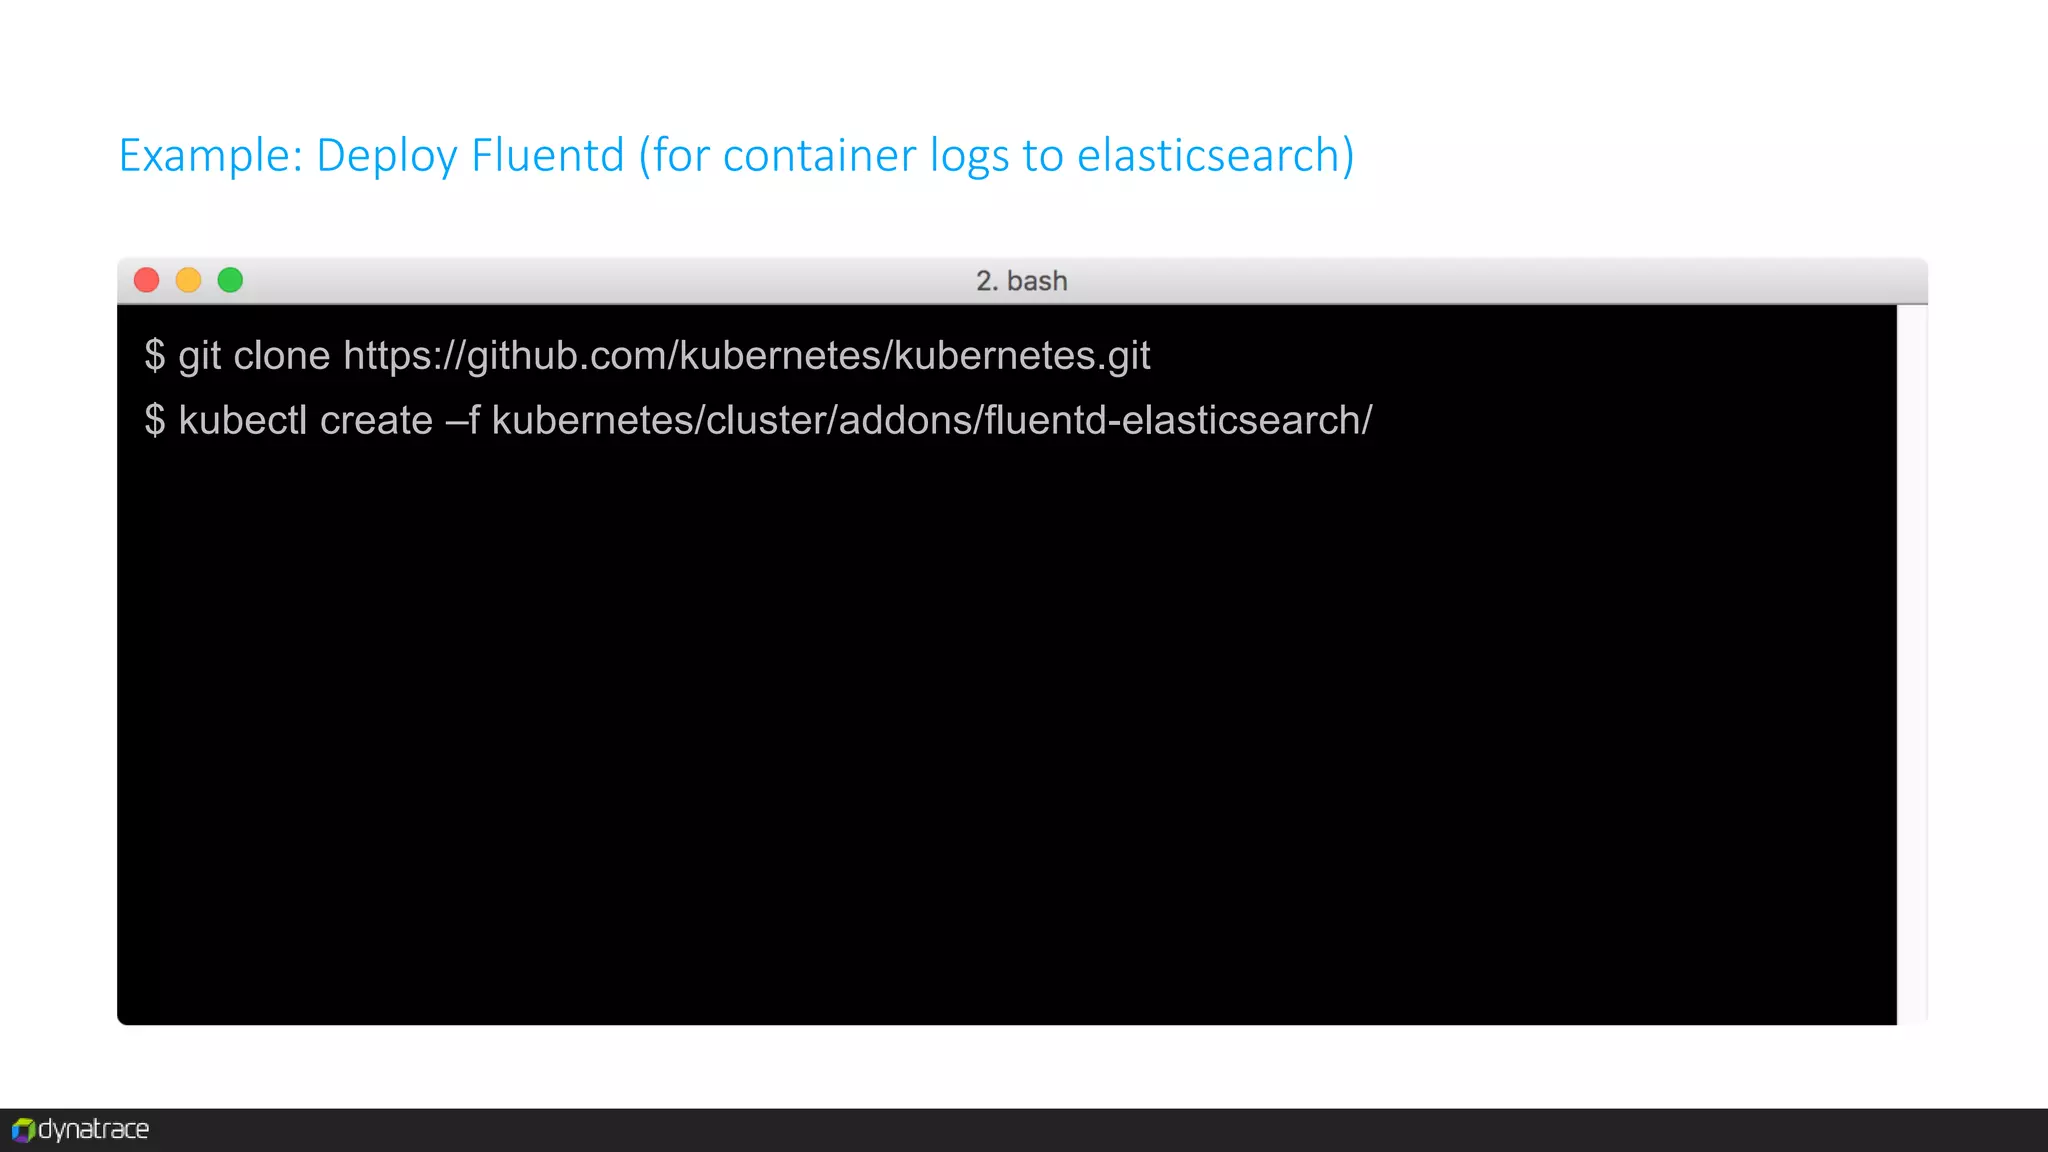
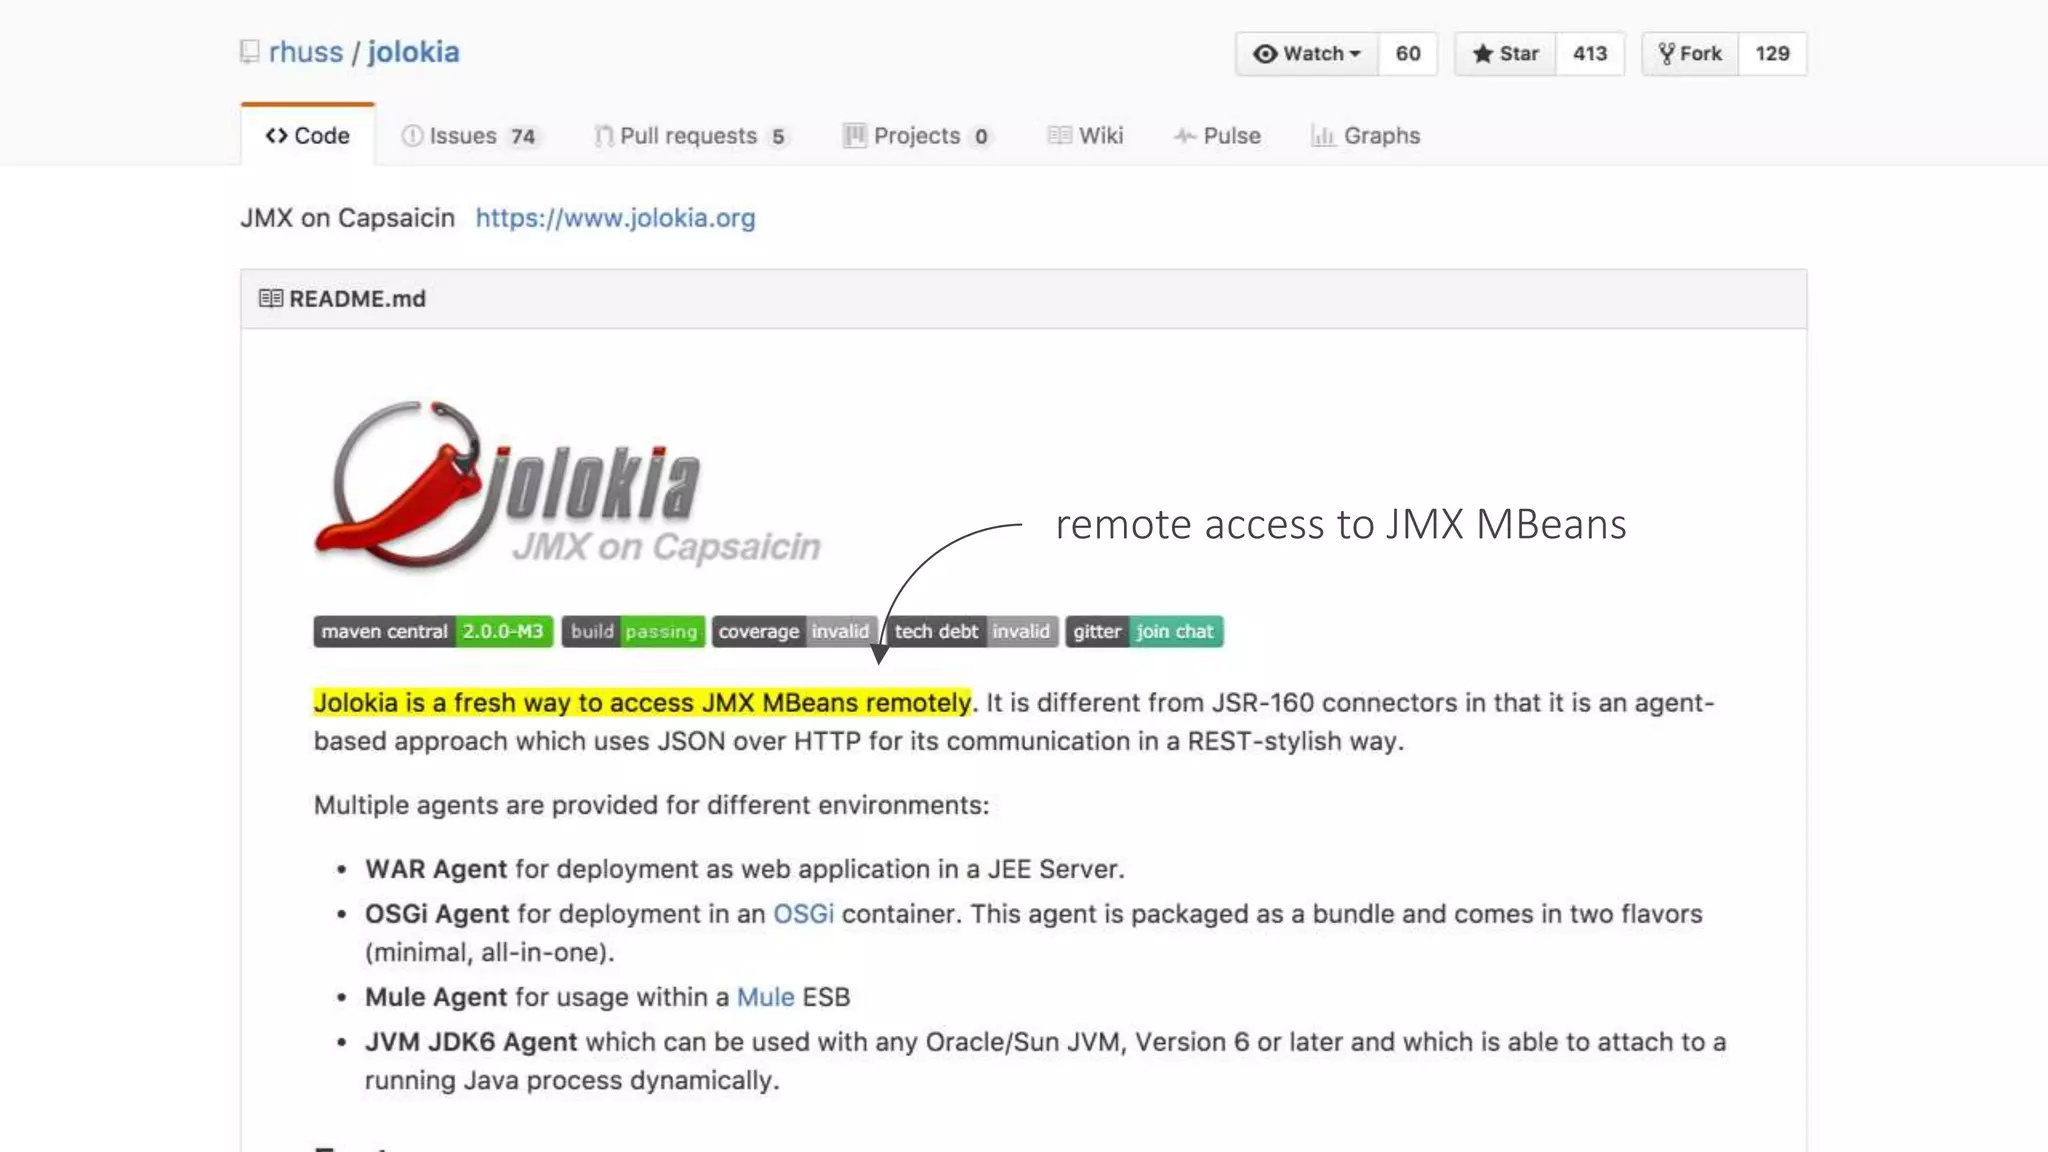
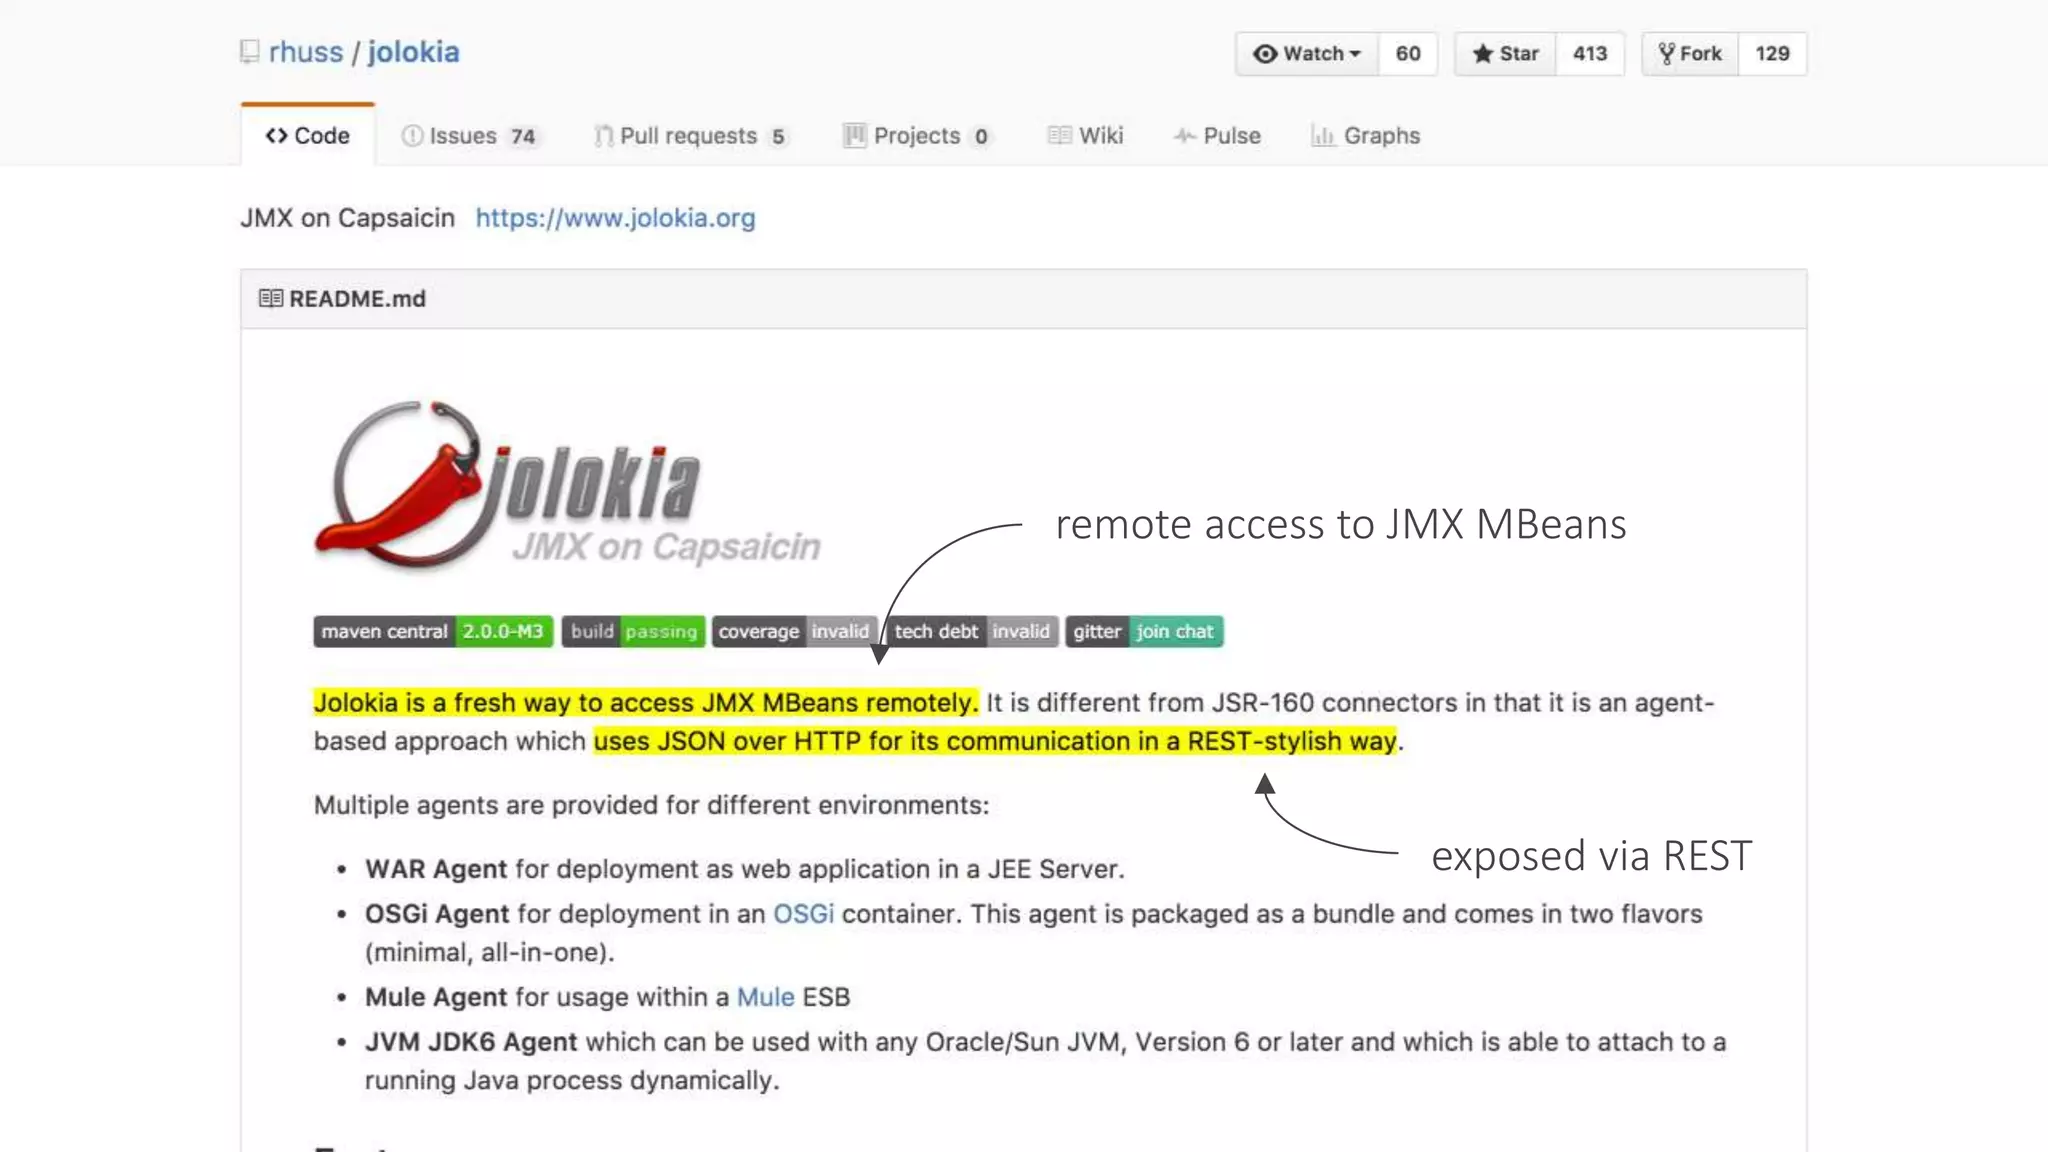
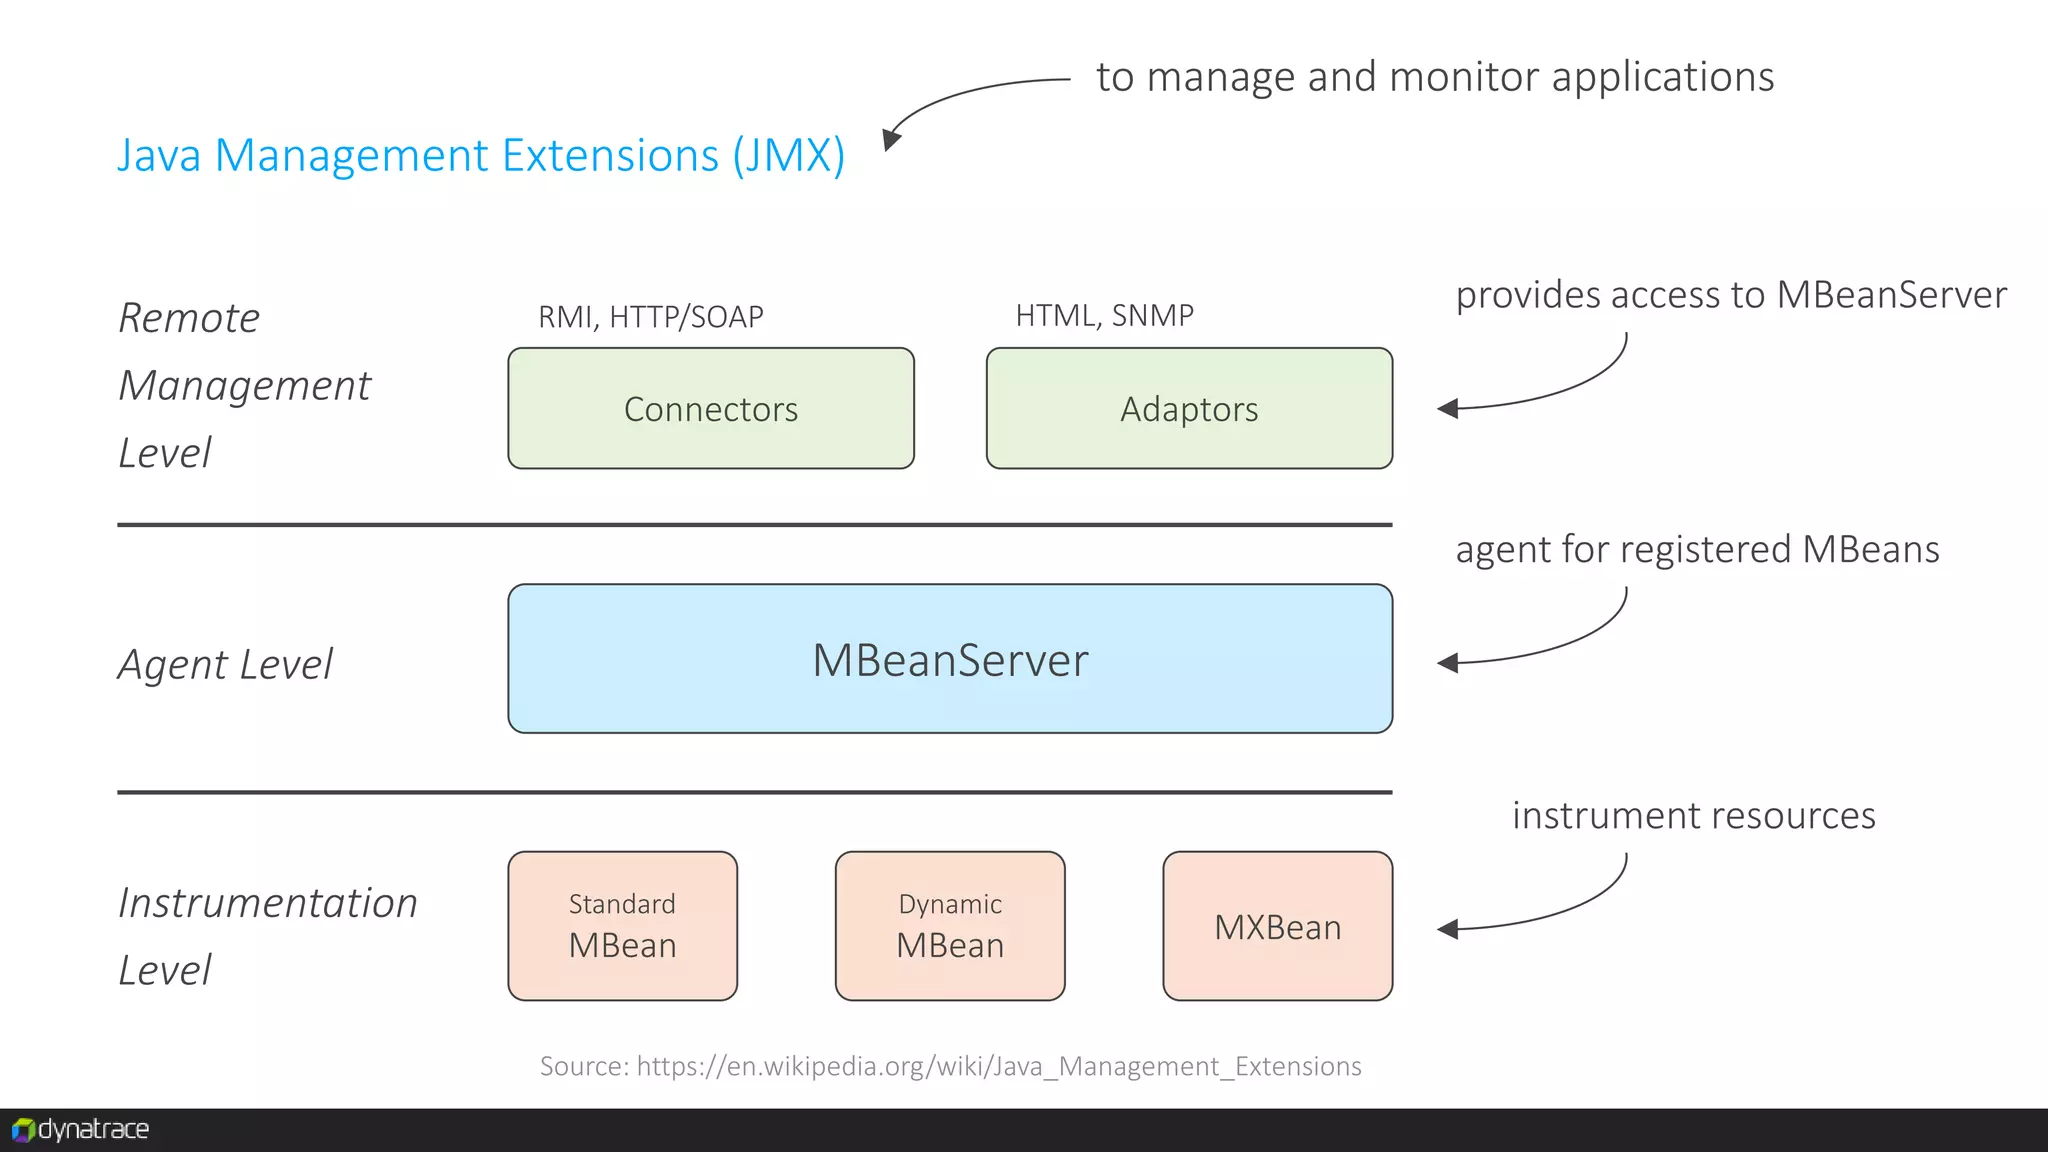
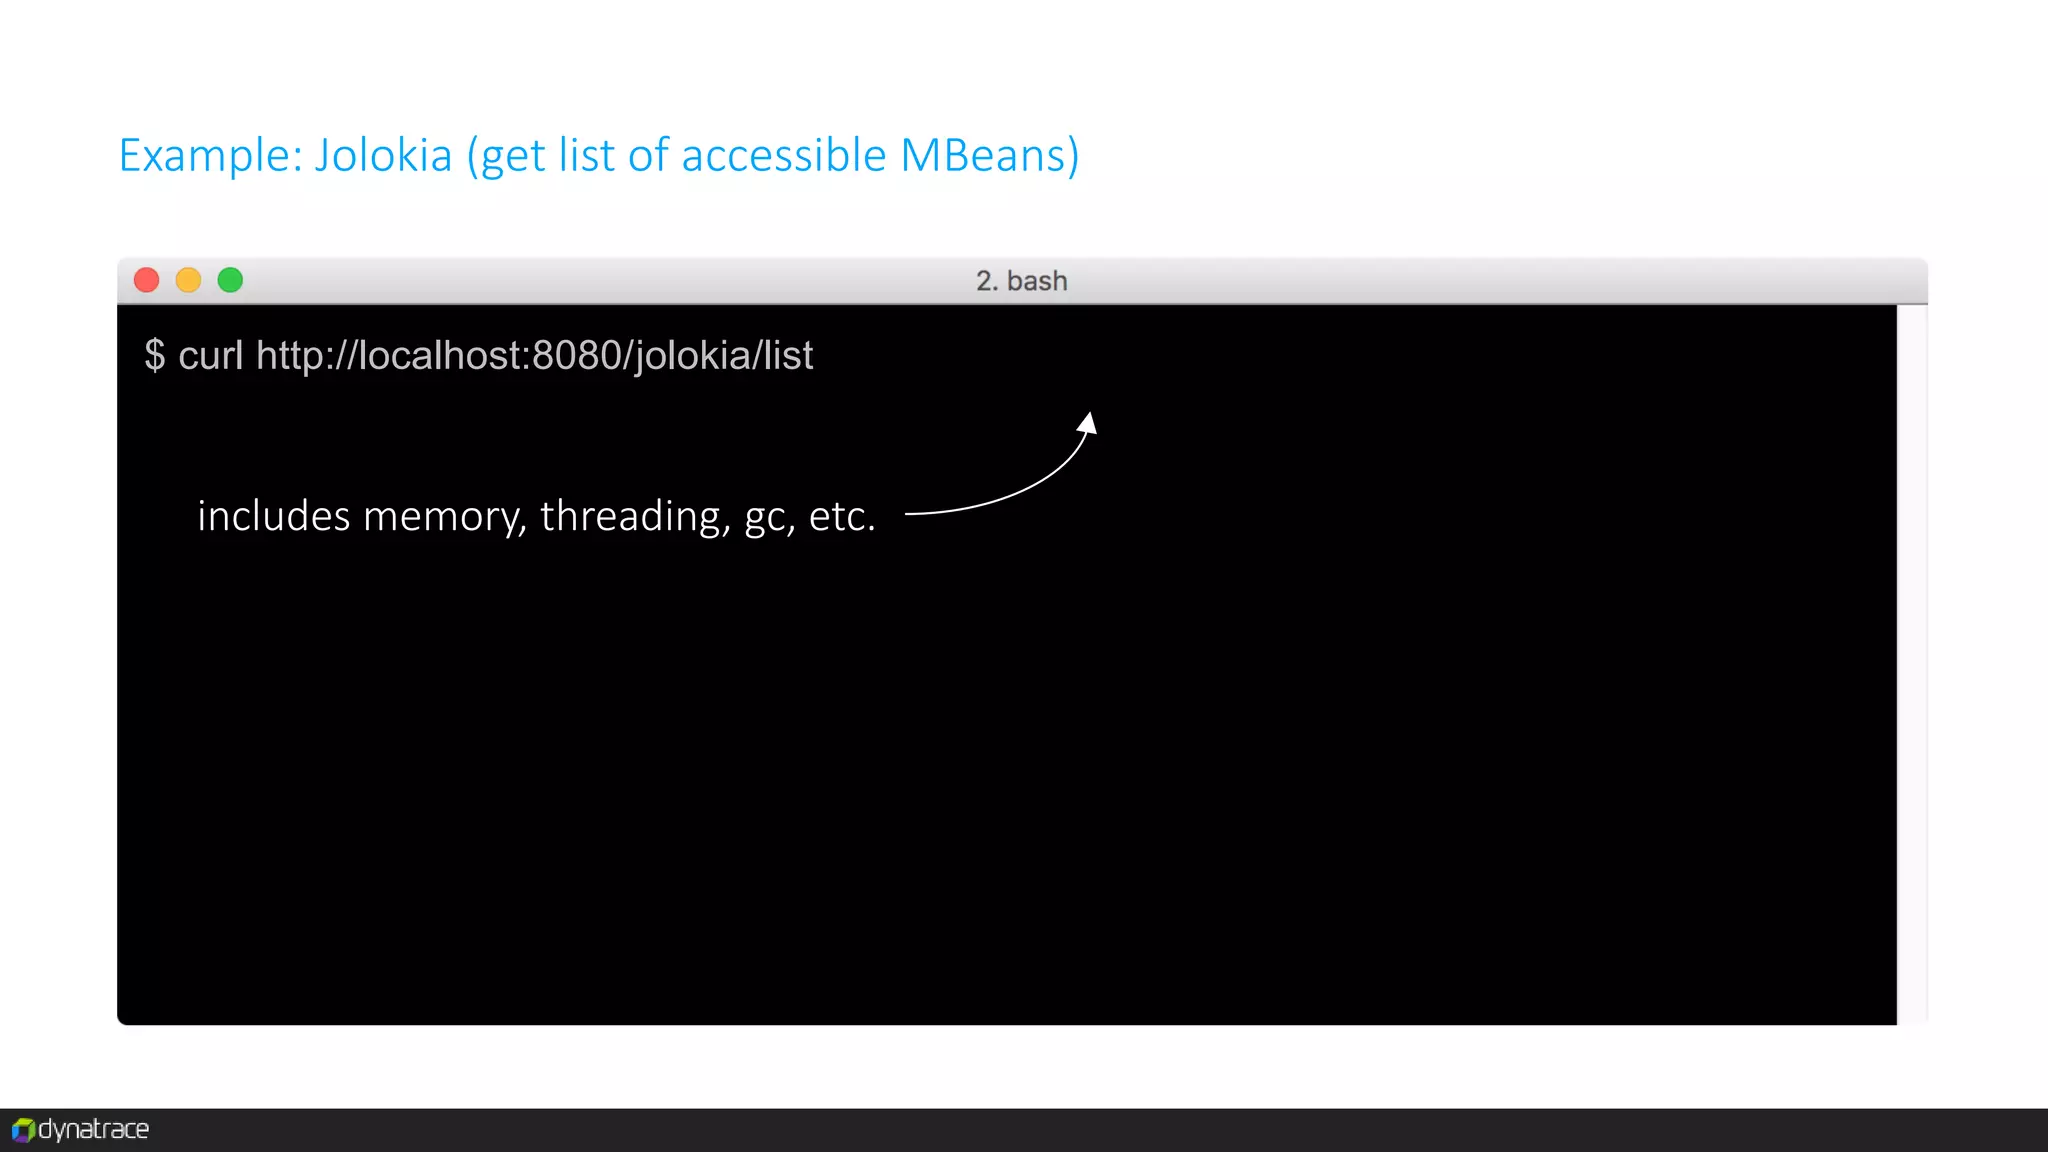
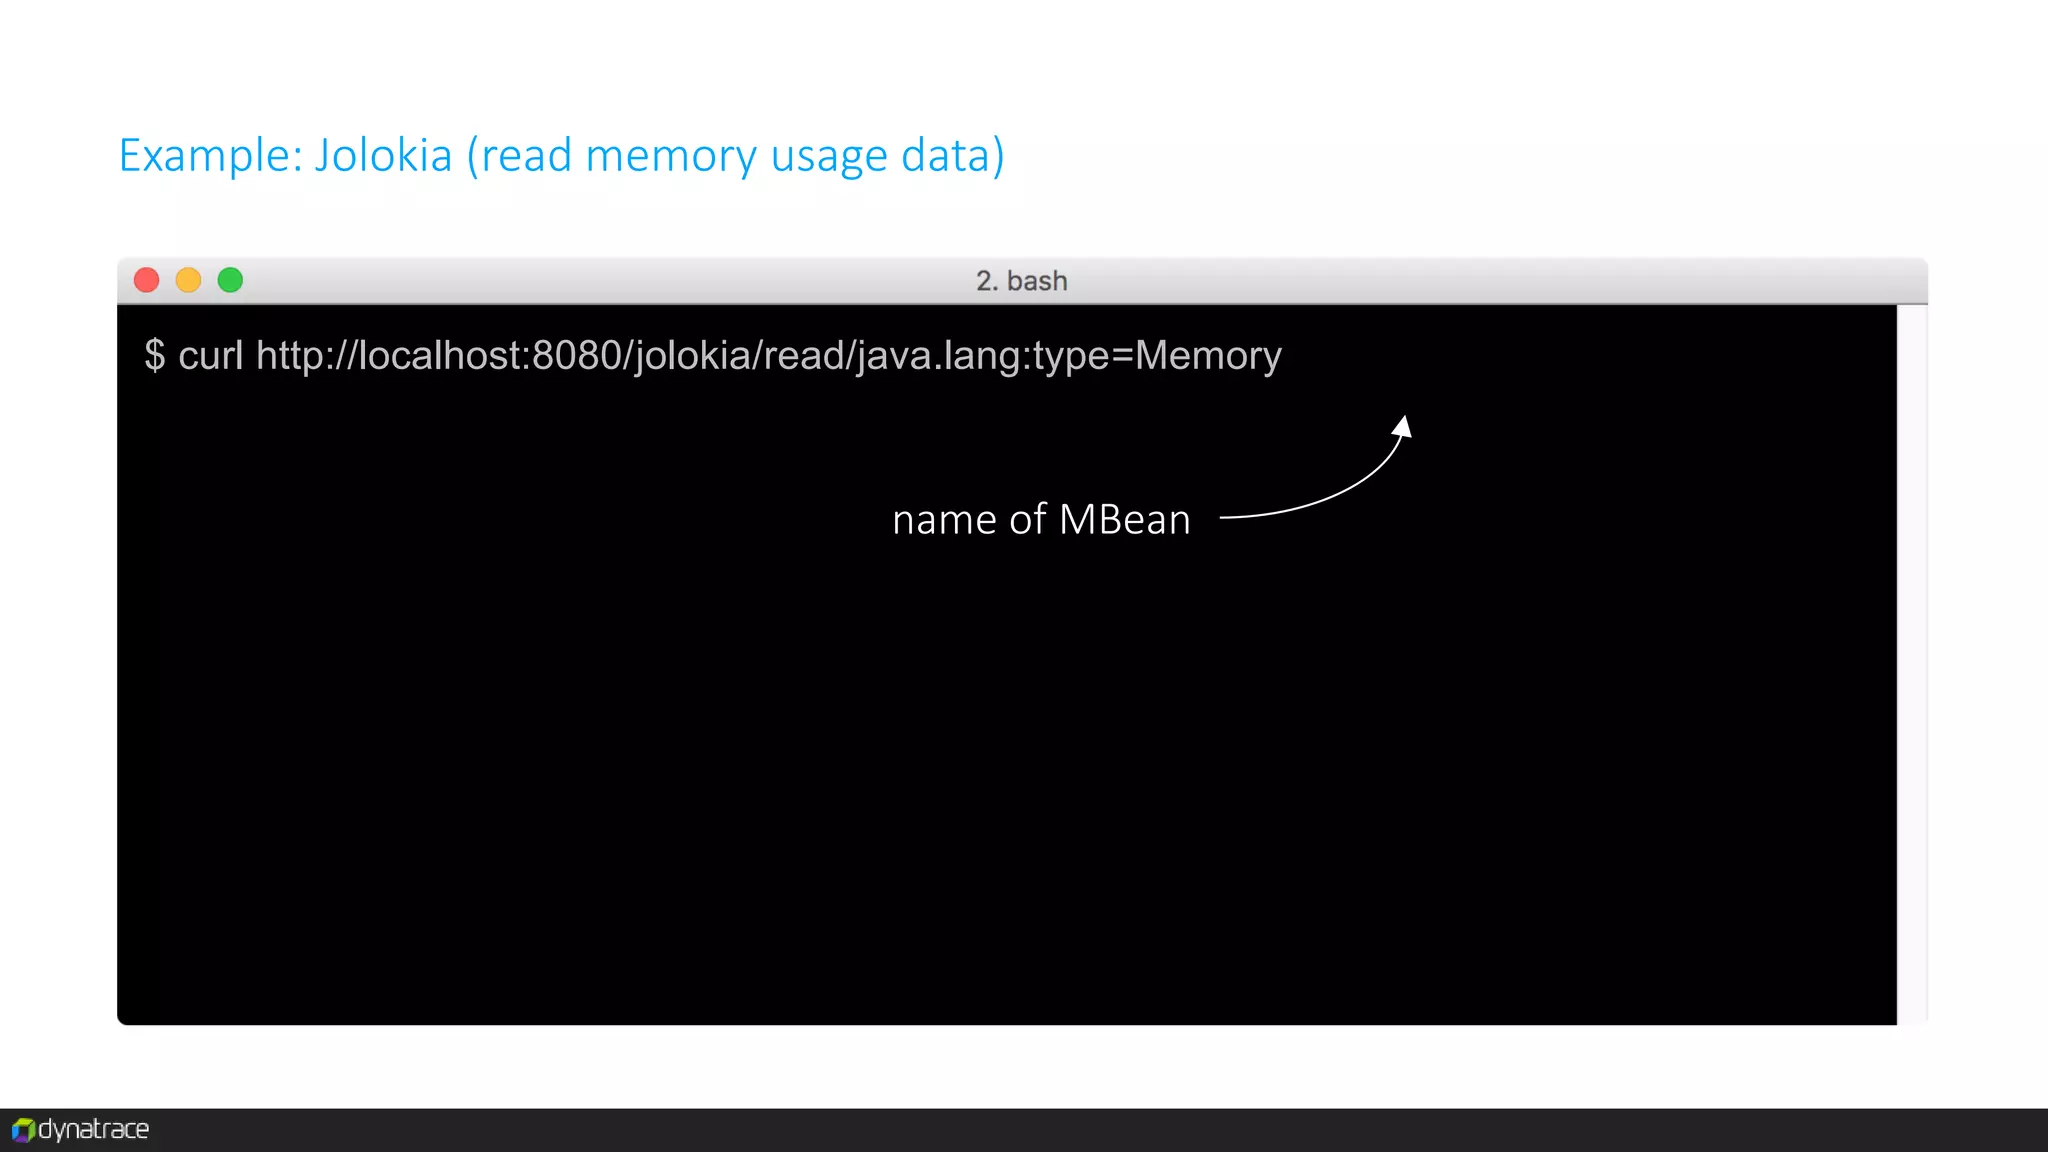
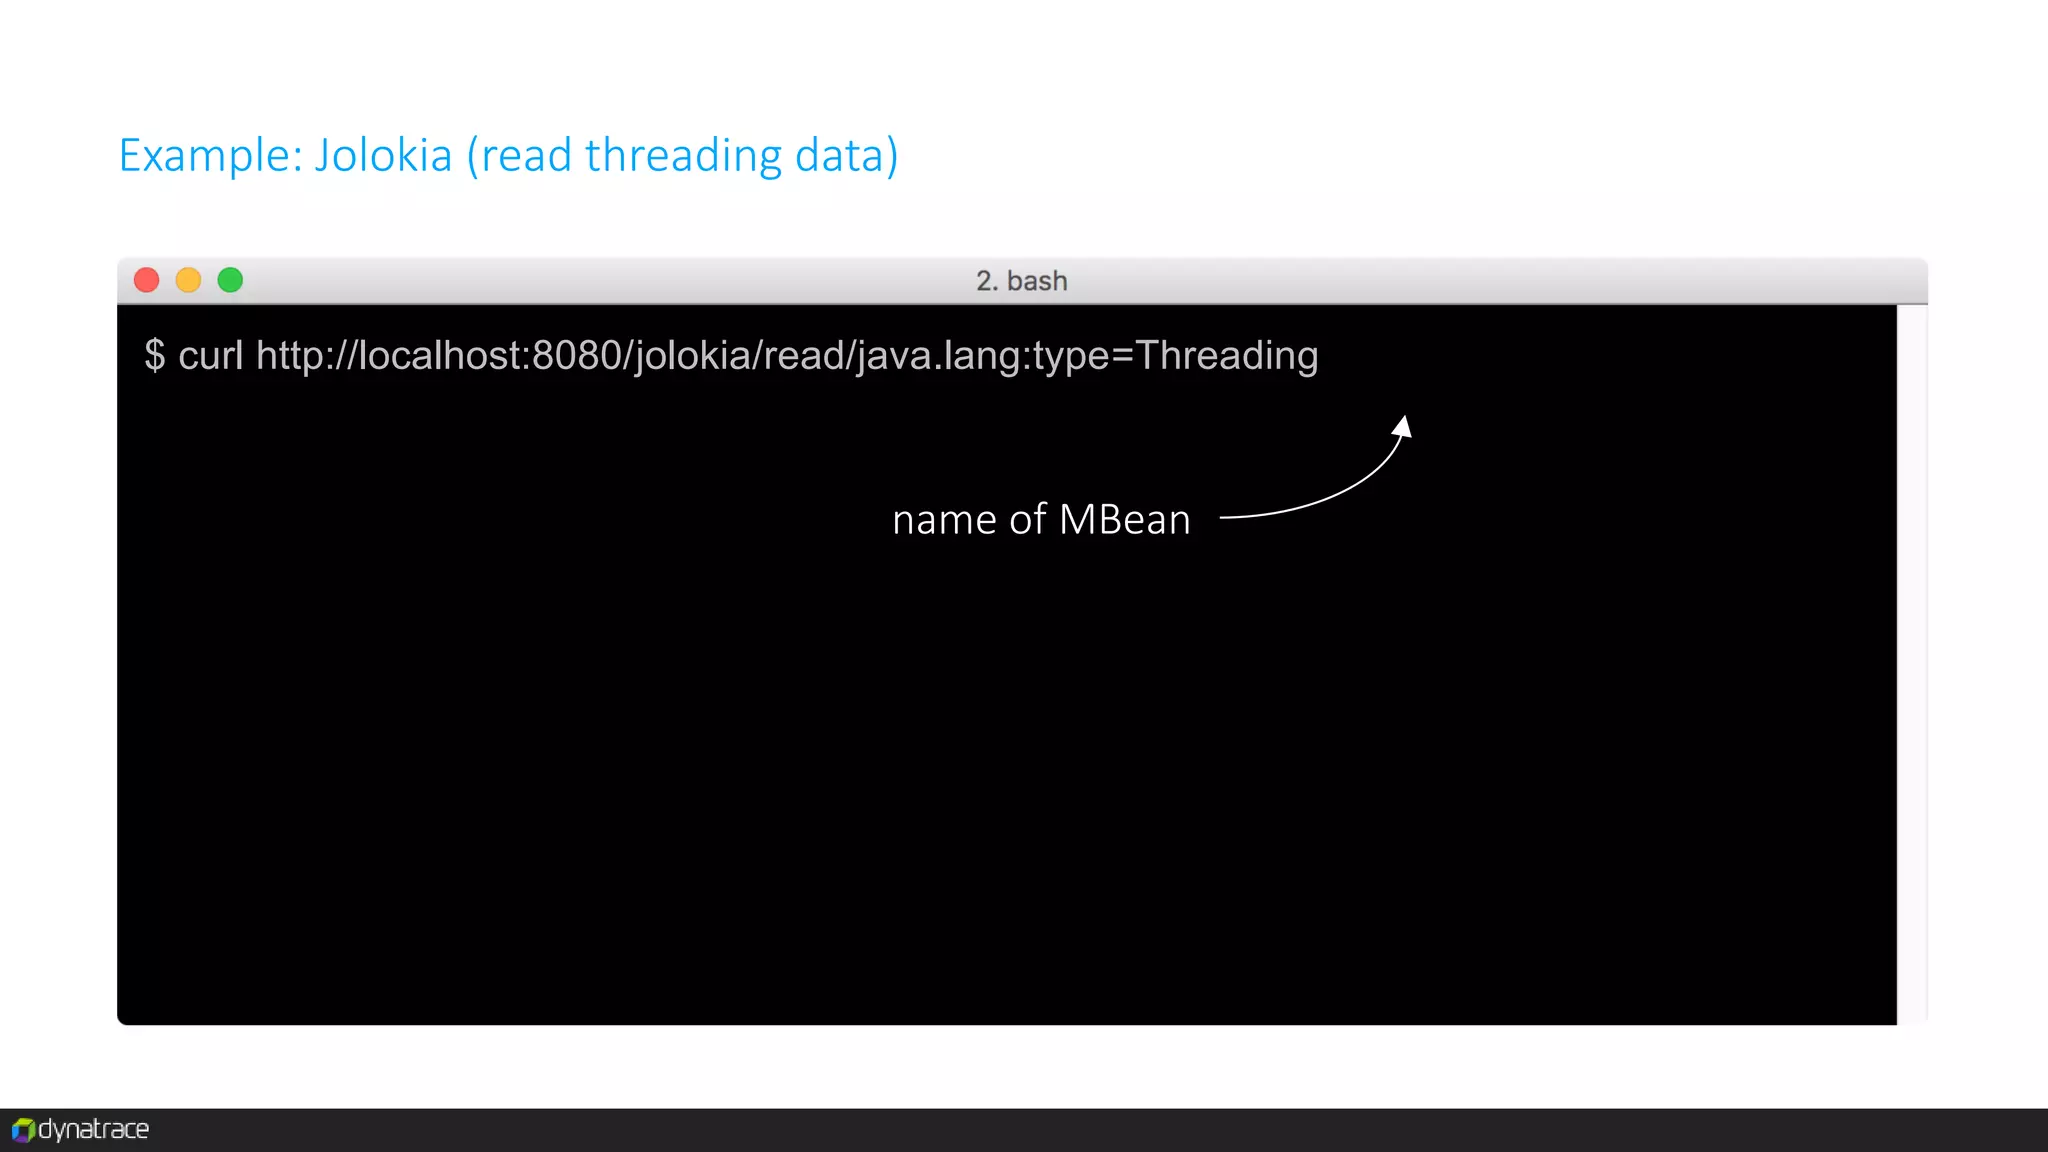
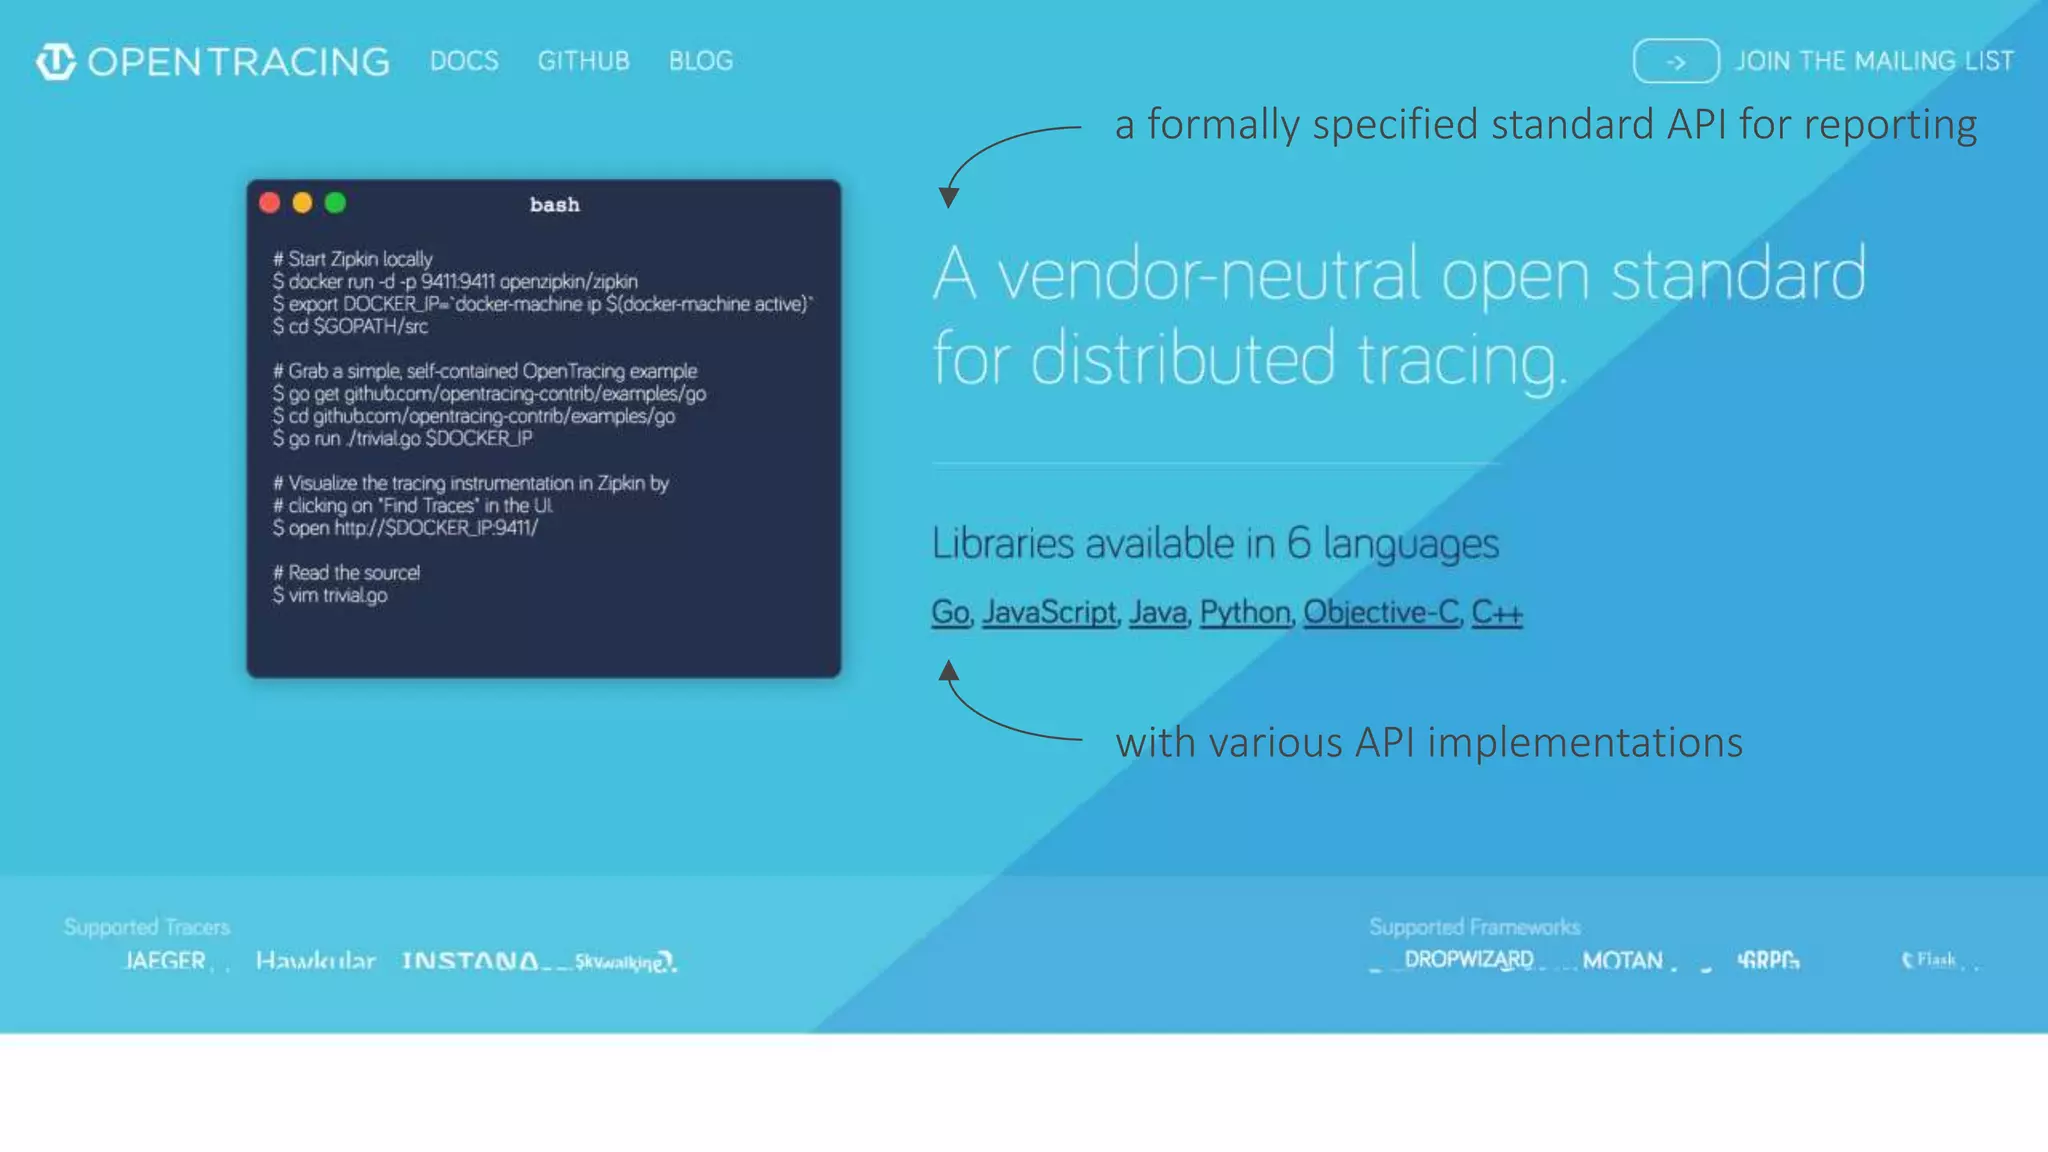
#Perform2017 with Heapster, Grafana, Fluentd, Elastic Stack, Jolokia and OpenTracing Martin Etmajer @metmajer Dynatrace, Technology Lead Monitoring, Logging and Tracing on Kubernetes
Wolfgang Amadeus Mozart 1756 – 1791
The „Jay Z“ of classical music
Mike Grabner
Schwarzenegger
Schnitzel
#Perform2017 Monitoring with Kubernetes Dashboard, Heapster, influxdb & Grafana
$ git clone https://github.com/kubernetes/dashboard.git $ kubectl create –f src/deploy/kubernetes-dashboard.yaml Example: Deploy Kubernetes Dashboard likely to be present in your kube-system already
We metrics!♥
collects resources usage, etc.
collects resources usage, etc. exposed via REST
Heapster runs in a Pod
Heapster source Kubernetes REST client sinks influxdb GCL kafkaelasticsearch GCM graphite Kubernetes Dashboard via built-in client
Example: Heapster (standalone) source Kubernetes REST client Kubernetes Dashboard via built-in client
Example: Deploy Heapster (standalone) $ git clone https://github.com/kubernetes/heapster.git $ kubectl create –f heapster/deploy/kube-config/standalone/
Example: Heapster (with influxdb and Grafana) source Kubernetes sinks influxdb grafana query
Example: Deploy Heapster (with influxdb and Grafana) $ git clone https://github.com/kubernetes/heapster.git $ kubectl create –f heapster/deploy/kube-config/influxdb/
#Perform2017 Logging with Fluentd and Elastic Stack
continuous stream of log data for each container
unified logging
Fluentd runs on each host
Example: Fluentd (for container logs to elasticsearch) watch container logs elasticsearch kibana queryingest via configuration
Example: Deploy Fluentd (for container logs to elasticsearch) $ git clone https://github.com/kubernetes/kubernetes.git $ kubectl create –f kubernetes/cluster/addons/fluentd-elasticsearch/
#Perform2017 Monitoring with Jolokia
remote access to JMX MBeans
remote access to JMX MBeans exposed via REST
Java Management Extensions (JMX) to manage and monitor applications Source: https://en.wikipedia.org/wiki/Java_Management_Extensions Dynamic MBean MXBean Standard MBean Instrumentation Level instrument resources MBeanServerAgent Level agent for registered MBeans Connectors Adaptors Remote Management Level provides access to MBeanServerRMI, HTTP/SOAP HTML, SNMP
Example: Jolokia (get list of accessible MBeans) $ curl http://localhost:8080/jolokia/list includes memory, threading, gc, etc.
Example: Jolokia (read memory usage data) $ curl http://localhost:8080/jolokia/read/java.lang:type=Memory name of MBean
Example: Jolokia (read threading data) $ curl http://localhost:8080/jolokia/read/java.lang:type=Threading name of MBean
#Perform2017 Tracing with OpenTracing
a formally specified standard API for reporting with various API implementations
design goals
Why distributed (end-to-end) tracing? Source: https://research.google.com/pubs/pub36356.html initiator services remote calls
Why distributed (end-to-end) tracing? Source: https://research.google.com/pubs/pub36356.html initiator services remote calls What does the architecture look like?What does the architecture look like?
Why distributed (end-to-end) tracing? Source: https://research.google.com/pubs/pub36356.html initiator services remote calls Where is most of the time spent?
Why distributed (end-to-end) tracing? Source: https://research.google.com/pubs/pub36356.html initiator services remote calls How are services invoked?
Why distributed (end-to-end) tracing? Source: https://research.google.com/pubs/pub36356.html initiator services remote calls Which services aren’t invoked?
#Perform2017 ...and else?
Thank you.

Monitoring, Logging and Tracing on Kubernetes

Editor's Notes

  • #10 get an overview of the applications running on the Kubernetes cluster create, modify and delete Kubernetes resources troubleshooting (logs) https://kubernetes.io/docs/user-guide/ui/
  • #20 https://github.com/kubernetes/heapster/blob/master/docs/source-configuration.md https://github.com/kubernetes/heapster/blob/master/docs/sink-configuration.md https://github.com/kubernetes/heapster/blob/master/docs/model.md