Download as PDF, PPTX

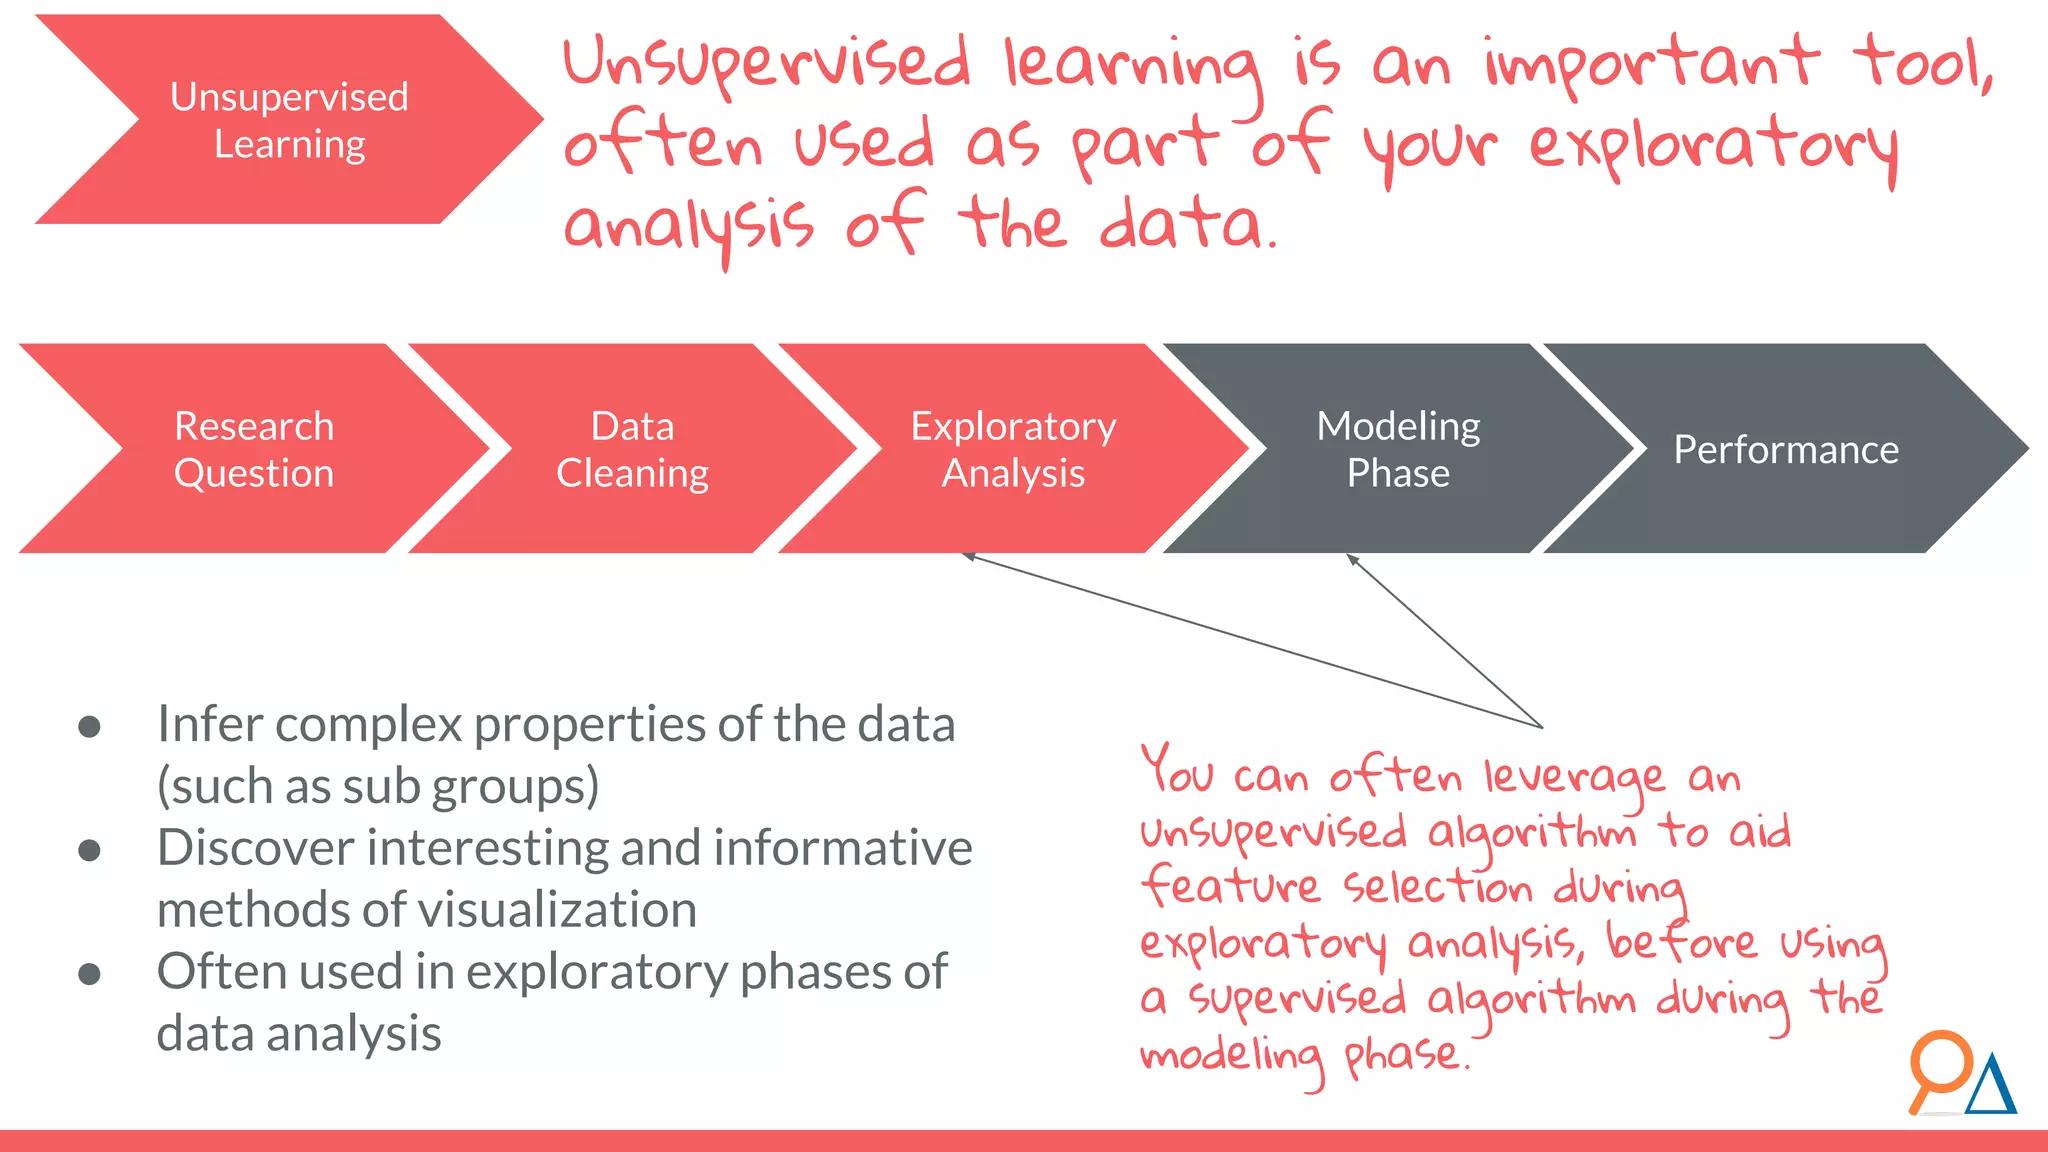
![● The “distance” here is the Euclidian distance (or spatial distance) where the distance between two vectors u and v with n elements is: ● In this example, the difference between customer c6 (7,2) and the cluster center (4,7) would be sqrt[ (7-4)^2 + (2-7)^2 ] = 5.8. Important note: Clustering does not take categorical features as inputs, only continuous. Distance between categorical points would not be meaningful. Learning Methodology How does the model learn? Review! How do we calculate distance between points? Euclidean](https://image.slidesharecdn.com/module7unsupervisedlearning2-190707205719/75/Module-7-Unsupervised-Learning-46-2048.jpg)
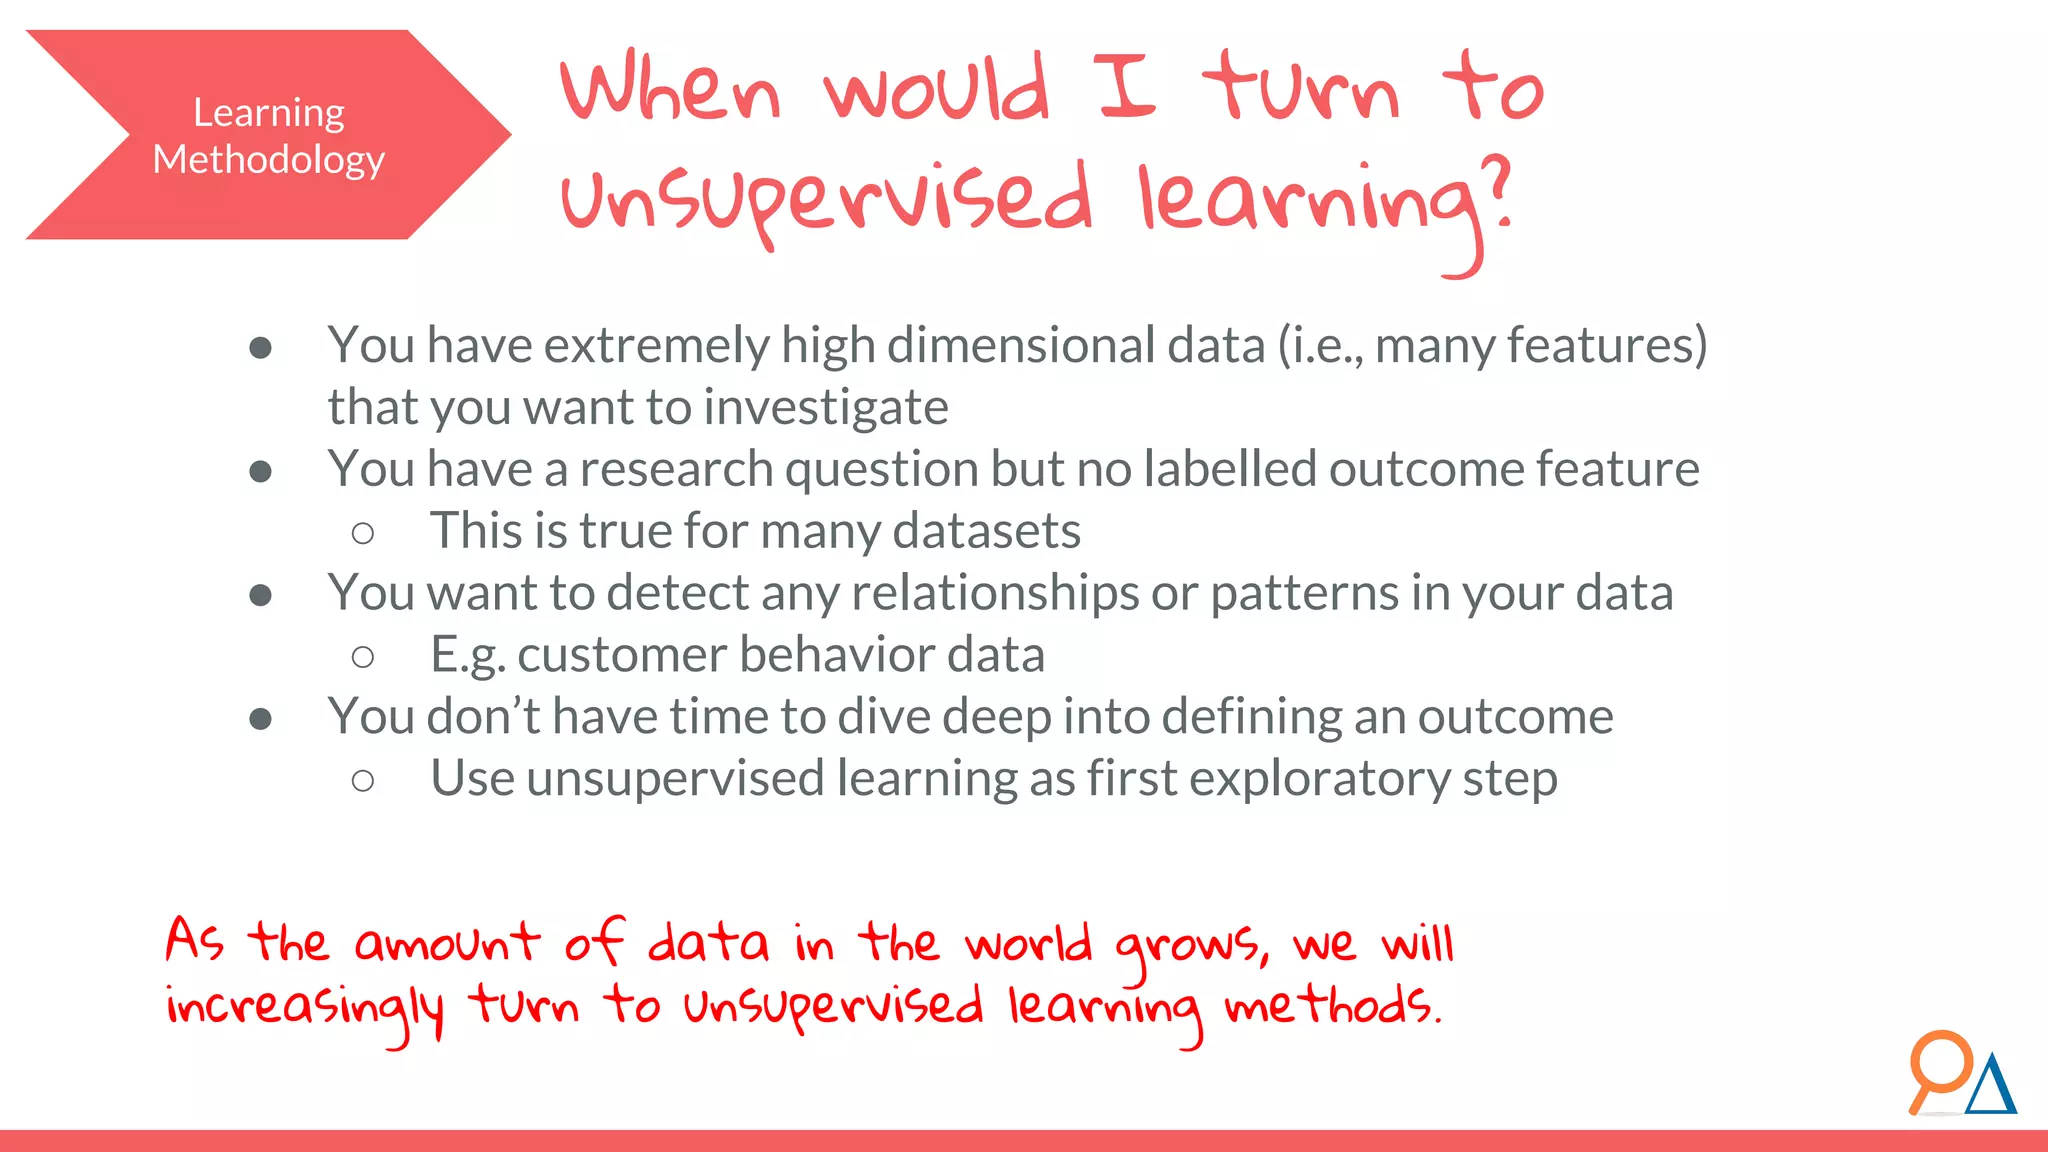
![Let’s step through the algorithm… How does the model learn? Learning Methodology Assume a simplified dataset with three features: Xa , Xb and Xc . 1. We must first standardize the data. Let the new standardized features be XA , XB and XC . For each datapoint x for each feature X, subtract the mean of X and divide by the standard deviation of X. Why? Because we will be measuring variation. If we do not standardize data, we can convert one feature from km to cm, and cause that feature’s variance to increase. Standardization ensures that our data variance is independent of whatever transformations we might use. [1] For more on why we need to standardize data, read here. XA XB XC](https://image.slidesharecdn.com/module7unsupervisedlearning2-190707205719/75/Module-7-Unsupervised-Learning-68-2048.jpg)


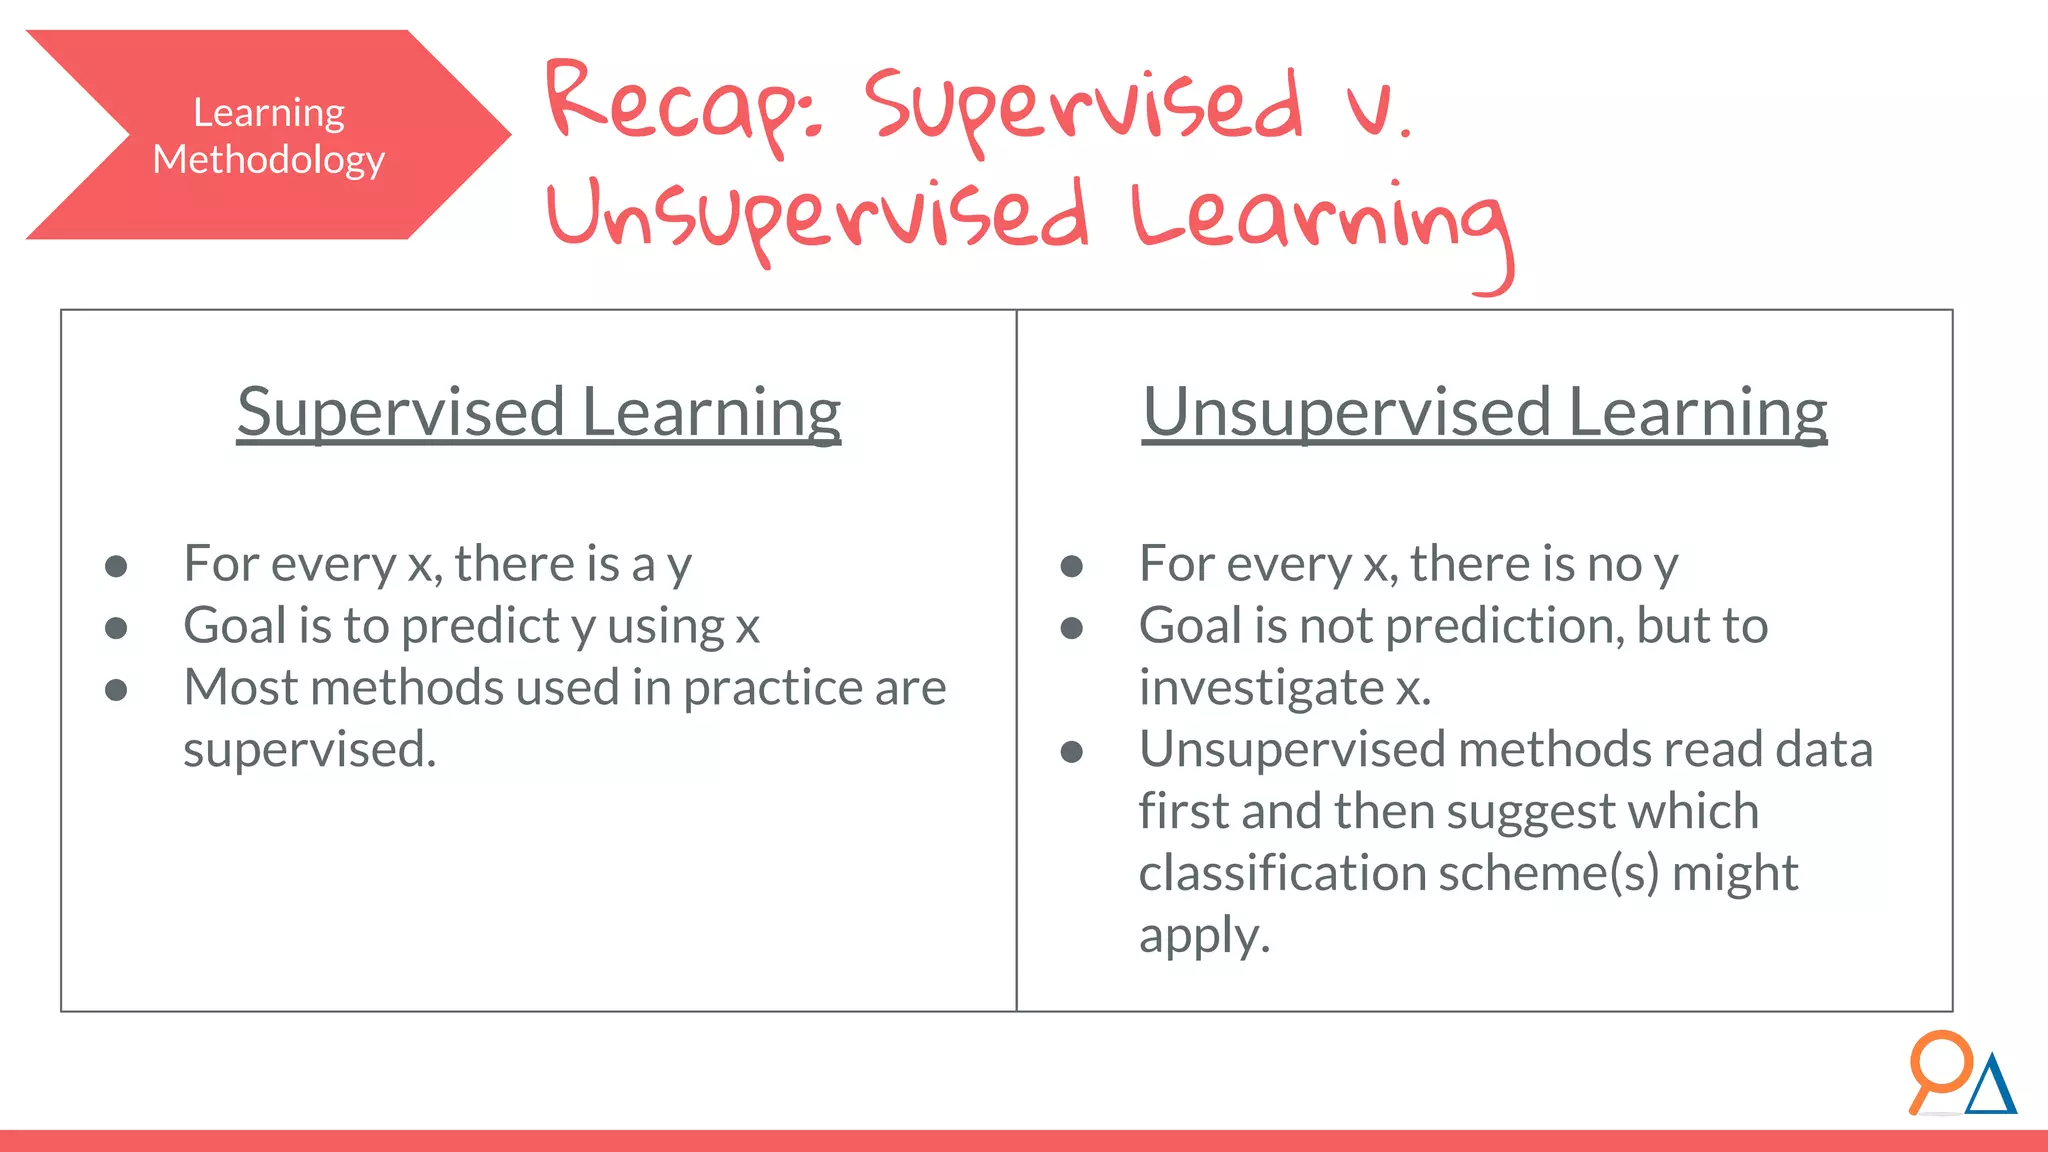
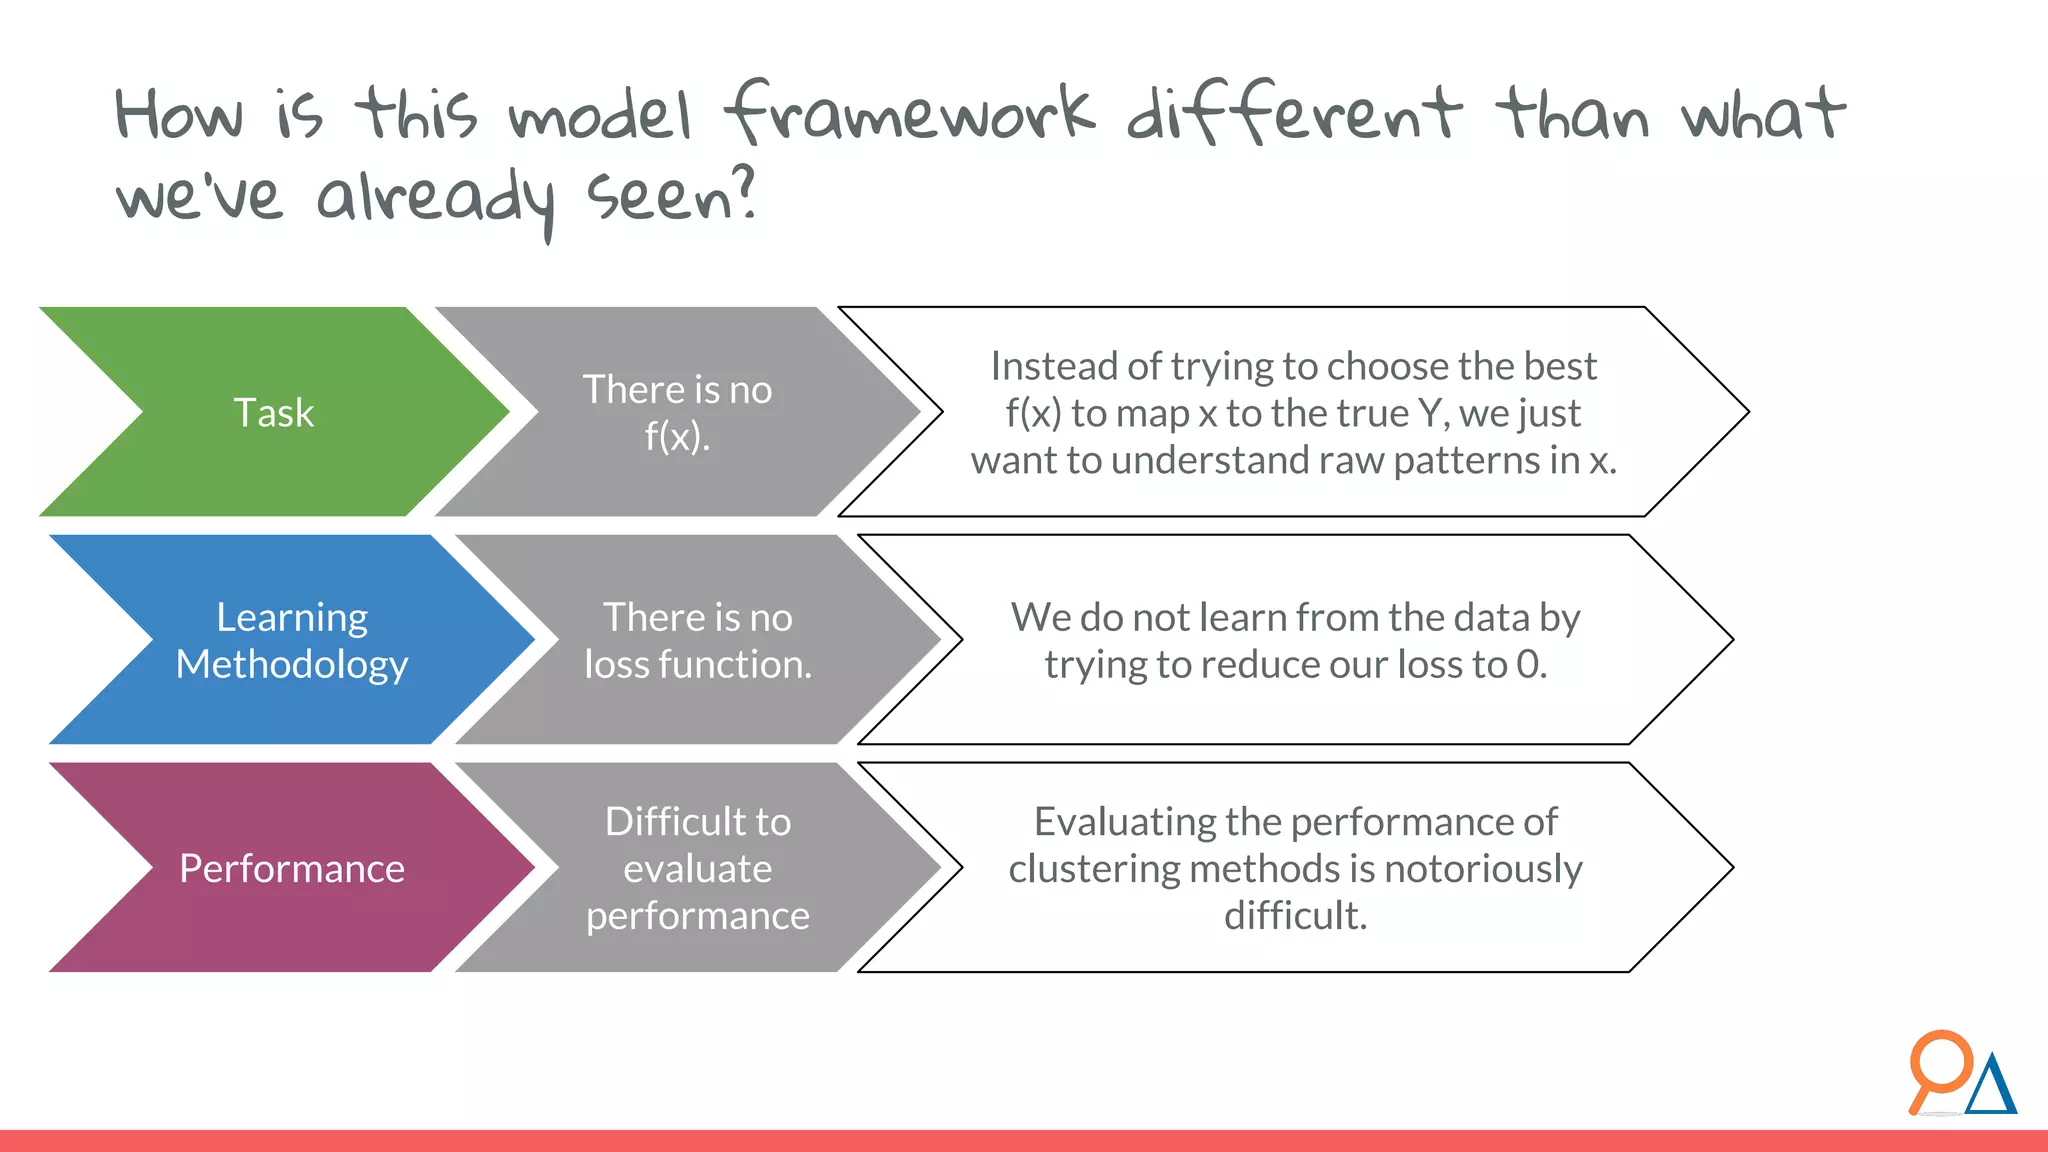
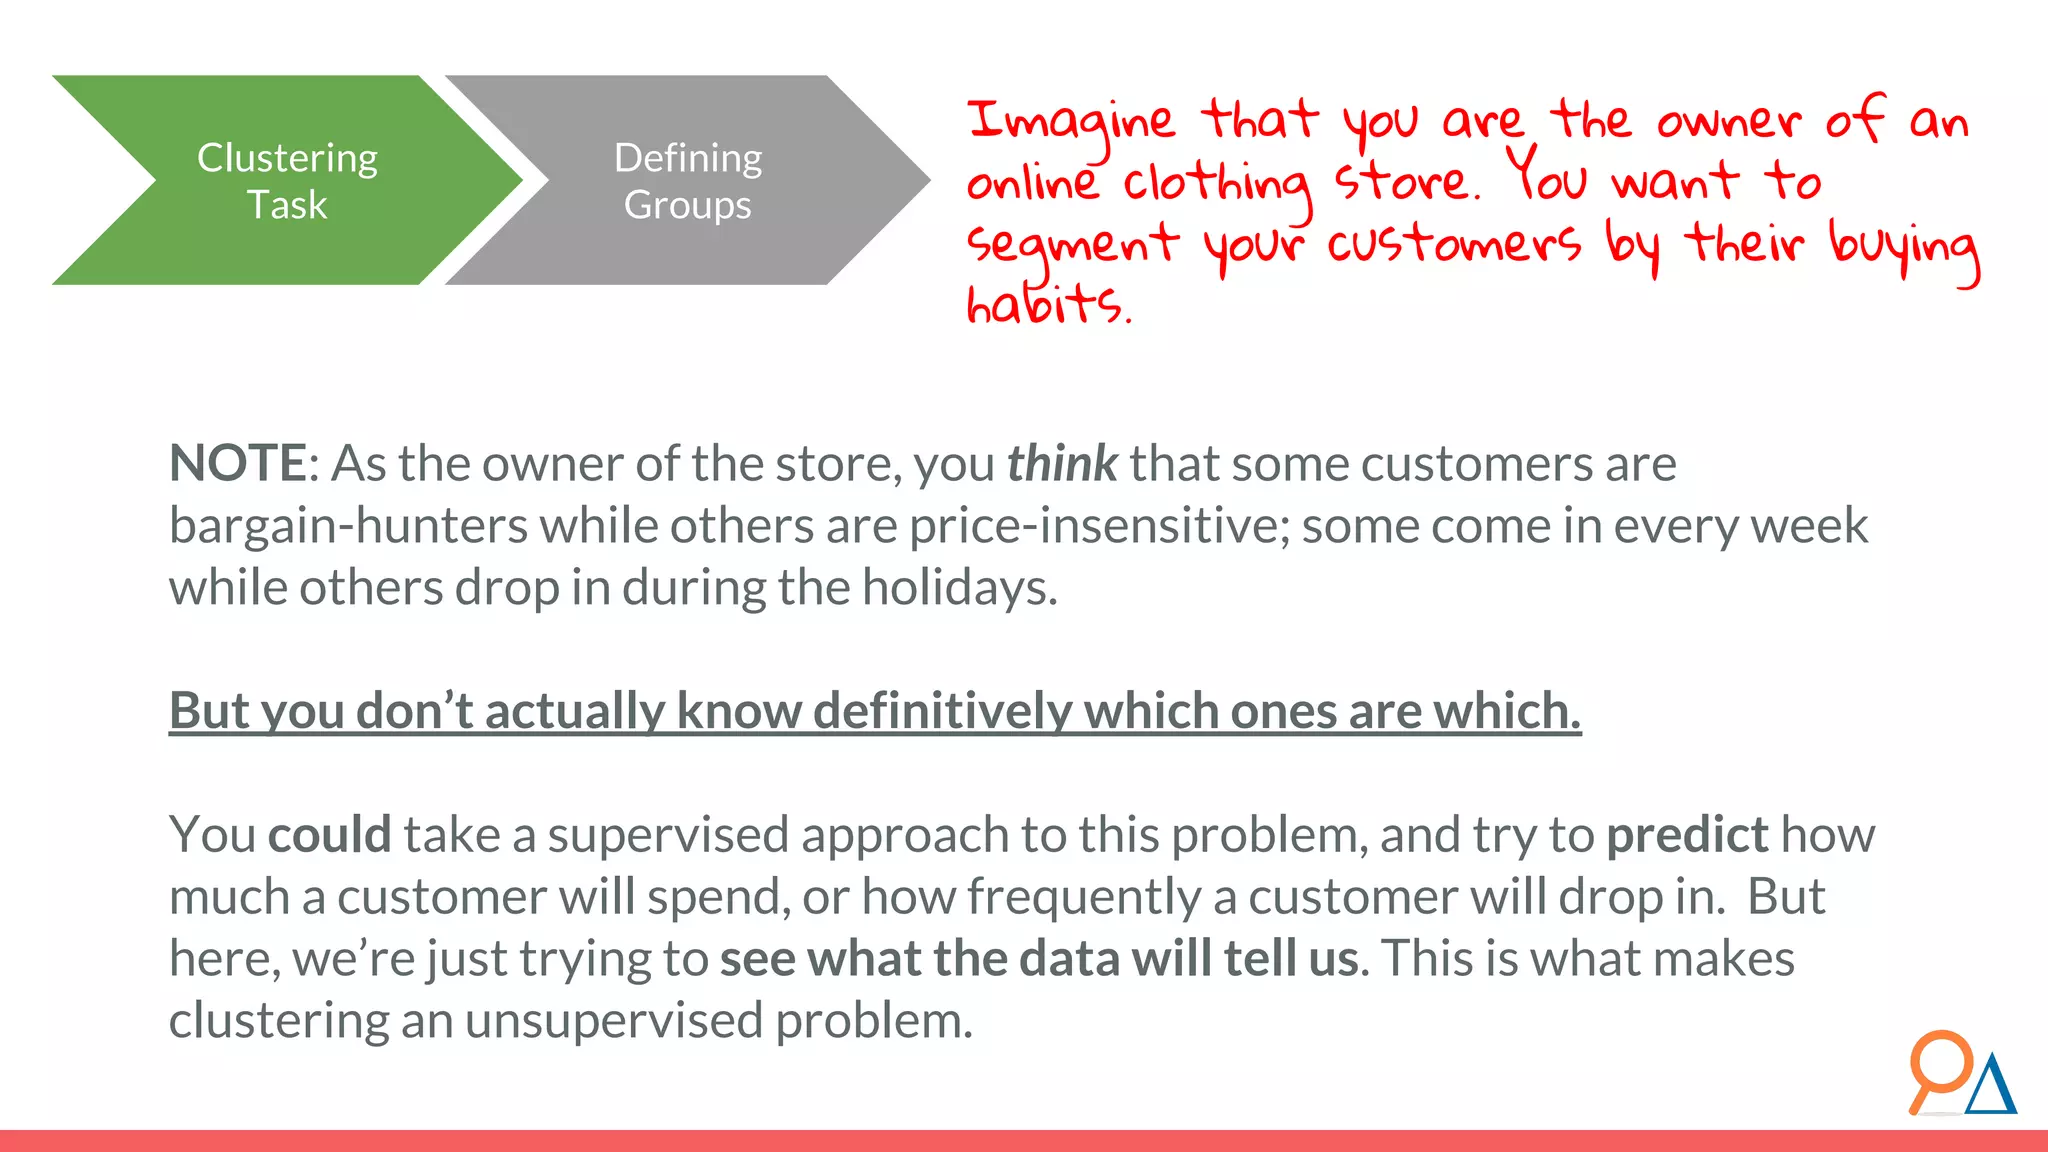
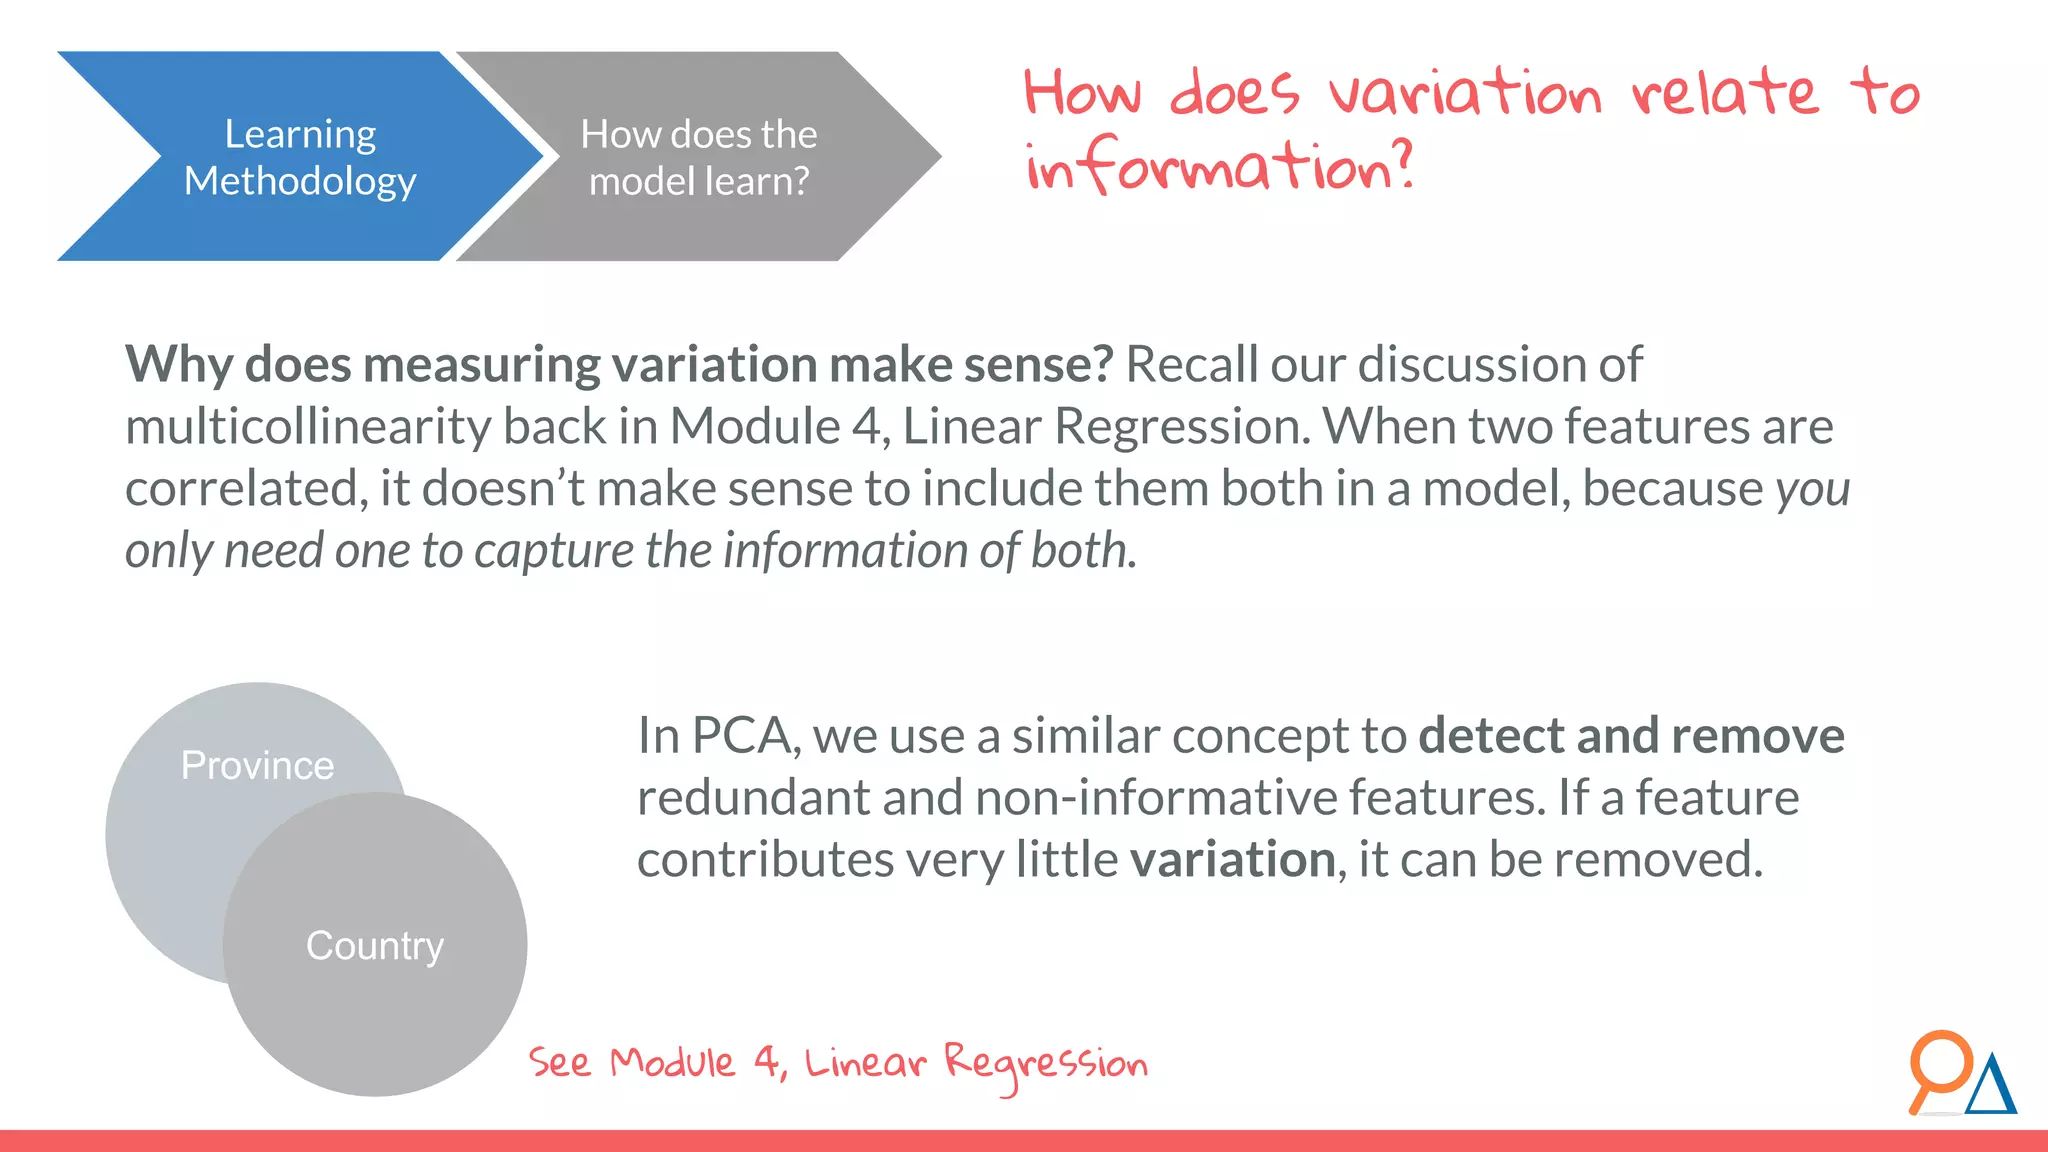
This document outlines the fundamentals of unsupervised learning, emphasizing its importance in identifying patterns without predefined labels. It covers various aspects such as clustering algorithms, particularly k-means clustering, and the challenges related to evaluating performance. The document aims to equip users with knowledge on utilizing unsupervised methods in data analysis, paving the way for improvements in machine learning capabilities.