Downloaded 43 times
![IJRET: International Journal of Research in Engineering and Technology eISSN: 2319-1163 | pISSN: 2321-7308 _______________________________________________________________________________________ Volume: 03 Issue: 07 | Jul-2014, Available @ http://www.ijret.org 7 MATLAB BASED COMPARATIVE STUDIES ON SELECTED MPPT ALGORITHMS FOR SPV SYSTEM Govardhan Rathod1 , Mahesh Gorawar2 , P.P.Revankar3 , P.G.Tewari4 1 B.V.Bhoomaraddi College of Engineering and Technology, Hubli, India. 2 B.V.Bhoomaraddi College of Engineering and Technology, Hubli, India 3 B.V.Bhoomaraddi College of Engineering and Technology, Hubli, India 4 B.V.Bhoomaraddi College of Engineering and Technology, Hubli, India Abstract The present work illustrates the development of MATLAB simulation model to compare execution efficiency and accuracy for the perturbation and observation, incremental conductance and hill climbing Maximum Power Point Tracking (MPPT) algorithms applied to 70 Wp Solar Photo-voltaic(SPV) module. The widely used MPPT algorithms with reference to SPV system are evaluated based on MATLAB developed by combining the models of established solar module with the algorithms of perturbation and observation (P&O), incremental conductance (INC) and hill climbing (HC). The model is based on mathematical equations and is described through an equivalent circuit including a photocurrent source, a diode, a series resistor and a shunt resistor. The developed model allows the prediction of PV cell behavior under different physical and environmental parameters. MATLAB coding has been done to find the maximum power output, Pm, and voltage at maximum power output, Vm, of solar module. The system is simulated under different climate conditions and MPPT algorithms. According to the comparisons of the simulation results, it can be observed that the photovoltaic simulation system can track the maximum power accurately using the three MPPT algorithms discussed in this work. Incremental conductance MPPT algorithm possesses fast dynamic response and well regulated PV output power than P&O and hill climbing algorithm. Keywords: Maximum power point tracking (MPPT), perturbation and observation, incremental conductance, hill climbing and MATLAB ---------------------------------------------------------------------***--------------------------------------------------------------------- 1. INTRODUCTION India had an installed capacity of 248.510 GW of grid power amounting to 967 TWh energy generations (May 2014 data) excluding the 39.375 GW Captive power. The total energy generated in the country has been accounted at 1102.9 TWh from all sources. [1]As per January 2012 data per capita total consumption in India to be 778 kWh owing to network technical losses (T and D losses) of 23.65% as compared to world average of less than 15% (2013 data). The government has taken initiatives to curtail T and D losses to 17.1% by 2017 and 14.1% by 2022 with reference to the national T&D losses of 24% for the year 2011[2]. The non- technical losses are also caused on account of illegal tapping of lines and faulty electric metering that has contributed to reduced payment collection. One potential initiative to prevent loss of electrical energy can be deployment decentralized power systems based on renewable energy as an alternative to grid extension to remote area. This can minimize the T & D losses along with non-technical losses arising on account of faulty metering and theft. The electric power acts as one of the key promoters in the overall development of the country through its support to basic necessities of lighting, water pumping, and comfortable living conditions, essential health care, educational aids, communication and transport. It also fuels productive activities including agriculture, commerce, manufacturing, industry, and mining. In a developing country like India globalization and urbanization have improved the living standards of the populace, lead to increase in domestic energy demand. At present the gap between supply and demand is about 10.5 percent. Most of the energy requirement is met through conventional thermal, hydel power plants, but their multistage conversion process leads to lower conversion efficiency and also higher transmission and distribution losses (about 24 percent). [3]. Further addition of traditional energy sectors increases transmission and distribution losses and pollution level in the environment, and also requires high voltage transmission systems and low voltage distribution systems. Establishment of such systems demands huge amount of money and other infrastructures. Hence it is necessary to find localized, green and sustainable energy source to reduce the apprehension of energy sectors. SPV seems to be a better choice compared to various decentralized alternatives like wind, biomass and fuel cell. SPV system directly converts solar radiation into electric energy and it is clean, reliable and compatible with any geographical conditions, and modular in nature. The power output of the SPV system diurnal and varies with change in climatic conditions; hence it is difficult to supply continuous power to the loads. For this reason it requires storage systems (battery) and charge controllers. MPPT controller is one such type charge controller operating between SPV system and battery/ loads. It always matches the operating parameters of battery/ loads with maximum operating conditions of the SPV systems. Several](https://image.slidesharecdn.com/matlabbasedcomparativestudiesonselectedmppt-140821050122-phpapp01/75/Matlab-based-comparative-studies-on-selected-mppt-1-2048.jpg)
![IJRET: International Journal of Research in Engineering and Technology eISSN: 2319-1163 | pISSN: 2321-7308 _______________________________________________________________________________________ Volume: 03 Issue: 07 | Jul-2014, Available @ http://www.ijret.org 8 researchers have developed various types of algorithms for MPPT controller. The prominent among these are voltage feedback method, perturbation and observation method, linear approximation method, incremental conductance method, hill climbing method, actual measurement method, fuzzy control method. 2. LITERATURE REVIEW Several researchers reported on theoretical model and experimental results MPPT controller of SPV system to explain electrical performance subjected to different operating conditions. Most relevant reported research results are presented below. Altas et. al. (2007), simulated PV array in MATLAB/Simulink and GUI environment on the model developed using basic circuit equations of SPV cells to incorporate effect of solar irradiation and temperature. The model was tested using a directly coupled dc load and ac load via an inverter. Test and validation studies with proper load matching circuits were simulated and the model had a generalized structure to be used as a PV power generator along with wind, fuel cells and small hydro system by establishing proper interfacing and controllers. [4] Tsai et. al. (2008), presented a generalized PV model using MATLAB/Simulink. User friendly user defined icon was used in model to simulate SPV system in conjunction with power electronics for MPPT under different illumination and cell temperature [5]. Zainudin et al. (2010), compared Buck, Boost and Buck- boost type DC-DC converters at various irradiation and cell temperature conditions based on incremental conductance and perturb and observe algorithms, using MATLAB/ SIMULINK. The results showed that incremental conductance algorithm gave better results than perturb and observe algorithms. [6] Alsadi et al., (2012), developed SIMULINK model to analyze DC-DC boost converter, used to track MPP of SPV module operating at standard test conditions. The simulation results had good agreement with experimental results of standard 50 Wp SPV module [7]. Salmi et. al., (2012), developed MATLAB/ Simulink model to study SPV system operating under different physical and environmental parameters based on fundamental circuit equations taking into series and shunt resistor. The simulink results experimentally validated by high efficient PVL-124 solar laminate panel indicated good agreement [8]. Seifi et. al., (2013), developed Simulink model using circuitry models of solar cell developed based on single, two and three diode concepts. It was observed that the results of two diode model were close the real situation as compared to the other models. [9] M. Abdulkadir et. al. (2013), presented simulation model for PV system operating at any solar insoaltion and temperature, developed using LABVIEW. The simulation results were validated through 36 Wp PV systems. It was found that the simulation results were better and more accurate for any insolation and temperature and can be used for design of PV systems. [10] Keles et. al., (2013), discussed transient and steady state behaviors of solar cells at different solar insolation and temperature. MATLAB/Simulink model was developed to analyze the solar cell behavior and it was observed that the model was more efficient in computational complexity and easy to configure for wide range of PV installation [11] Belhaouas et. al., (2013), developed MATLAB/Simulink model of solar cells in normal operating and partially shaded conditions using two diodes and more than one bypass diodes. The I-V curve nonlinearity was analyzed by adjusting open circuit voltage, maximum power and short circuit current. The two diode model suited best for simulation of I-V curve and energy production increased for three and more string bypass diodes but at increased complexity. [12] Sahu et. al. (2013), presented MATLAB/simulink SPV system connected three phase inverter developed on exponential equation for harmonic distortion analysis due to I-V and P-V curve variations of at different irradiation and temperature. The simulation had agreement with experimental data of KC200GT PV module and capable of being extended to grid system. [13] Hayrettin (2013) developed MATLAB/Simulink PV panel emulator for buck converter and tested with actual PV panel under dynamic conditions. The simulation had good agreement with actual PV panel readings for various load conditions and had good dynamic response. [14] Santamaria et al. (2013), discussed microgrids developed with careful design and intelligent operation for renewable energy predictions like that for SPV system. The microgrid facilities indicated cell temperature had a negative effect above of 25 °C apart from the relation between radiation and short-circuit current depended on irradiation level on the panels. [15] Chowdhury et. al (2013), investigated grid-connected SPV system with harmonic compensation based on tests to validate practicability for multiple PV array interface with grid. The topology of a multi-string two stage PV module with a centralized inverter was developed for medium power applications. The system performance and transient responses for a disturbance and system stability was evaluated for change in solar irradiation or system fault [16] Karki et. al (2013), studied computer simulation of grid- connected SPV system in distribution power network using MATLAB/Simulink and SIM Power System tool based on hourly solar irradiance and ambient temperature on a sunny day. Power generated by the system totally depends on solar irradiance and cell temperature [17].](https://image.slidesharecdn.com/matlabbasedcomparativestudiesonselectedmppt-140821050122-phpapp01/75/Matlab-based-comparative-studies-on-selected-mppt-2-2048.jpg)
![IJRET: International Journal of Research in Engineering and Technology eISSN: 2319-1163 | pISSN: 2321-7308 _______________________________________________________________________________________ Volume: 03 Issue: 07 | Jul-2014, Available @ http://www.ijret.org 9 Parekh et. al (2013), investigated non-linear V-I Characteristics SPV module using the circuit based model of SPV using power system block set under MATLAB/Simulink. Simulator was verified by 36 W PV module and found better for any irradiance and temperature [18]. Vineet Singla et. al (2013), generalized SPV model for a representative of PV cell, module or array to estimate electrical behavior for changes in environmental parameter. The essential parameters for modeling are taken from datasheets of typical 60W solar panel is used for developed model evaluation and simulation results are compared with points taken directly from the manufacturer’s published curves and show excellent correspondence to the model. [19] 3. METHODS OF MPPT This section illustrates basic operation for P&O, incremental conductance and hill climbing methods. Basically, three MPPT algorithms discussed in this work have to achieve the condition (dP/dV = 0) to find the maximum power point of PV modules. 3.1 Perturbation and Observation Method P&O method is the most frequently used MMPT algorithm due to its simple structure and fewer required parameters. In a fixed period of time, the load of the PV system is adjusted in order to change the terminal voltage and output power of the PV modules. If perturbation in this time results in greater output power of PV modules than that before variation, output voltage of PV modules will be varied toward same direction. It can be observed that regardless of the magnitude of sun insolation and terminal voltage of PV modules, the MPP is obtained while the condition dP/dV = 0 is accomplished. The slope (dP/dV) of the power can be calculated by the consecutive output voltages and output currents, and can be expressed as follows, )1()( )1()( )( nVnV nPnP n dV dP (1) Where P(n) = V(n) I(n) The maximum output power point of a PV system can be obtained by using these iterative perturbation, observation and comparison steps. 3.2 Incremental Conductance Method The theory of the incremental conductance method is to determine the variation direction of the terminal voltage for PV modules by measuring and comparing the incremental conductance and instantaneous conductance of PV modules. The output power: increases linearly with the terminal voltage of PV modules (dP/dV > 0), output power decreases linearly with the increase in terminal voltage (dP/dV < 0) and operating point is at MPP (dP/dV = 0). dV dI VI dV dI V dV dV I dV VId dV dP )( (2) By the relationship of dP/dV=0, (2) can be rearranged as follows, V I dV dI (3) It can be observed that the weather conditions don’t change and the operating point is located on the maximum power point when dV = 0 and dI = 0. If dV = 0 but dI > 0, it represents that the sun irradiance increases and the voltage of the maximum power point rises. On the contrary, the sun irradiance decreases and the voltage of the maximum power point reduces if dI < 0. At this time the maximum power point tracker needs to reduce the operating voltage of PV modules. 3.3 Hill Climbing Method The basic operating theory of the hill climbing method is similar to that of the P&O method. Both methods use the condition that P (n) is greater than P (n-1) or not to make the judgment. As described in previous sections, the P&O method uses the condition dP/dV to determine whether the maximum power point has been found or not. However, the hill climbing method uses the condition dP/dD to judge. In most applications, DC-DC converters and DC-AC inverters are usually used as the power interface devices between PV modules and loads. The hill climbing method uses the duty cycle (D) of these switching mode power interface devices as the judging parameter when the task of the maximum power point tracking is implemented. When the condition dP/dD = 0 is accomplished, it represents that the maximum power point has been tracked. The duty cycle in every sampling period is determined by the comparison of the power at present time and previous time. If the incremental power dP > 0, the duty cycle should be increased in order to make dD > 0. If dP < 0, the duty cycle is then reduced to make dD < 0. 4. RESULTS AND DISCUSSIONS MATLAB is used for modeling and simulation of PV panel when operated on stated MPPT algorithms to determine accuracy and efficiency of the MPPT techniques. The specification of series 36 solar cells PV module SPI-SUN SIMULATOR 4600SLP under the test conditions of 1000W/m2 , AM1.5 and 25 o C are listed in Table 1. The values of the Table 1are used to generate the Matlab code. Table -1: Specifications of the SPI-sun simulator 4600SLP PV module Model SPI-SUN SIMULATOR 4600SLP Irr 100mW/cm2 Tested at Temp 27.60 C Corrected to temp 250 C VOC 22.224 V](https://image.slidesharecdn.com/matlabbasedcomparativestudiesonselectedmppt-140821050122-phpapp01/75/Matlab-based-comparative-studies-on-selected-mppt-3-2048.jpg)
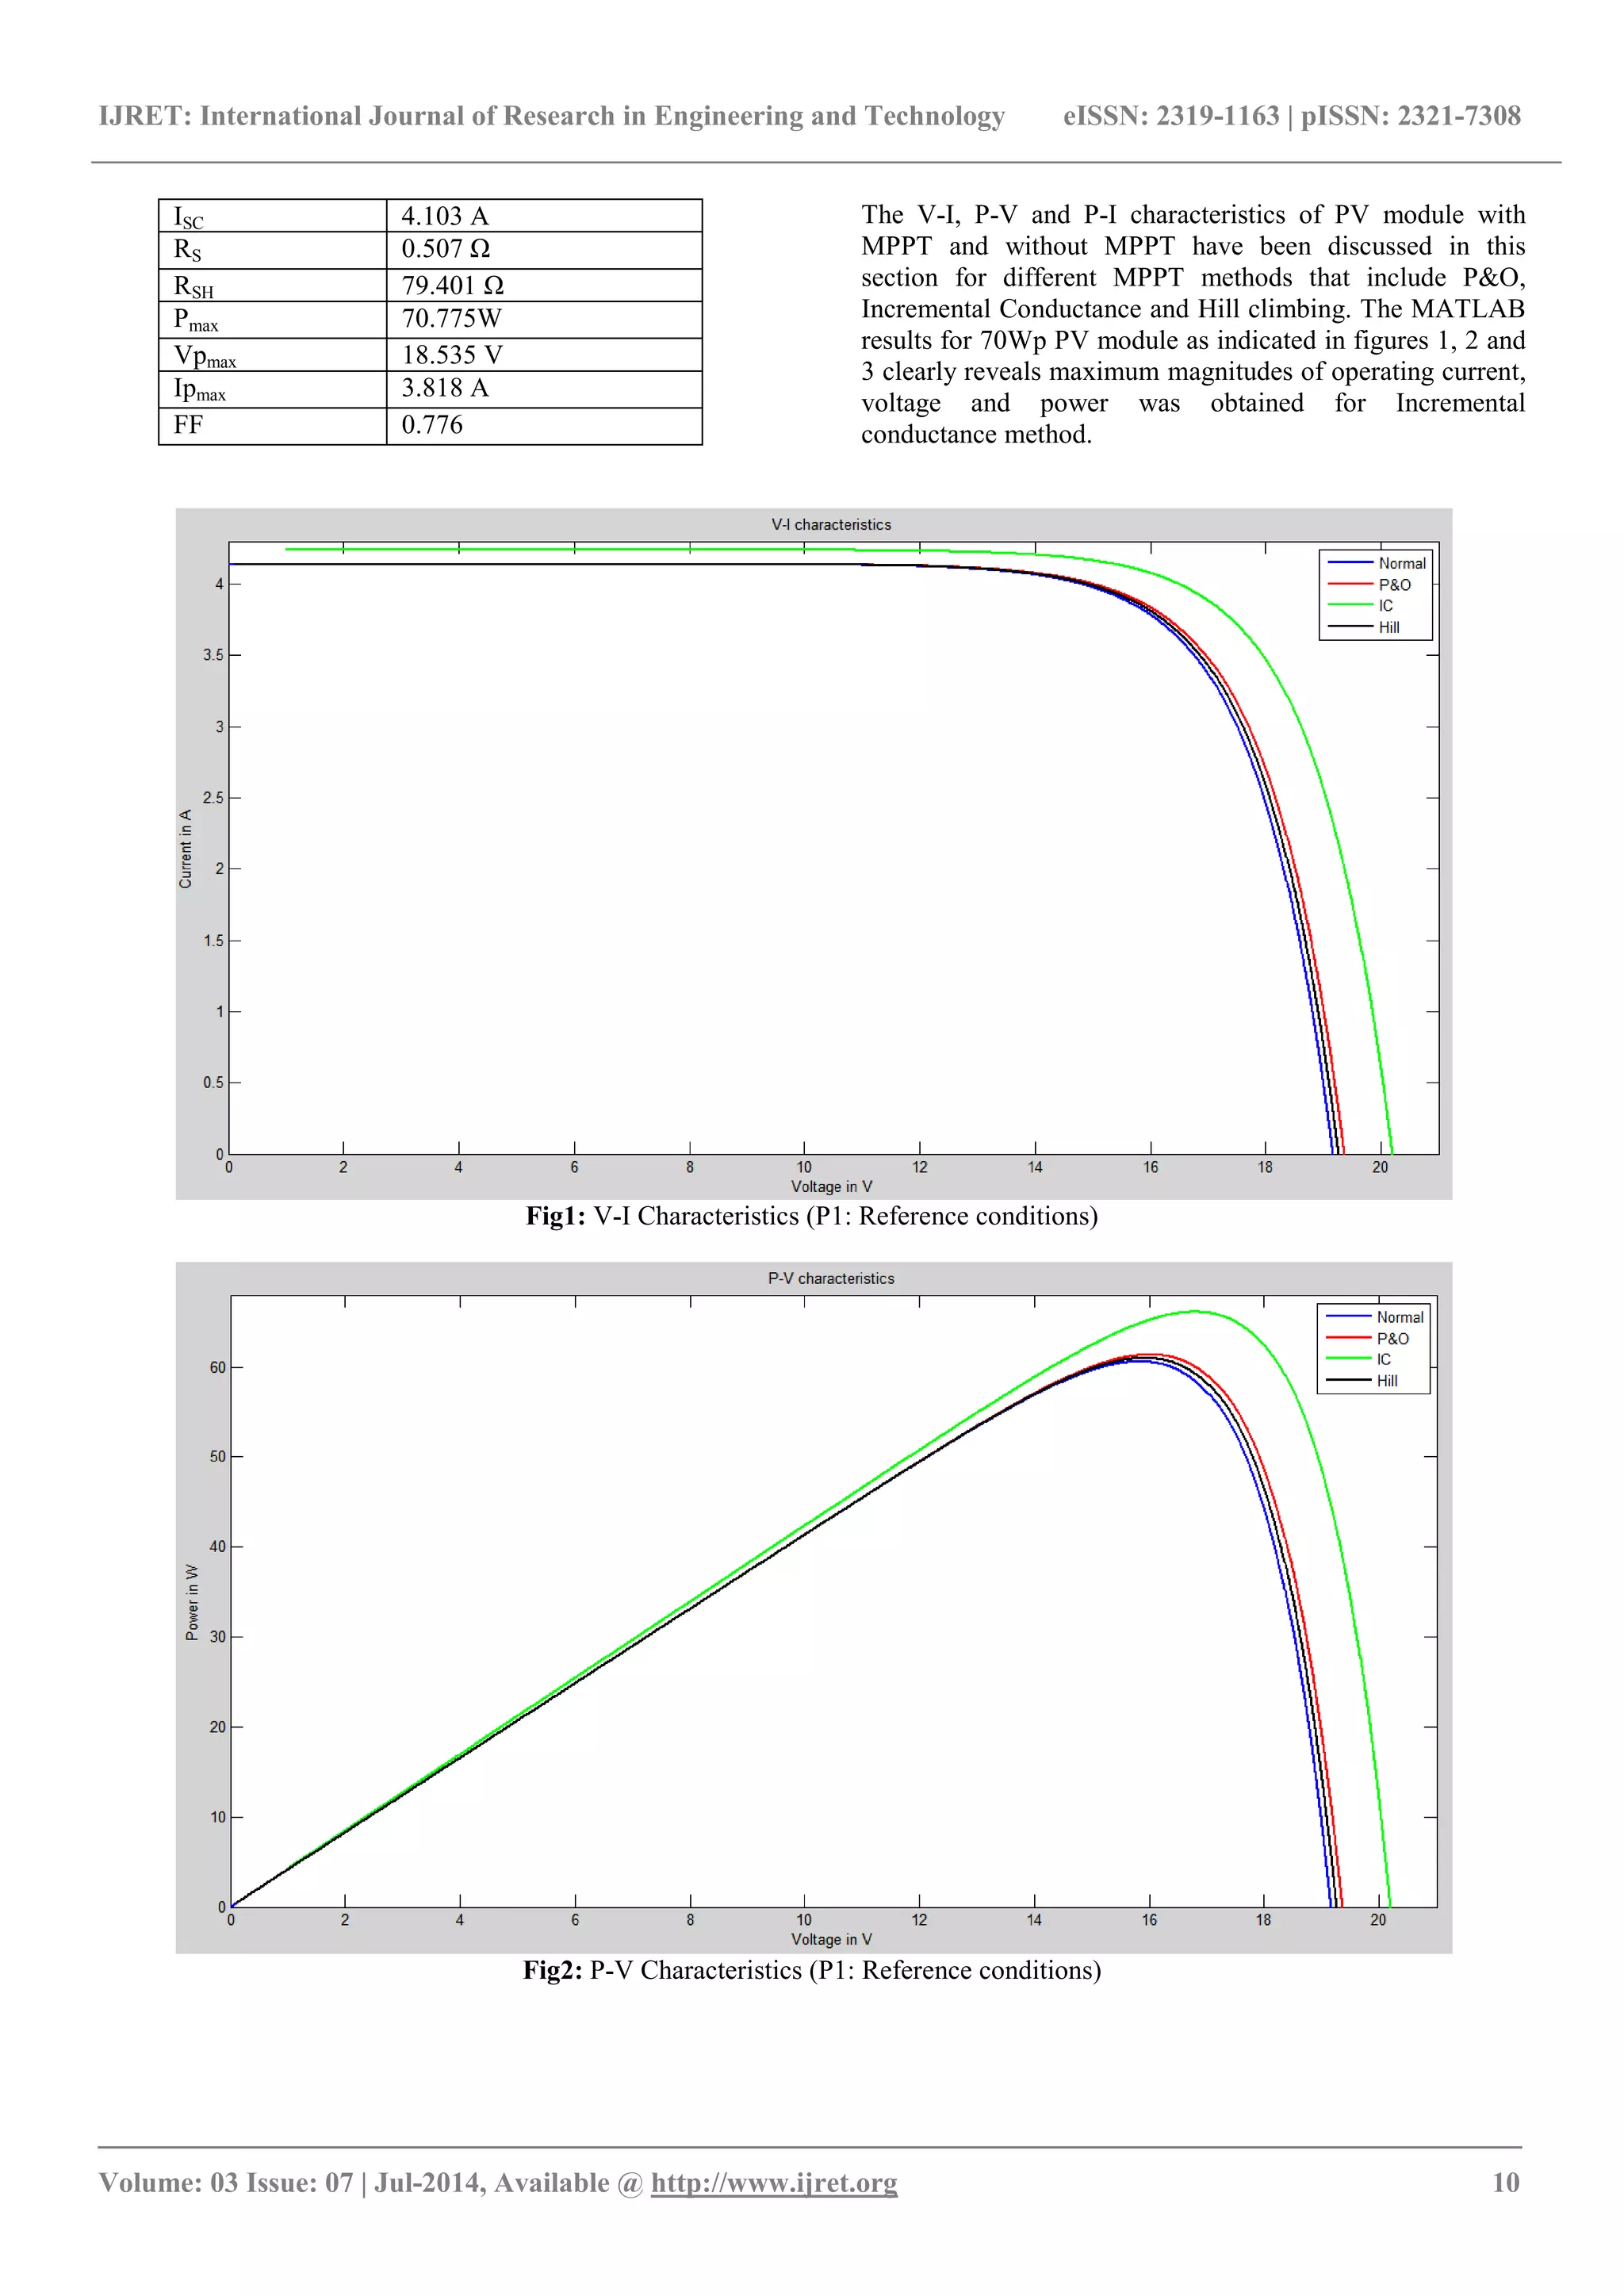
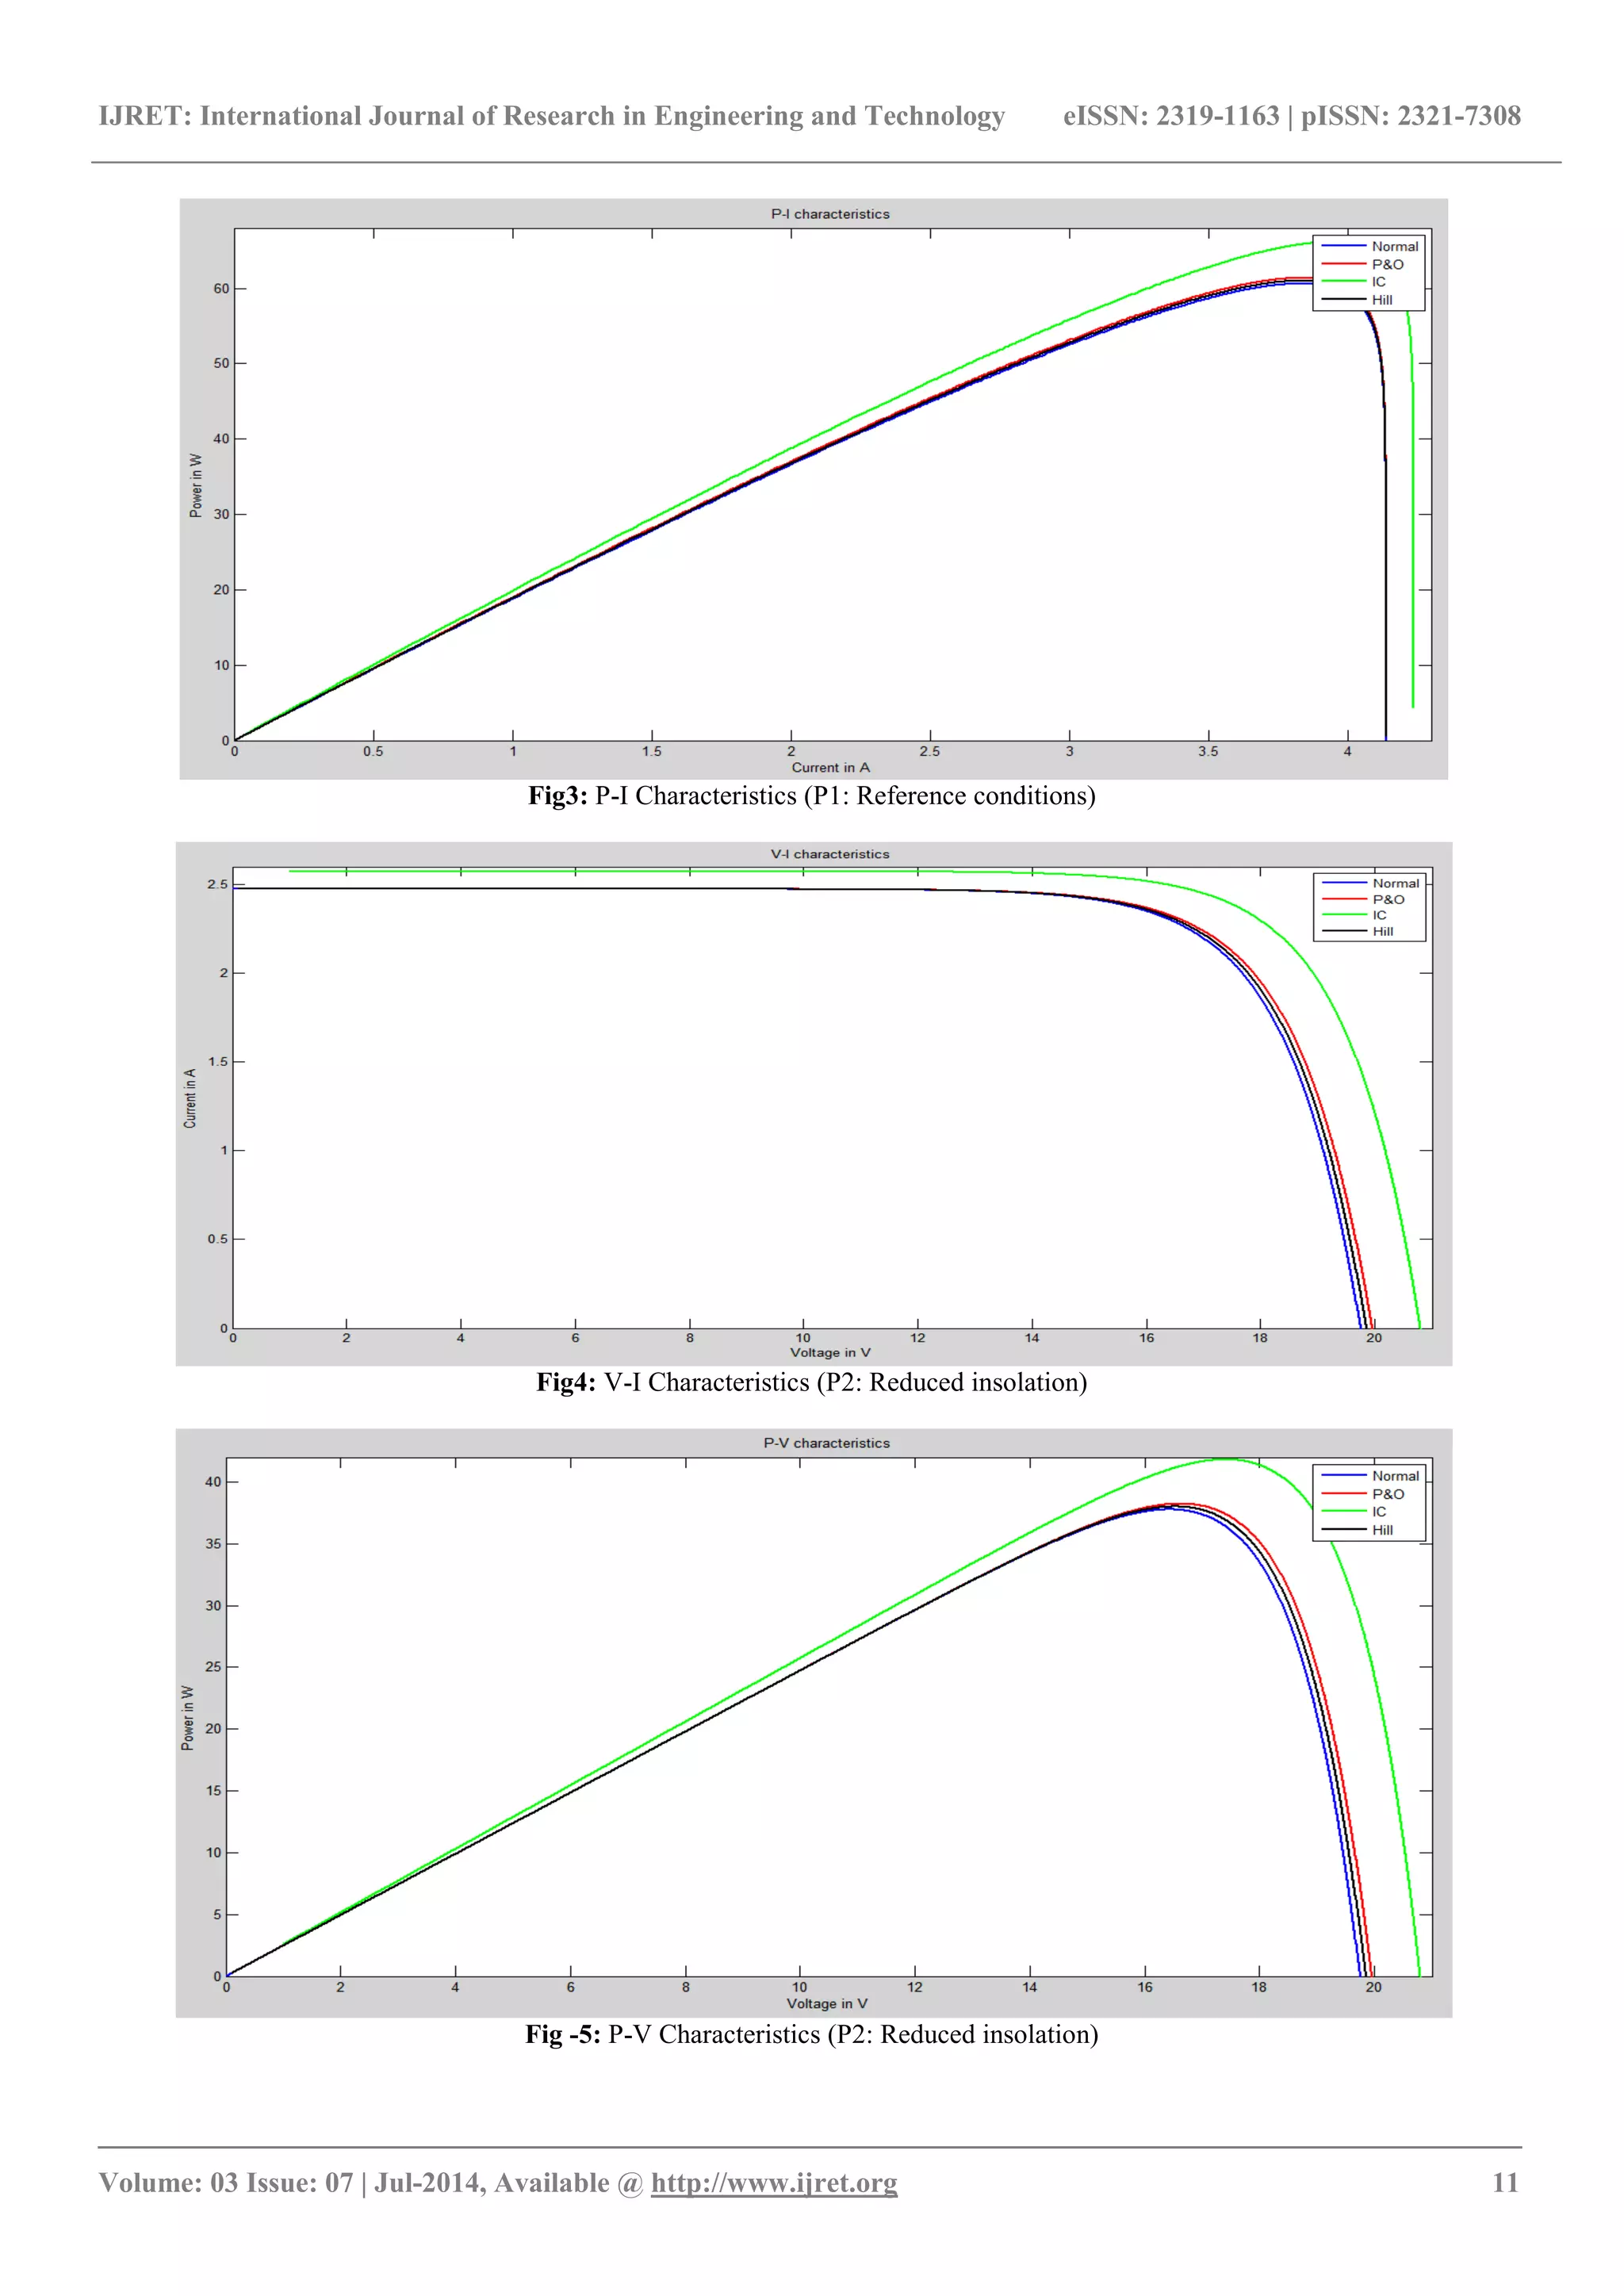
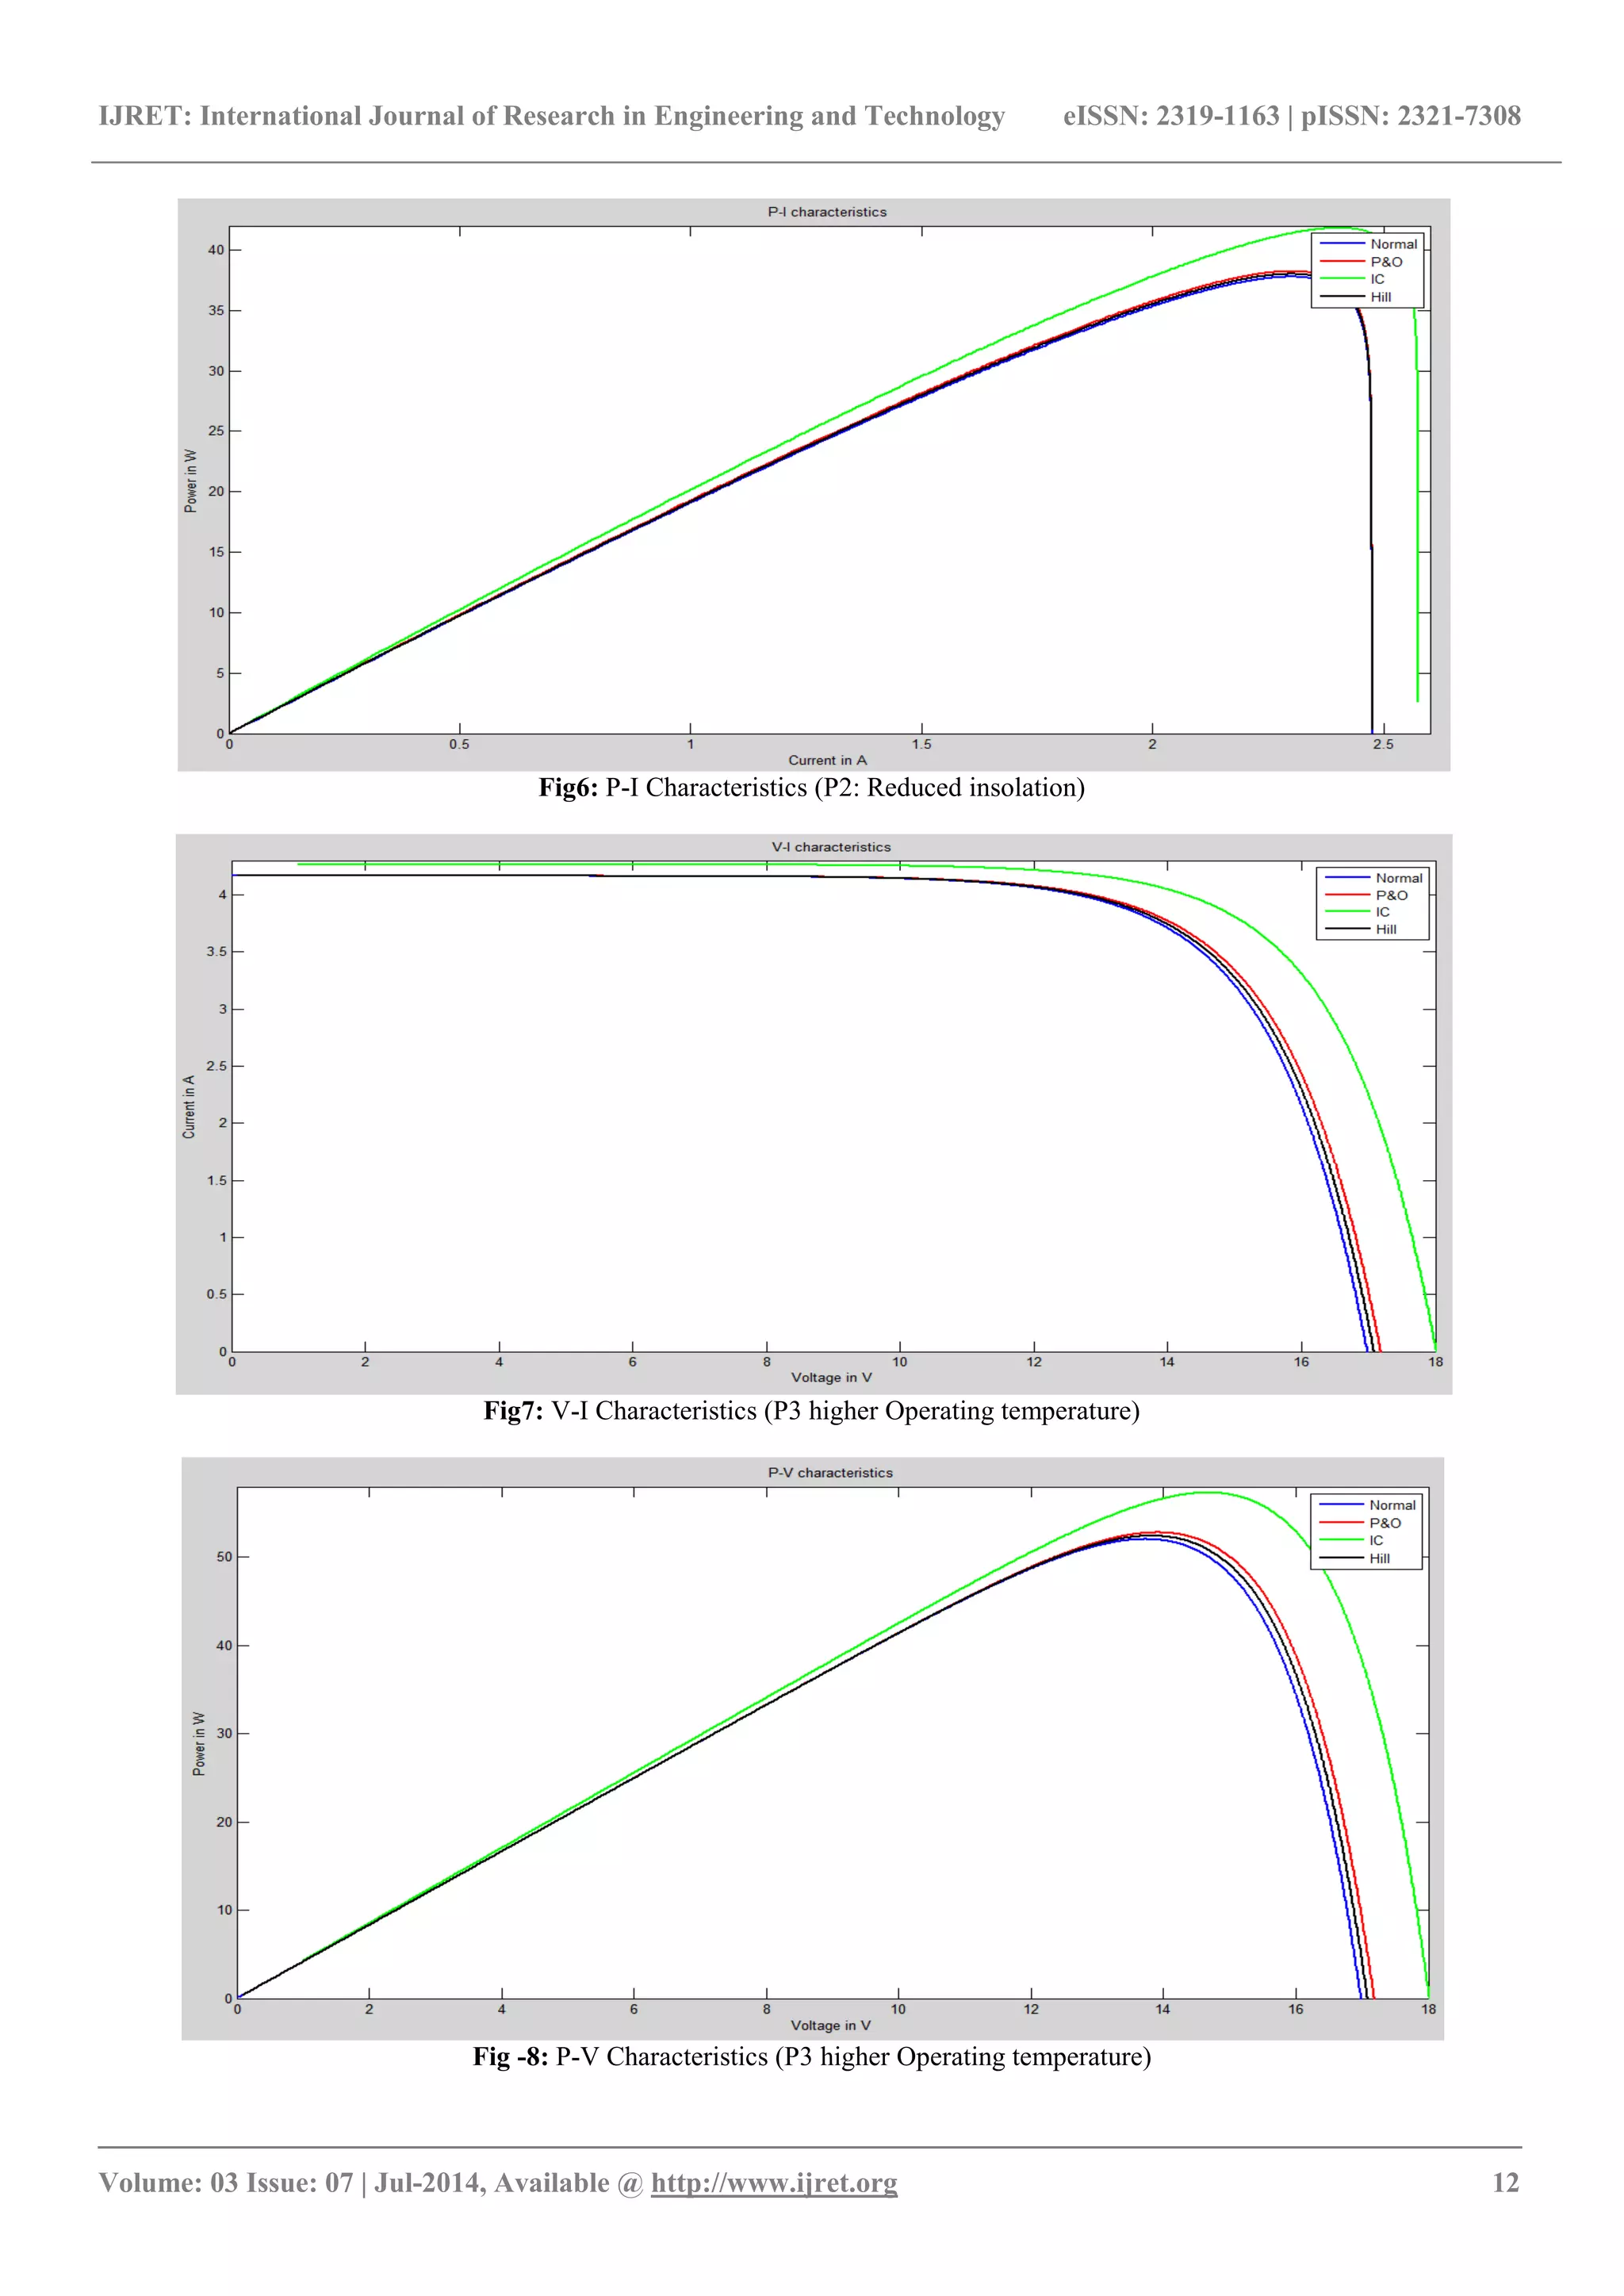
![IJRET: International Journal of Research in Engineering and Technology eISSN: 2319-1163 | pISSN: 2321-7308 _______________________________________________________________________________________ Volume: 03 Issue: 07 | Jul-2014, Available @ http://www.ijret.org 13 Fig -9: P-I Characteristics (P3 higher Operating temperature) The Figs 4, 5 & 6 shows the V-I, P-V and P-I characteristics curves of PV module with reduced insolation level. It is very clear that current generated increases with increasing solar irradiance and maximum output power also increases. On the other hand voltage is staying almost constant and it is not varying much. We observe from Figs. 4, 5 and 6 that with decrease of solar insolation, the short-circuit current of the PV module decreases, and the maximum power output decreases as well. The reason is the open-circuit voltage is logarithmically dependent on the solar radiation, yet the short-circuit current is directly proportional to the solar radiation. Figs 7, 8 & 9 shows the V-I, P-V and P-I characteristics curves of PV module with different cell temperature. The output current and power of PV cell depend on the cell’s terminal operating voltage and temperature, and solar insolation as well. We find from Figs. 7, 8 and 9 that with increase of working temperature, the short-circuit current of the PV cell increases, whereas the maximum power output decreases. As the increase in the output current is much less than the decrease in the voltage, the net power decreases at high temperatures. Table2: Peak power output of SPV panel at different test conditions Sl.No Type P1 P2 P3 1 Without MPPT 60.59 37.78 52.05 2 P&O 61.36 38.24 52.81 3 Incremental Conductance 66.11 41.82 57.32 4 Hill Climbing 60.98 38 52.43 Table 2 shows the output power of solar PV module where P1 represents the output power at insolation 1000 W/m2 and temperature 25 o C. P2 represents the output power at insolation 600 W/m2 and temperature 25 o C. P3 represents the output power at insolation 1000 W/m2 and temperature 40 o C. From above all the readings and plots we observe that Incremental Conductance is the best method for obtaining maximum power. 5. CONCLUSIONS The work presents comparison between three different MPPT strategies summarized as, The PV simulation set up under MATLAB/Simulink environment has been established by the electrical specifications of the PV module SPI-SUN SIMULATOR 4600SLP. The simulation results for operating characteristics V-I, P-V and P-I for various cell temperature and solar insolation closely matched manufacturer data sheet of solar panel. The simple model allows a quick way to predict PV module behavior and tracking powers of all three MPPT algorithms are close to the corresponding maximum power. The algorithms discussed in this work show considerable superior accuracy and can be concluded that PV module output power for Incremental Conductance method is comparatively larger than P&O and Hill Climbing method for different conditions. The incremental conductance method has advantages of extracting more power compared to perturbation & observation method and hill climbing method and is hence more competitive than the other two methods in the PV system. REFERENCES [1] http://www.cea.nic.in/reports/monthly/inst_capacity/ may14.pdf [2] http://www.iea.org/papers/2011/weo2011_energy_fo r_all.pdf [3] http://natgrp.org/2013/04/13/power-shortage-and-its- impact-on-the-indian-economy/](https://image.slidesharecdn.com/matlabbasedcomparativestudiesonselectedmppt-140821050122-phpapp01/75/Matlab-based-comparative-studies-on-selected-mppt-7-2048.jpg)
![IJRET: International Journal of Research in Engineering and Technology eISSN: 2319-1163 | pISSN: 2321-7308 _______________________________________________________________________________________ Volume: 03 Issue: 07 | Jul-2014, Available @ http://www.ijret.org 14 [4] I. H. Altas, A.M. Sharaf, “A PV Array Simulation Model for MATLAB-Simulink GUI Environment”, IEEE 1-4244-0632-3/07/2007. [5] Huan-Liang Tsai, Ci-siang Tu, Yi-Jie Su, “Development of Generalized Photovolatic Model using MATLAB/Simulink”, Proceedings of the world congress on Engineering and Computer science 2008 [6] Hairul Nissah Zainudin, Saad Mekhilef, “Comparison Study of Maximum Power Point Tracker Techniques for PV Systems”, Proceedings of the 14th International Middle East Power Systems Conference (MEPCON’10), Cairo University, Egypt, December 19-21, 2010, Paper ID 278 [7] Samer Alsadi, Basim Alsayid “Maximum Power Point Tracking Simulation for PV Systems Using Perturb and Observe Algorithm”, International Journal of Engineering and Innovative Technology (IJEIT) Volume 2, Issue 6, December 2012 [8] Tarak Salmi, Mounir Bouzguenda, Adel Gastli, Ahmed Masmoudi “MATLAB/Simulink Based Modelling of Solar Photovoltaic Cell”, International Journal of Renewable Energy Research Vol.2, No.2, 2012 [9] Mohammad Seifi, Azura Bt. Che Soh, Noor Izzrib. Abd. Wahab, Mohd Khair B. Hassan, “A Comparative Study of PV Models in MATLAB/Simulink”, World Academy of Science, Engineering and Technology 74 2013 [10] M. Abdulkadir, A. S. Samosir, A. H. M. Yatim, “Modeling and Simulation of a Solar PV System, Its Dynamics and Transient Characteristics in LABVIEW”, International Journal of Power Electronics and Drive System (IJPEDS) Vol. 3, No. 2, June 2013, pp. 185~192 ISSN: 2088-8694 [11] Cemal Keles, B. Baykant Alagoz, Murat Akcin, Asim Kaygusuz, Abdulkerim Karabiber, “A PV System Model For MATLAB/Simulink Simulations” Proceeding of IEEE POWERENG'13, 4th International Conference on Power Engineering, Energy and Electrical Drives 2013 [12] N. Belhaouas , M.S. Ait Cheikh , A. Malek , C. Larbes “MATLAB-Simulink of PV system based on a two-diode model simulator with shaded solar cells”, Revue des Energies Renouvelables Vol. 16 N°1 (2013) 65 – 73 [13] Jayshree Sahu, Ashfaque Khan, Sahu S. K. “A Photo Voltaic system Simulation for MATLAB-Simulink”, International journal of Advanced research in Computer Science and Electronics Engineering (IJARCSEE) Volume 2, Issue 3, March 2013. [14] Hayrettin CAN “Model of a PV panel emulator in MATLAB-Simulink”, Turk J Elec Eng & Comp Sci (2013) 21: 301-308 [15] Mikel Santamaría, Sindia Casado, Mónica Aguado “Adjustment and Validation of a 25 kW PV System MATLAB/Simulink Model”, Renewable Energy Research Vol.3, No.3. [16] Pritam Chowdhury, Indrajit Koley, Sougata Sen, Dr.Pradip Kumar Saha, Dr.Gautam Kumar Panda “Modelling, Simulation and Control of a grid Connected Non Conventional Solar Power Generation System Using MATLAB”, International Journal of Advanced Research in Electrical, Electronics and Instrumentation Engineering Vol. 2, Issue 4, April 2013 [17] Paras Karki, Brijesh Adhikary “MATLAB/Simulink based Modeling and Simulation of Gird-connected Solar Photovoltaic System in Distribution Power Network”, Fifth International Conference on Power and Energy Systems, Kathmandu, Nepal | 28 - 30 October, 2013 [18] Alpesh P. Parekh, Bhavarth N. Vaidya, Chirag T. Patel “Modeling and Simulation Based Approach of Photovoltaic System”, Volume: 2 Issue: 4 April 2013, ISSN No 2277 – 8160 [19] Vineet Singla, Vijay Kumar Garg “Modeling of Solar Photovoltaic Module & Effect of Insolation Variation using MATLAB/Simulink”, International Journal of Advanced Engineering Technology E-ISSN 0976- 3945](https://image.slidesharecdn.com/matlabbasedcomparativestudiesonselectedmppt-140821050122-phpapp01/75/Matlab-based-comparative-studies-on-selected-mppt-8-2048.jpg)

This document discusses the development of a MATLAB simulation model to compare the performance of three maximum power point tracking (MPPT) algorithms—perturbation and observation, incremental conductance, and hill climbing—used for solar photovoltaic (SPV) systems. The study evaluates these algorithms based on execution efficiency and accuracy, highlighting that the incremental conductance method offers faster response and better regulated output than the other two methods. Additionally, it emphasizes the importance of MPPT in optimizing the energy output from SPV systems under varying climatic conditions.