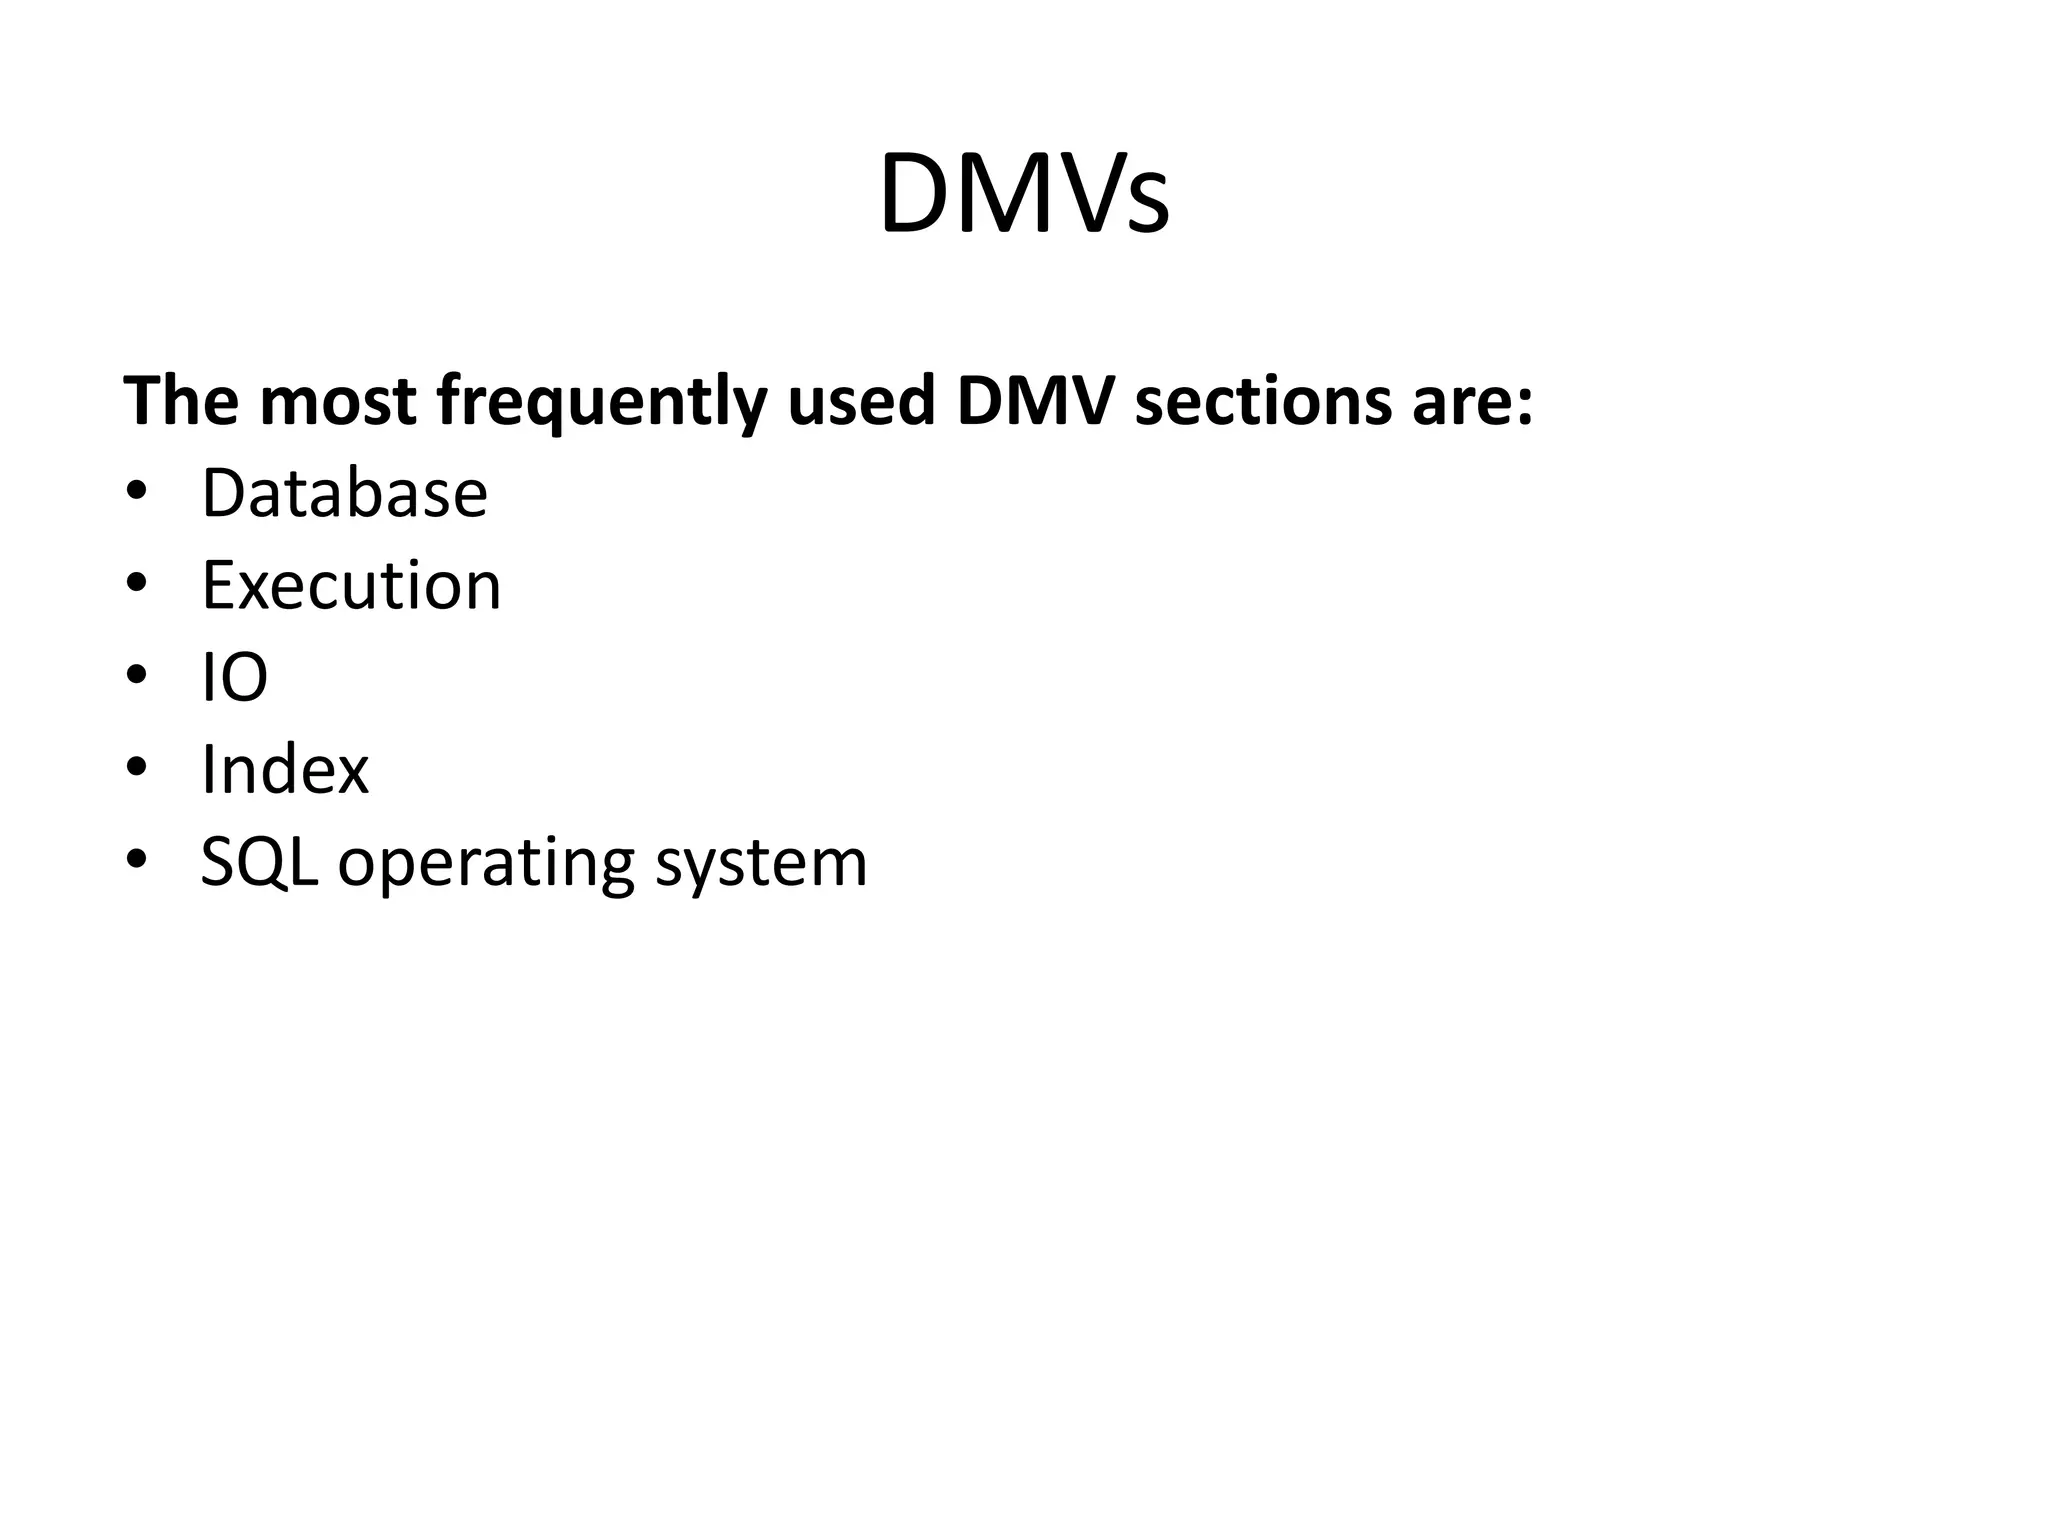
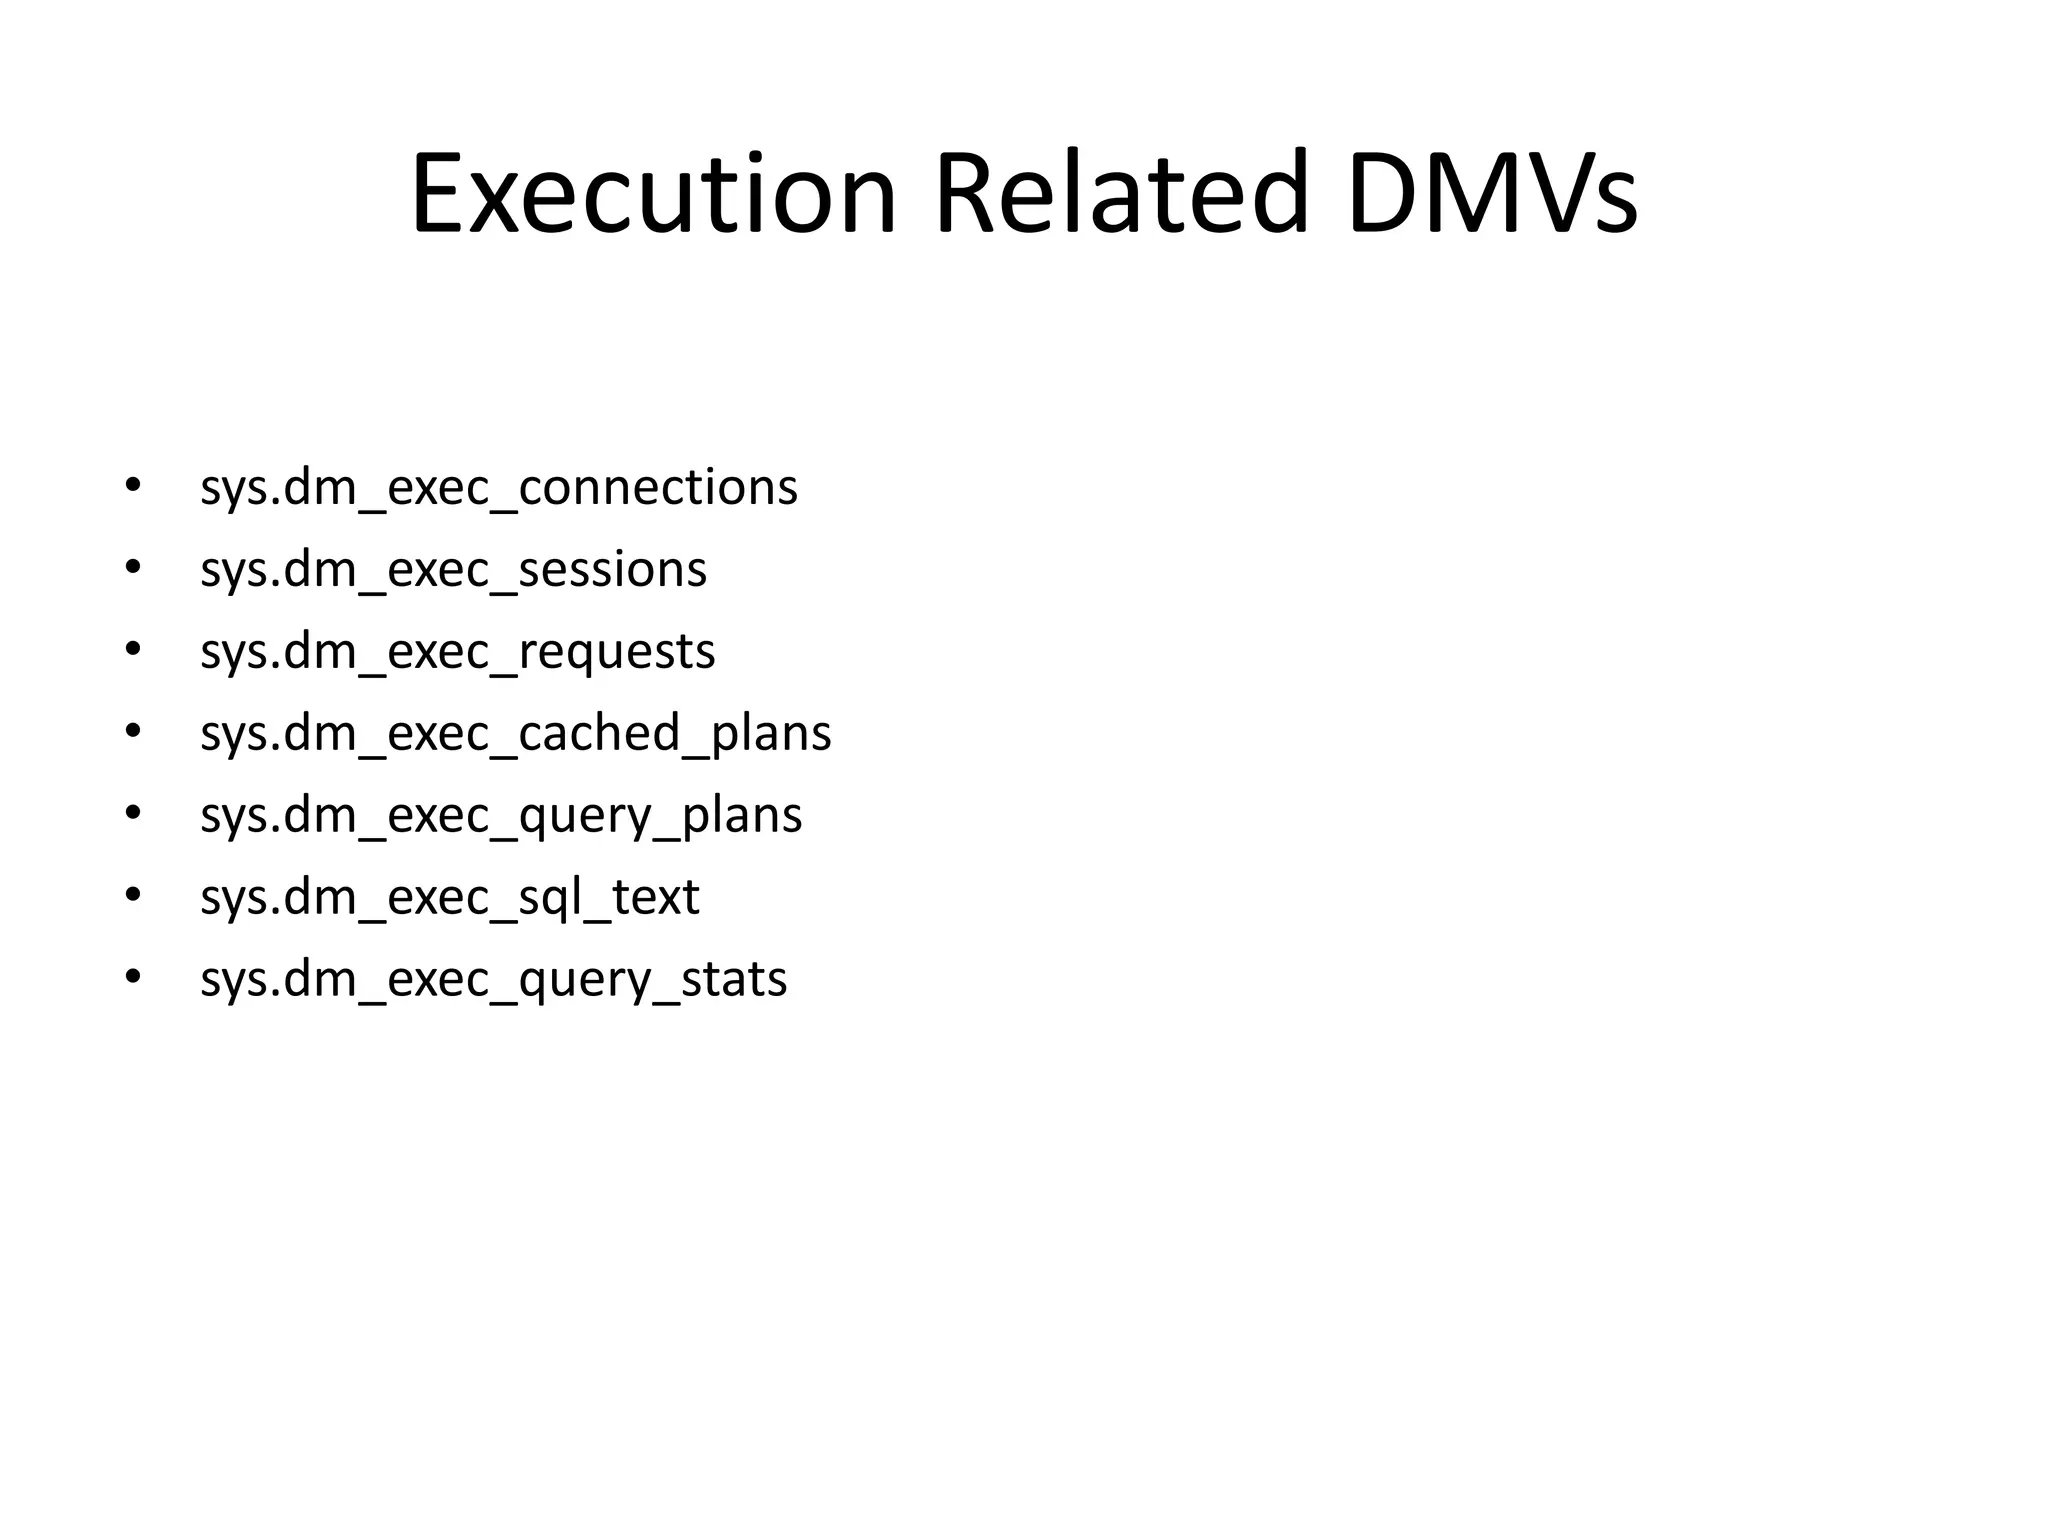
Dynamic management views and functions in SQL Server provide information to monitor server health, diagnose issues, and tune performance. There are server-scoped and database-scoped DMVs. Common DMV categories include database, execution, I/O, index, and operating system. The Performance Monitor tool in Windows collects counters related to physical disk, memory, CPU, and network usage to identify bottlenecks. High disk queue lengths, low available memory, or high processor utilization could indicate performance issues.


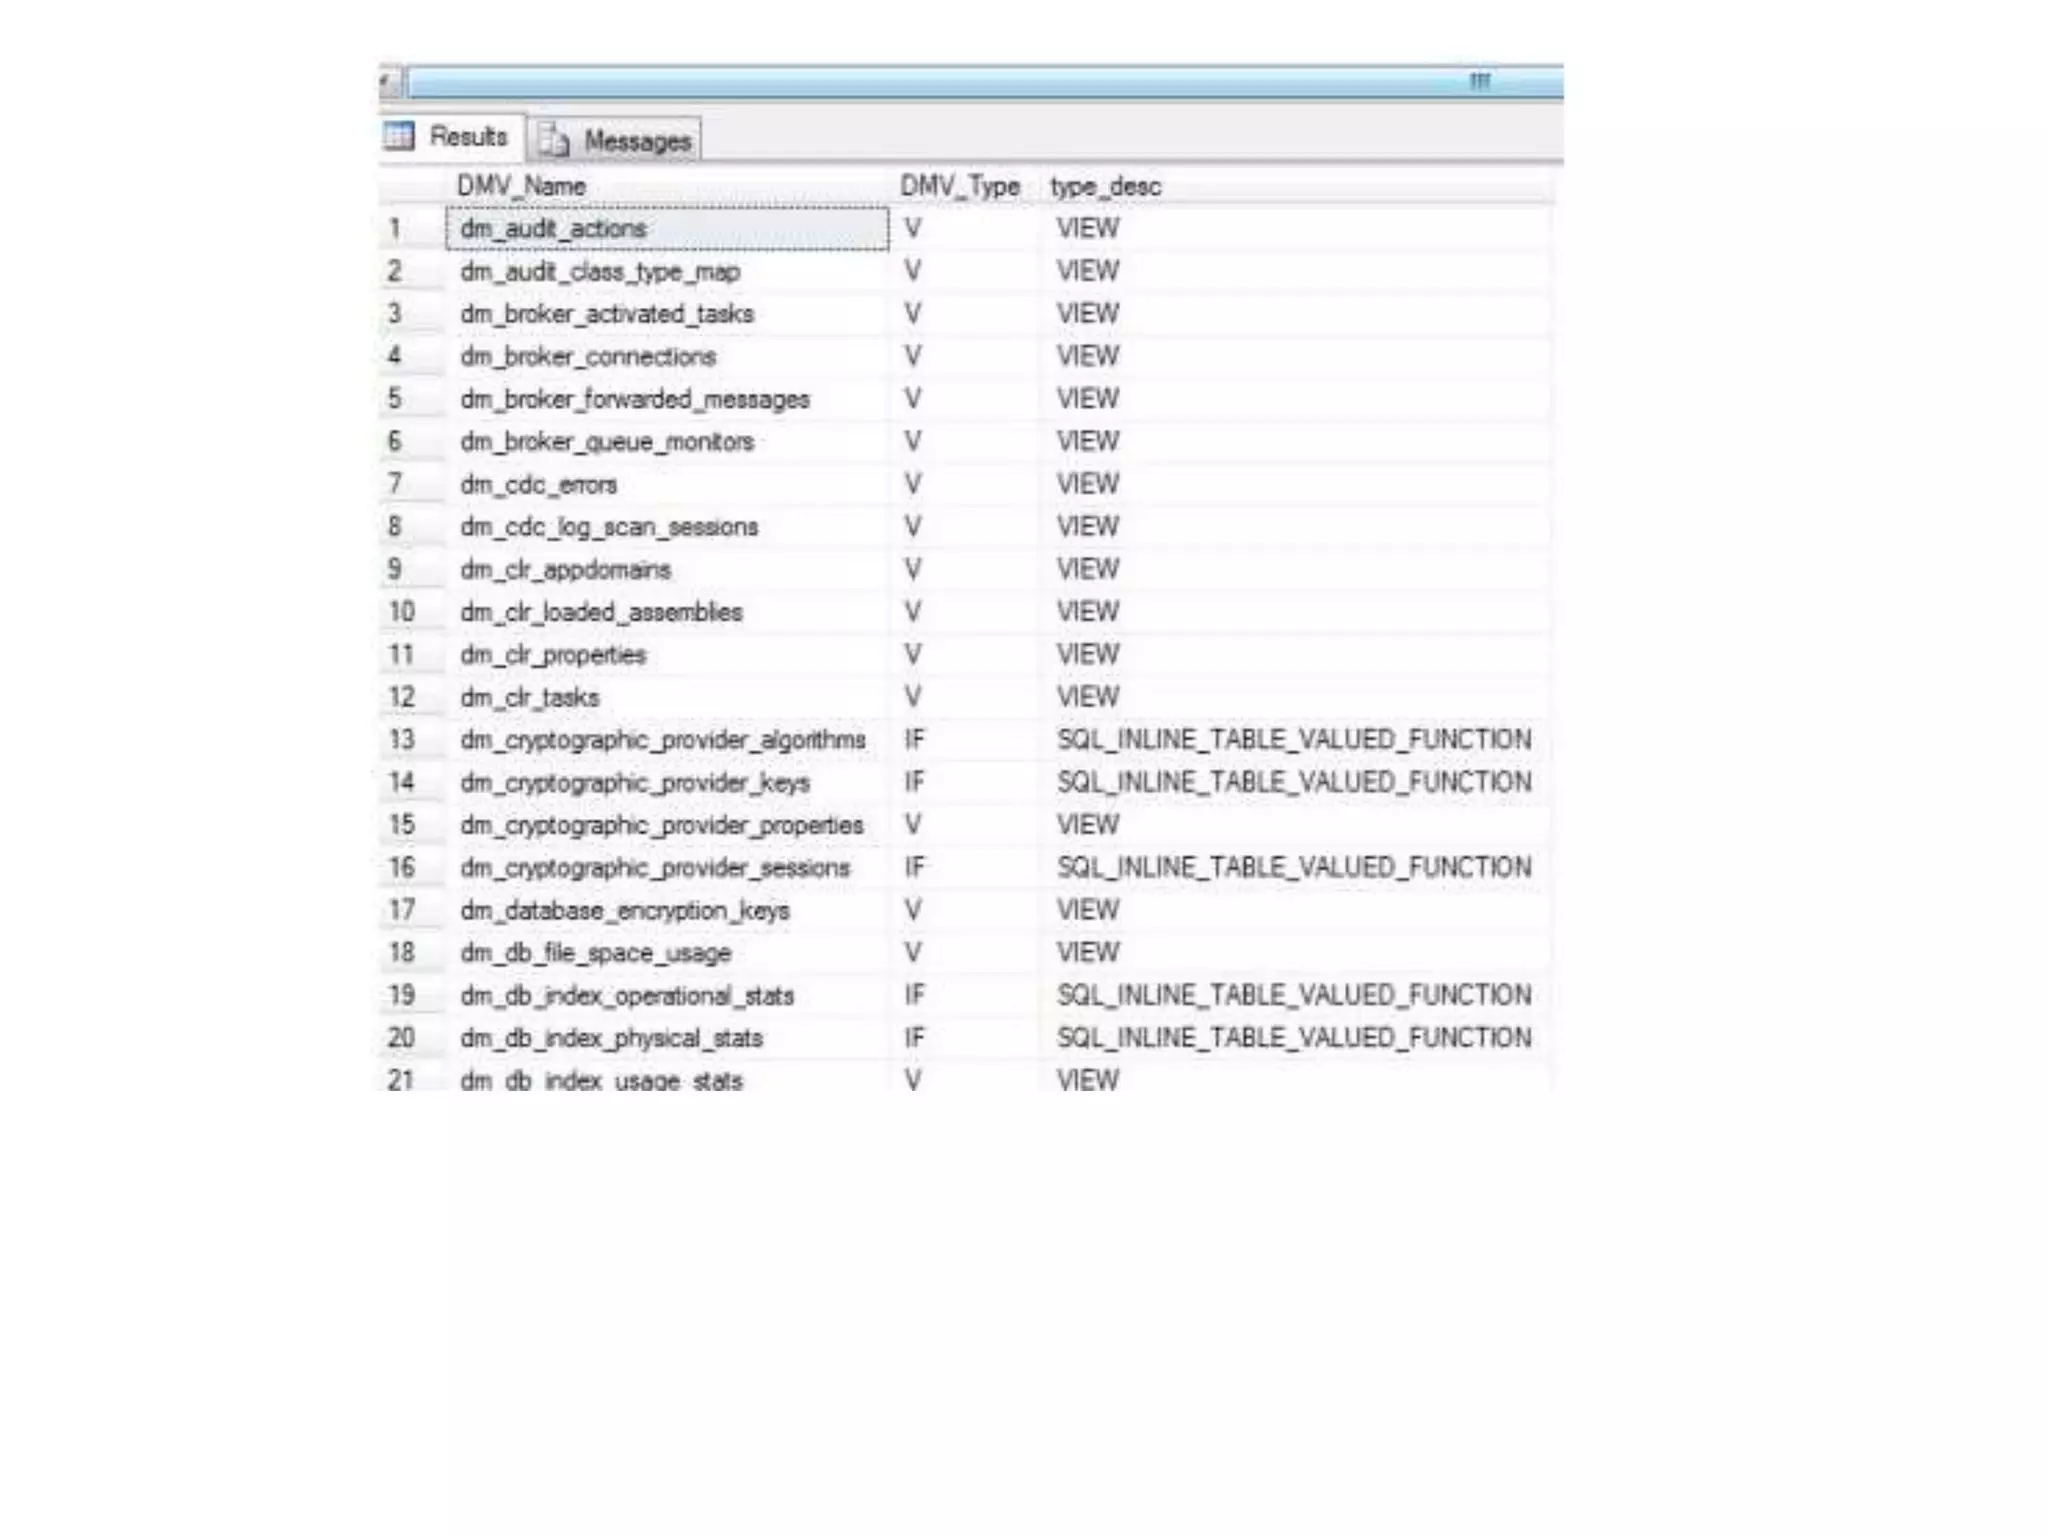
![Listing DMVs SELECT name AS DMV_Name, [type] AS DMV_Type, type_desc FROM sys.system_objects WHERE name LIKE 'dm_%' ORDER BY name SELECT count(*) TotalDMVCount FROM sys.system_objects WHERE name LIKE 'dm_%'](https://image.slidesharecdn.com/dmvssqlserver-170809181248/75/Dmv-s-Performance-Monitor-in-SQL-Server-5-2048.jpg)