Download to read offline
![Dhaneesh T et al.,International Journal of Computer Engineering In Research Trends Volume 3, Issue 4, April-2016, pp. 162-164 © 2016, IJCERT All Rights Reserved Page| 164 dataset would solve the problem of data analysis. Scilab was used to demonstrate the method of data fit to a curve using Least Squares Method to reduce the noise factor while considering a vast data set. The sum of the squares of the offset values are used instead of the offset absolute values itself because this allows the residuals to be treated as a continuous differentiable quantity and thus reducing the noise. A sample curve that was generated using the least squares method is shown below in the Fig 5.1 Fig 5.1: Sample Curve generated using Least Squares Method 6. CONCLUSION Scilab tool was used to demonstrate the creation of polynomial equation for the given data set.Future enhancements for this idea will include usage of Machine Learning algorithms to generate the polynomial equations for the given data set. This will help us in creating a model that can update the existing equation due to merging of more data with the archived data for the same metrics. REFERENCES [1] Haijun Chen, “A SPECIAL LEAST SQUARES METHOD FOR CURVE FITTING”, Measurement and Control Group, Dept. Electrical Engineering, Eindhoven University of Technology, Postbus 513, 5600 MB Eindhoven, The Netherlands. [2] Aimin Yang, “The Research on Parallel Least Squares Curve Fitting Algorithm” College of Science Hebei Polytechnic University Tangshan, Hebei Province, 063009 China. [3] Junyeong Yang and Hyeran Byun “Curve Fitting Algorithm Using Iterative Error Minimization for Sketch Beautification”, Dept. of Computer Science, Yonsei University, Seoul, Korea, 120-749 [4] G. Taubin, “An improved algorithm for algebraic curve and surface fitting”, Proc. Fourth 658-665, Berlin, Germany.](https://image.slidesharecdn.com/v3i403-160518192015/75/Data-Trend-Analysis-by-Assigning-Polynomial-Function-For-Given-Data-Set-3-2048.jpg)

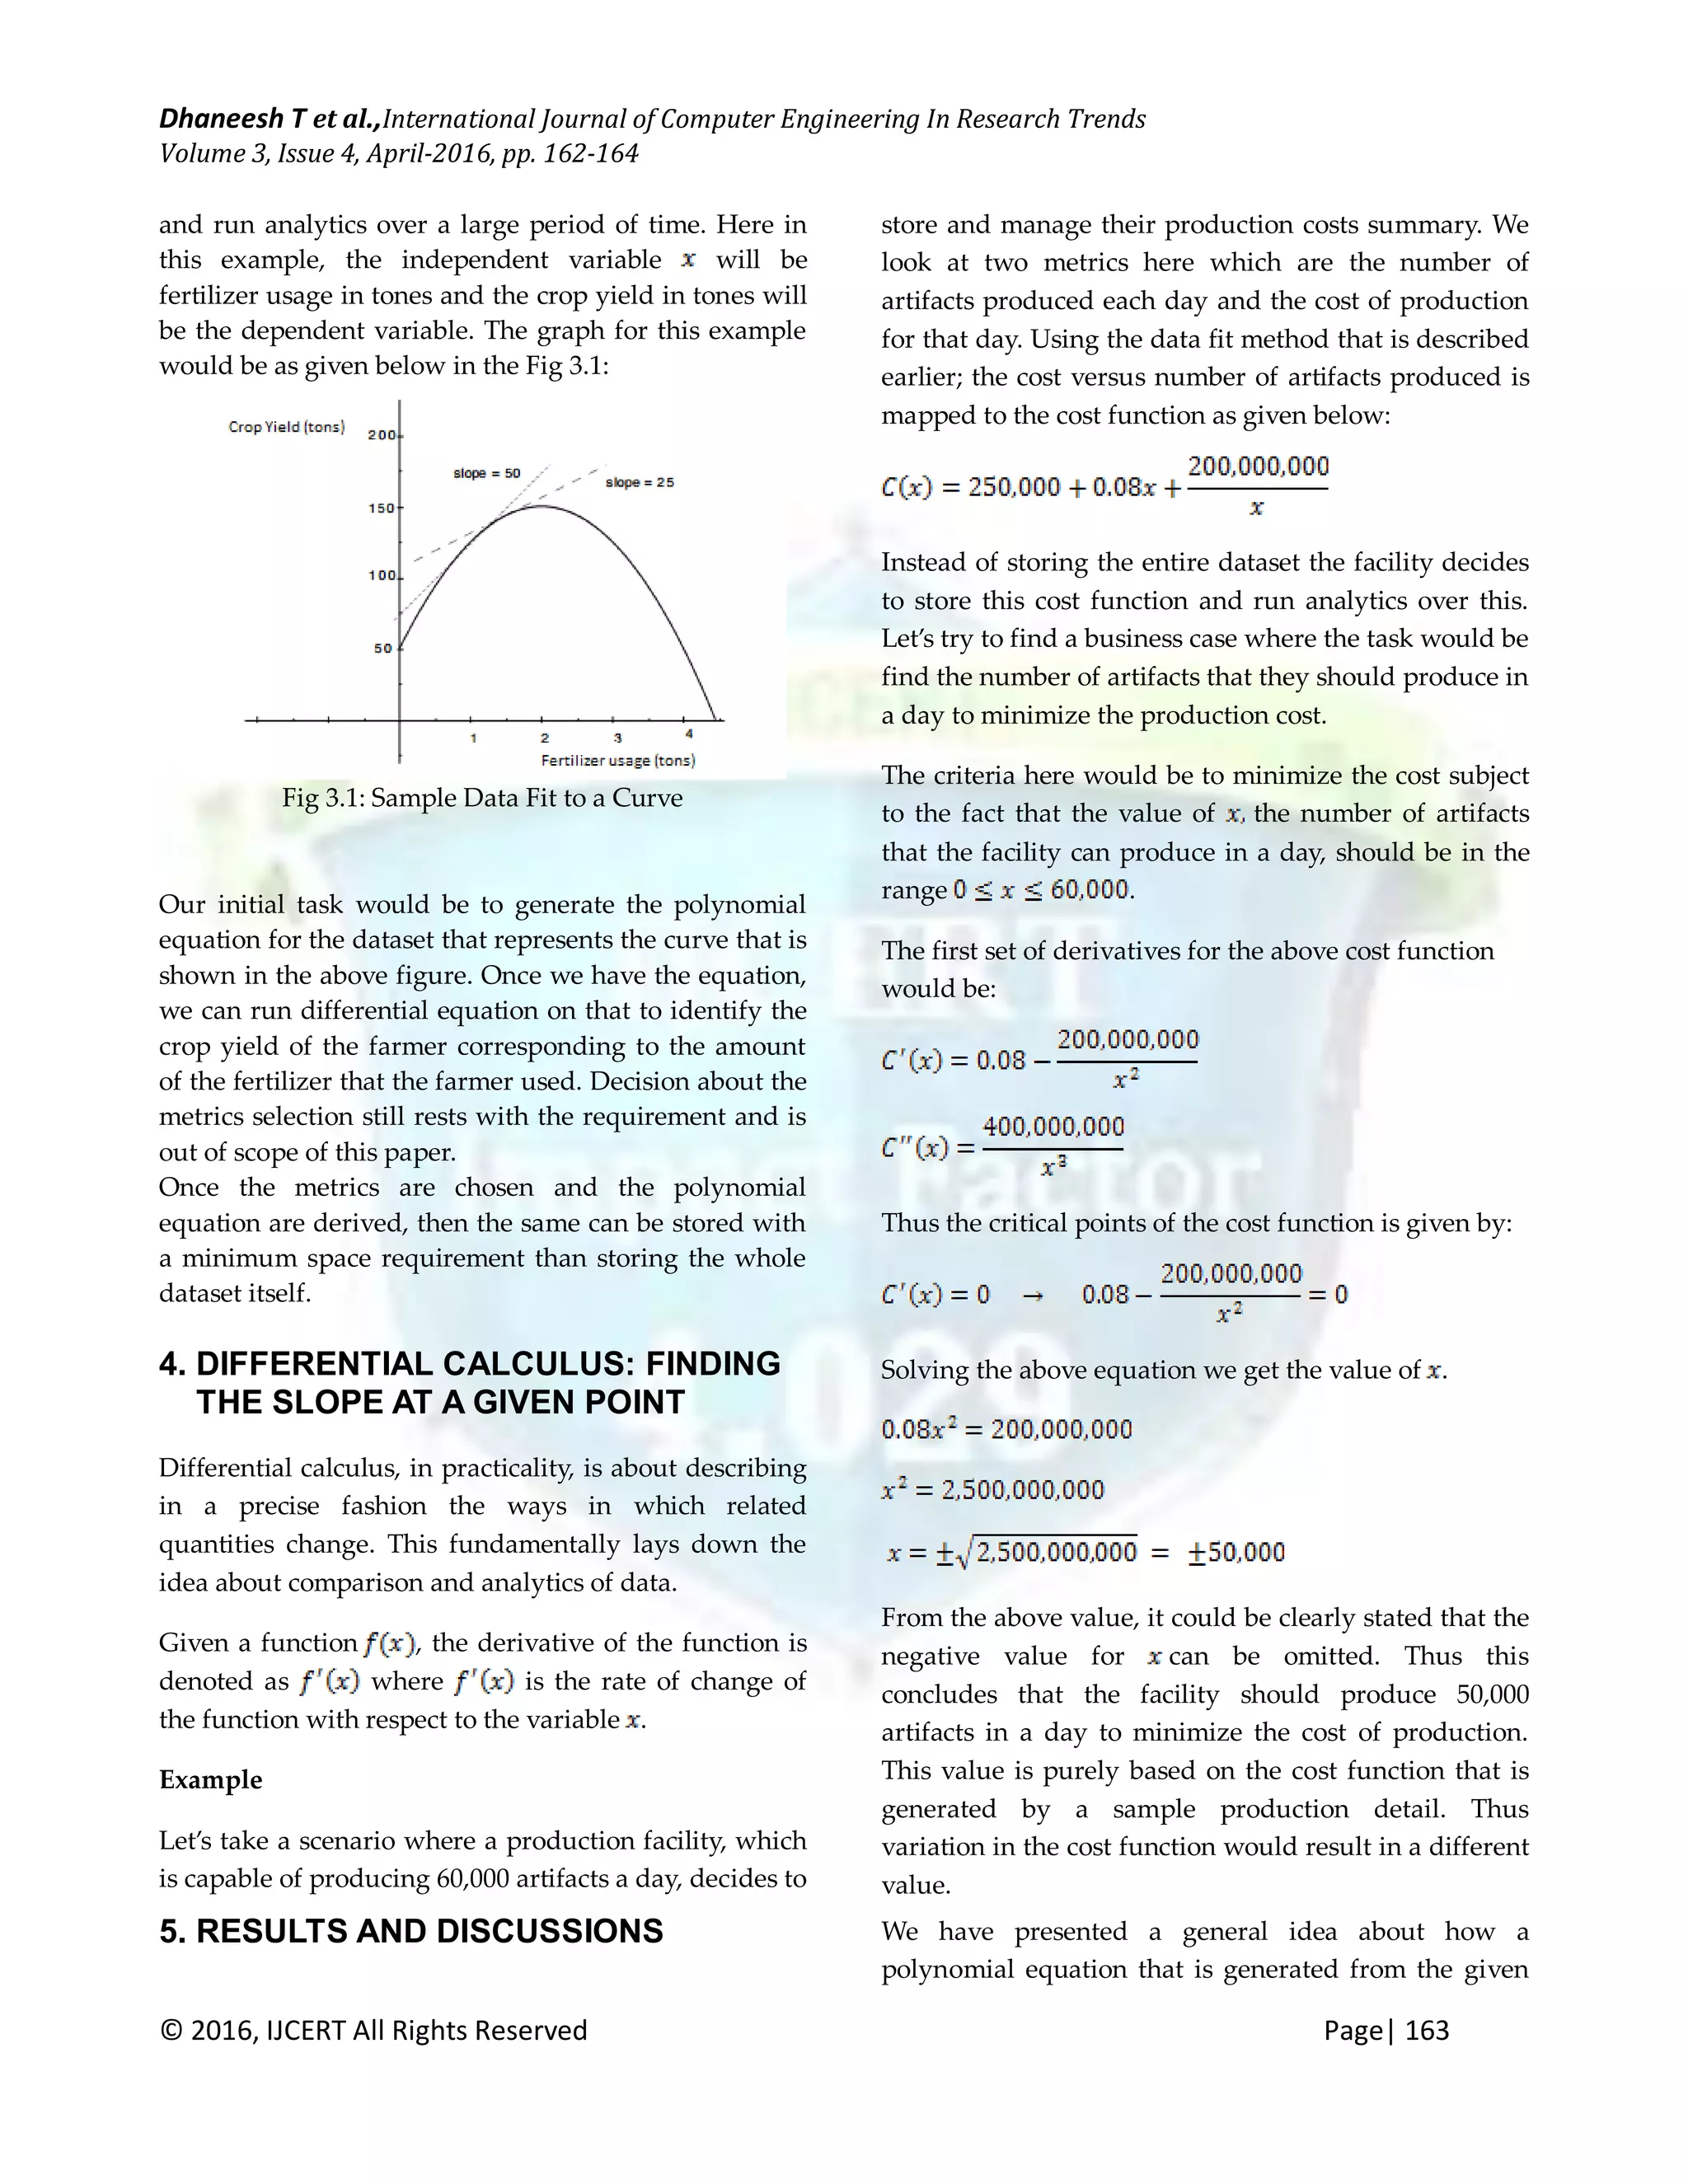
This paper discusses a method for generating polynomial equations from data sets using a least-squares technique for trend analysis and data aggregation. It highlights the advantages of reduced storage needs and smoother results compared to traditional data storage methods, outlining applications in various fields such as customer satisfaction and stock market forecasting. The paper concludes with future enhancements involving machine learning to refine polynomial equation generation.