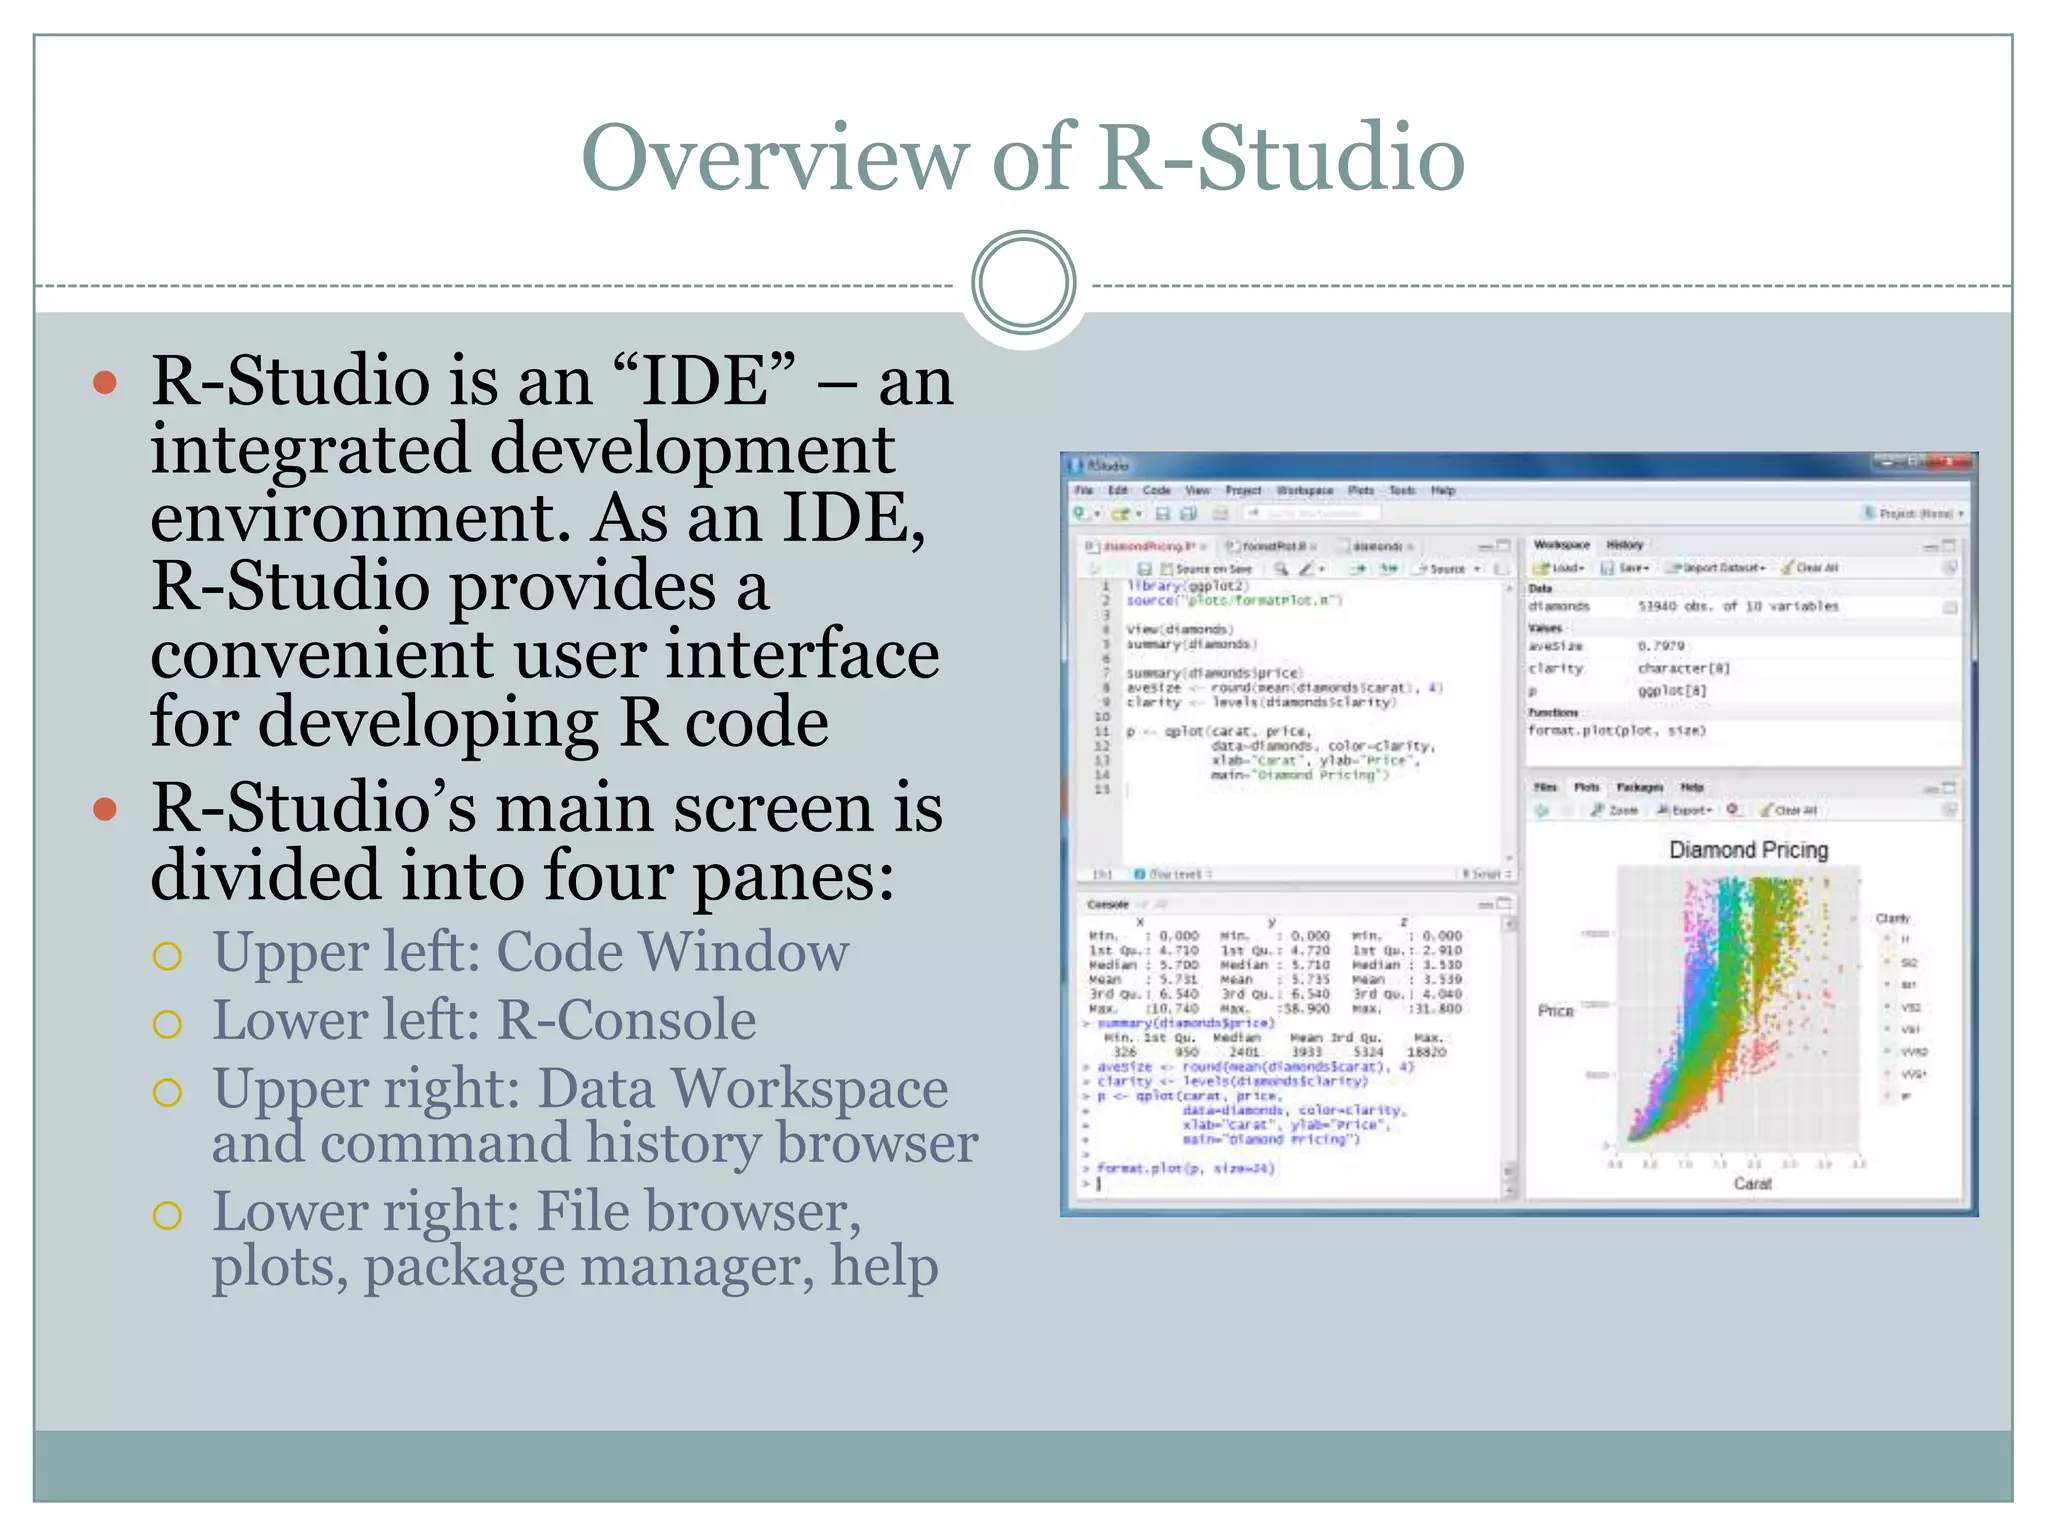
Installing and Using R-Studio JEFFREY STANTON SCHOOL OF INFORMATION STUDIES SYRACUSE UNIVERSITY
Overview of R-Studio  R-Studio is an “IDE” – an integrated development environment. As an IDE, R-Studio provides a convenient user interface for developing R code  R-Studio’s main screen is divided into four panes:     Upper left: Code Window Lower left: R-Console Upper right: Data Workspace and command history browser Lower right: File browser, plots, package manager, help
Installing R-Studio  Make sure to install R first, before trying to install R- Studio; generally it makes sense to install or upgrade to the latest version of R before installing R-Studio  The free software download is available at http://www.rstudio.org/  If you reach a page where you are asked to choose between installing R-Studio server and installing Rstudio as a desktop application choose desktop application  After installing, run R-Studio and type a command in the console window such as “2+2”
Creating Your First Function  We are going to build up slowly towards creating a function that calculates the statistical “mode” (the most frequently occurring value in a vector)  The upper left hand pane displays a blank space under the tab title “Untitled1.” Click in that pane and type the code to the right: MyMode <- function(myVector) { return(myVector) }
What Does it Do? MyMode <- function(myVector) { return(myVector) }  The name of the function is MyMode  The function receives one “argument” when it is called: Within the function, the argument is known as myVector  The function does not do anything yet, except for returning a copy of myVector
Before You Can Use Your New Function MyMode <- function(myVector) { return(myVector) }  Before you can actually “call” this function from the R command line, you have to tell R that it exists!  The way to do this is to highlight the whole function with your mouse – all the way from the first “M” to the final “}” – and then click the “Run” button just above and to the right of the code  You can check that your function is defined by looking in the Workspace area in the upper right pane, scrolling down to the Functions list, and seeing MyMode in the list
Let’s Test it Out > tinyData <- c(1,2,1,2,3,3,3,4,5,4,5) > MyMode(tinyData)  Type this code above into the R console, which is the lower left pane; don’t type the “>” – that is the command prompt  The first line makes a small vector of numbers called “tinyData” using the “c()” concatenate function  The second line passes tinyData to our function  The R console will display the result: Can you predict what it will be?
Adding New Stuff to MyMode MyMode <- function(myVector) { uniqueValues <- unique(myVector) return(uniqueValues) }  In the code above, we have added a call to a built in R function called unique() that returns an unduplicated list of the data in the vector it receives  Don’t forget to highlight the whole function with your mouse – all the way from the first “M” to the final “}” – and then click the “Run” button just above and to the right of the code  You can save yourself having to do that every time by clicking the checkbox “Source on Save” and then saving your code file after you make each change  Run MyMode(tinyData) again from the R console command line and see what the result looks like; You should be able to predict what it will be!
Finishing Up MyMode MyMode <- function(myVector) { uniqueValues <- unique(myVector) uniqueCounts <- tabulate(myVector) return(uniqueValues[which.max(uniqueCounts)]) }  We have added two new lines to this version: The first one is easy, the second one is hard  The first line, uniqueCounts <- tabulate(myVector), counts up how many times each unique value appears in myVector; if the lowest element in the vector is 1 and there are a total of three 1s in the vector, then the first element returned by tabulate() would be three  The second line uses the [ ] notation to pick a single item out of uniqueValues, but which one? The function which.max() returns the index (i.e., the ordinal number) of the element with the largest value in it argument uniqueCounts
Now Test!  Make sure to select all of your MyMode() code and click Run (or use Source on Save and do a save)  Then test your final function using the R console command line; type MyMode(tinyData) just as before  You can try making more vectors like tinyData with different sets of numbers in them  Your goal is to try to “break” MyMode(), i.e., to find a flaw in it; the chapter in “Introduction to Data Science” exposes one of the flaws in this code
Review  In this segment you installed R-Studio and fired it up  You created your first custom-designed function, called MyMode() and design to calculate the statistical mode  You “sourced” MyMode() so that R became aware of the definition of the function and then you tested it with a little bit of data  If you followed along in “Introduction to Data Science” you found at least one way in which MyMode() failed as well as some suggestions for fixing it up
Chapter Challenge  The Chapter Challenge for this chapter of Introduction to Data Science asks you to create a function that creates a distribution of sampling means from an input vector  You will have to refer to the previous chapter to remind yourself of the code that creates sampling distributions of means  Hint: One of the most important things to think about early on is what arguments your function will need to receive; in this case you will obviously need to pass in the vector of data, but what else will the function need to know in order to create a sampling distribution?

Chapter9 r studio2

  • 1.
    Installing and UsingR-Studio JEFFREY STANTON SCHOOL OF INFORMATION STUDIES SYRACUSE UNIVERSITY
  • 2.
    Overview of R-Studio R-Studio is an “IDE” – an integrated development environment. As an IDE, R-Studio provides a convenient user interface for developing R code  R-Studio’s main screen is divided into four panes:     Upper left: Code Window Lower left: R-Console Upper right: Data Workspace and command history browser Lower right: File browser, plots, package manager, help
  • 3.
    Installing R-Studio  Makesure to install R first, before trying to install R- Studio; generally it makes sense to install or upgrade to the latest version of R before installing R-Studio  The free software download is available at http://www.rstudio.org/  If you reach a page where you are asked to choose between installing R-Studio server and installing Rstudio as a desktop application choose desktop application  After installing, run R-Studio and type a command in the console window such as “2+2”
  • 4.
    Creating Your FirstFunction  We are going to build up slowly towards creating a function that calculates the statistical “mode” (the most frequently occurring value in a vector)  The upper left hand pane displays a blank space under the tab title “Untitled1.” Click in that pane and type the code to the right: MyMode <- function(myVector) { return(myVector) }
  • 5.
    What Does itDo? MyMode <- function(myVector) { return(myVector) }  The name of the function is MyMode  The function receives one “argument” when it is called: Within the function, the argument is known as myVector  The function does not do anything yet, except for returning a copy of myVector
  • 6.
    Before You CanUse Your New Function MyMode <- function(myVector) { return(myVector) }  Before you can actually “call” this function from the R command line, you have to tell R that it exists!  The way to do this is to highlight the whole function with your mouse – all the way from the first “M” to the final “}” – and then click the “Run” button just above and to the right of the code  You can check that your function is defined by looking in the Workspace area in the upper right pane, scrolling down to the Functions list, and seeing MyMode in the list
  • 7.
    Let’s Test itOut > tinyData <- c(1,2,1,2,3,3,3,4,5,4,5) > MyMode(tinyData)  Type this code above into the R console, which is the lower left pane; don’t type the “>” – that is the command prompt  The first line makes a small vector of numbers called “tinyData” using the “c()” concatenate function  The second line passes tinyData to our function  The R console will display the result: Can you predict what it will be?
  • 8.
    Adding New Stuffto MyMode MyMode <- function(myVector) { uniqueValues <- unique(myVector) return(uniqueValues) }  In the code above, we have added a call to a built in R function called unique() that returns an unduplicated list of the data in the vector it receives  Don’t forget to highlight the whole function with your mouse – all the way from the first “M” to the final “}” – and then click the “Run” button just above and to the right of the code  You can save yourself having to do that every time by clicking the checkbox “Source on Save” and then saving your code file after you make each change  Run MyMode(tinyData) again from the R console command line and see what the result looks like; You should be able to predict what it will be!
  • 9.
    Finishing Up MyMode MyMode<- function(myVector) { uniqueValues <- unique(myVector) uniqueCounts <- tabulate(myVector) return(uniqueValues[which.max(uniqueCounts)]) }  We have added two new lines to this version: The first one is easy, the second one is hard  The first line, uniqueCounts <- tabulate(myVector), counts up how many times each unique value appears in myVector; if the lowest element in the vector is 1 and there are a total of three 1s in the vector, then the first element returned by tabulate() would be three  The second line uses the [ ] notation to pick a single item out of uniqueValues, but which one? The function which.max() returns the index (i.e., the ordinal number) of the element with the largest value in it argument uniqueCounts
  • 10.
    Now Test!  Makesure to select all of your MyMode() code and click Run (or use Source on Save and do a save)  Then test your final function using the R console command line; type MyMode(tinyData) just as before  You can try making more vectors like tinyData with different sets of numbers in them  Your goal is to try to “break” MyMode(), i.e., to find a flaw in it; the chapter in “Introduction to Data Science” exposes one of the flaws in this code
  • 11.
    Review  In thissegment you installed R-Studio and fired it up  You created your first custom-designed function, called MyMode() and design to calculate the statistical mode  You “sourced” MyMode() so that R became aware of the definition of the function and then you tested it with a little bit of data  If you followed along in “Introduction to Data Science” you found at least one way in which MyMode() failed as well as some suggestions for fixing it up
  • 12.
    Chapter Challenge  TheChapter Challenge for this chapter of Introduction to Data Science asks you to create a function that creates a distribution of sampling means from an input vector  You will have to refer to the previous chapter to remind yourself of the code that creates sampling distributions of means  Hint: One of the most important things to think about early on is what arguments your function will need to receive; in this case you will obviously need to pass in the vector of data, but what else will the function need to know in order to create a sampling distribution?